Normally, I don’t bother to discuss paleoclimatological reconstructions. The reason: most try, some through questionable methods, to illustrate that the recent warming is unusual and could only be explained by the increased emissions of manmade greenhouse gases. And that’s the same claim being made for the instrument temperature record by proponents of the hypothesis of human-induced global warming. But as I’ve been illustrating and discussing for 4 years, ocean heat content data and satellite-era sea surface temperature indicate Mother Nature is responsible for the warming of the global oceans, see here [42MB], so I don’t find claims of unprecedented, human-induced global warming to be realistic. However, I noticed something that’s very obvious in an illustration from a recent paper that’s getting some press, and I wanted to make it easier to see, for those who’ve overlooked it.
There have been numerous discussions about the Kaufman et al (2013) paper “Continental-scale temperature variability during the past two millennia”, also known as the PAGES (PAst Global changES) reconstruction. ClimateAudit has been reporting on it for a number of days. See Steve McIntyre’s posts here, here and especially here. WattsUpWithThat has discussed the paper here and here. SkepticalScience responded to the paper as could be expected here. RealClimate’s post includes an interesting illustration, which drew my attention to the paper. It’s a modified version of Figure 2 from Kaufman et al (2013). I’ve included the original version from the paper as my Figure 1. The source of the illustration is here.

Figure 1
The illustration presents their color-coded temperature anomaly reconstruction as 30-year mean temperature anomalies for the individual regions, which are further identified in the map (Figure 1) from the Kaufman et al (2013). Clearly, there has been, as the title of the paper states, “Continental-scale temperature variability during the past two millenia”. In some of the regions, recent temperatures are warmer than they have been in the past, but in others, the recent temperatures have been exceeded in the past or are comparable. Here, let me make it easier to see.
I’ve modified Figure 2 from Kaufman et al (2013) to show only the regions where recent temperatures are warmest in my Figure 2. Those 3 regions include only the Arctic, Asia and Australasia. In my Figure 3, I’ve modified their illustration to show the regions where recent temperatures are cooler than or comparable to past temperatures. Those 4 regions are Europe, North America, South America and Antarctica.

Figure 2
####
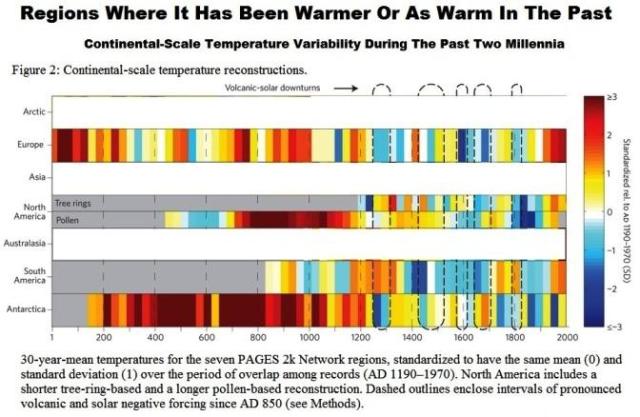
Figure 3
Something else also stands out in the 3 regions where current temperatures are warmest, my Figure 2. Only one of the reconstructions extends back the full 2000 years. Would Asia and Australasia have warmer temperatures than those we’ve experienced recently if their reconstructions could be extended farther back in time? Dunno.
CLOSING
Clearly, the claims of unprecedented recent temperatures are not supported by the regional reconstructions. Four of the seven regions presented by Kaufman et al (2013) clearly show that recent temperatures are comparable to past temperatures or they have been exceeded in the past. This can also be seen in the individual graphs presented in Steve McIntyre’s post here. Now, hasn’t this been one of the arguments by climate skeptics since the hockey stick was introduced—that the hockey-stick appearance is a regional phenomenon? That regional reconstructions show current temperatures have been exceeded in the past in many parts of the globe?
Thanks Bob. It is hard to believe unprecidented claims that do not even look at areas, eg. Asia and Australia, and where are Africa and S. America? Looks like they only looked where they wanted, and ignored most of the landmass.
We had a bunch of volcanoes going off between 1200 and 1850 and none between 0 AD and 1000 AD? Interesting (yet unbelievable).
Which is more frightening, North Korea with nukes, or that a branch of influential scientists continue to mercilessly torture data into confessing a climate change disaster that is clearly not happening?
@DirkH – Pompeii and Herculaneum never happened?
Shame on those Romans for exaggerating!
”hasn’t this been one of the arguments by climate skeptics”
I suspect we’ll be seeing more and more “skeptic arguments” being slipped into the peer-reviewed literature, rebranded of course without any acknowledgement that there was ever anything going on here but the normal progress of science. It’s becoming more and more obvious to more and more people that not only did “climastrologists” jump to the CAGW conclusion before sufficient evidence accumulated but that the conclusion has little hope of being proven right at this point. It now appears to all but the true believers that natural climate “forcings” overwhelm any tiny influence of burning fossil fuels, but climate science has to climb down a pretty tall ladder they’ve ascended and start building a new ladder that doesn’t exclude evidence that doesn’t fit the CAGW narrative. This could take decades, perhaps generations, but in the age of the internet who knows perhaps the rate of descent will be unprecedented.
John West, you write “This could take decades, perhaps generations, but in the age of the internet who knows perhaps the rate of descent will be unprecedented.”
As I have noted many times, future empirical data on such things as global temperatures and Arctic sea ice extent, hang over CAGW like a Sword of Damocles. The warmists have no influence over future empirical data. What this data will be, we do not know. But it is not difficult to think up scenarios where this data could cast so much doubt on the validity of CAGW in the very near future, this year for example with Arctic sea ice, that the whole house of cards that is CAGW could come crashing down.
Good points Bob, and yes, it’s a pity about lack of the full time range in most of the data sets.
The pattern that my eyes fancied they saw in the original figure was that those data sets that showed higher temperatures in the past had lower ones in the present, and vice versa, which looked to me as though there was a similar sort of periodicity in each data set, but the timing of this was staggered betweeen different regions.
I therefore expected your post to point this out as well, and to conclude that this was a demonstration of the differential influence of oceanic circulation between the various regions.
Damned neural pattern-recognition software!
@ tisdale
3 out of 4 not warmer than past are on the SH, there is a lot of sea and ocean there, warming goes slower;
I must sound a bit like a broken record, but every time I see a reconstruction which states it is warmer now, in the Arctic, than it was a thousand years ago, I point out the Vikings of Greenland could not have lived as they did, at current temperatures. (They are trying to raise livestock in Greenland once again, but it require some imports (which Vikings didn’t have,) and at nowhere near the levels Vikings achieved.)
The following paper is great reading, about Vikings in Greenland in general, and the excavation of the “Garden Under Sand” settlement in particular:
http://www.collectionscanada.gc.ca/obj/s4/f2/dsk2/ftp04/mq22551.pdf
The following quote from that paper ought send farmers hustling up to Greenland, if it is truly warmer now.
“For the Vatnaverfi district of the Eastern Settlement it is estimated that 100.000 sheep and goats may have been pastured at the height of the Norse period (Jacobsen 1987). The resources these animals required included about 700.000.000 kg of hay and between 36.500.000 to 73.000.000 litres of water annualy or 1.917.808 kg of fodder and 100.000 to 200.000 litres of water daily.”
(And that quote doesn’t even mention the 2000 cows, which are not as tough as sheep from Iceland.)
Jim Cripwell says:
April 23, 2013 at 6:08 am
But of course they do. The warmists are in control of all the data-collection systems. They can report any numbers they like. There can be icicles hanging from your ceiling and they’ll report the warmest season on record. Even Anthony’s nemesis, BEST, which is an honest attempt to grade weather stations for quality, is using someone else’s numbers.
Pardon me for being a cynic but if I were one of the bad guys, that’s exactly how I would “hide the decline.”
What really will be irksome is that, when the scientists finally admit that there has been no anthropogenic warming, they will do so in a way that gives them all the credit for “discovering” that and none to the people who’ve fought to expose the lie for decades. It’s like the explanation that Soviet Communism fell because Gorbachev, you know, was a nice guy and wanted to disassemble it and give his people more freedom, and not because the US was so successful that the Soviet Union went broke trying to keep up. Nope, no Ronnie Reagan, no “Star Wars,” just that it was time for that nice Mr. Marx and Mr. Lenin to step off the world stage after 75 years of murderous dictatorship. Thus it will be with the warmists.
maarten says: “3 out of 4 not warmer than past are on the SH, there is a lot of sea and ocean there, warming goes slower…”
But that does not explain the very obvious cooling in Antarctica, which should reflect sea surface temperatures of the Southern Ocean.
oldfossil writes “But of course they do.”
Sorry, I completely disagree. BEST is not original data. Thermometers in Stevenson screens, or remote sensing satellites meausure temperature. Satellite cameras measure sea ice extent. The warmists have no control of the raw data that is actually measured.
from a recent study…
“The summer ice melt in parts of Antarctica is at its highest level in 1,000 years, Australian and British researchers reported on Monday, adding new evidence of the impact of global warming on sensitive Antarctic glaciers and ice shelves.”
Seems that the regional temps above would not support such a claim, and may explain why they only went back 1000 years. Of course they cherry picked a location.
Bob Tisdale:
“Normally, I don’t bother to discuss paleoclimatological reconstructions. The reason: most try, some through questionable methods, to illustrate that the recent warming is unusual and could only be explained by the increased emissions of manmade greenhouse gases.”
One test of intellectual honesty is this: “Can you present your opponents argument fairly, or do you rely on distortion?”
Lets see what the author of this study said.
Kaufman:
“The pre-industrial trend was likely caused by natural factors that continued to operate through the 20th century, making 20th century warming more difficult to explain if not for the likely impact of increased greenhouse gasses,” Kaufman said.
According to Bob his opponents argument is this : recent warming could ONLY be explained by GHGs.
According to the author his argument is: 20th century warming is MORE DIFFICULT to explain if not for GHGs.
You see how easy it is to defeat what Kaufman never argued?
A minor point, but I find it interesting that the North American pollen data doesn’t entirely agree with the tree rings. The most recent data seems to show tree rings see it is warmer than normal, while pollen says, “Ho hum. Normal.”
“Those dirty rings! You try soaking them out. You try scrubbing them out. But still you have…”
(From an incredibly annoying old TV commercial in the United States.)
“Would Asia and Australasia have warmer temperatures than those we’ve experienced recently if their reconstructions could be extended farther back in time? Dunno.”
Recently, some scientists published a study showing that there was a medieval warm period on the “great Chinese plateau,” also known as the “top of the world.” I think that article was discussed in a post on WUWT.
Mosher,
“MORE DIFFICULT” Does that mean 95% certainty, robust, or what? These studies always have these types of weasel words (could, should, might, and now more difficult). Of course they are not claiming 100% certainty. Nor do we think those debunking these AGW studies claim 100% certainty.
Maybe you can show where the study ‘presents your opponents argument fairly’.
“Now, hasn’t this been one of the arguments by climate skeptics since the hockey stick was introduced—that the hockey-stick appearance is a regional phenomenon?”
I missed that one. Mann and other Alarmists have argued that the Medieval Warm Period is a regional phenomenon. They have done so in the face of powerful evidence to the contrary. The article under discussion here provides more evidence that the Medieval Warm Period is not a regional phenomenon.
What’s happening to Climate Audit format? is it me or something’s being worked on?
Steven Mosher says: “You see how easy it is to defeat what Kaufman never argued?”
Did I mention Kaufman in the sentence you quoted? Nope. I wrote and you quoted: “Normally, I don’t bother to discuss paleoclimatological reconstructions. The reason: most try, some through questionable methods, to illustrate that the recent warming is unusual and could only be explained by the increased emissions of manmade greenhouse gases.”
I made a general statement and you, Steven, applied it to Kaufman et al.
Regards
Bob,
Touché!
One recent study showing a Chinese medieval warm period is:
http://notrickszone.com/2013/04/15/back-to-the-penalty-box-chinese-paleo-climatolgists-slap-down-high-sticking-michael-mann/
A survey article on studies showing the MWP in China is:
http://www.co2science.org/subject/m/summaries/mwpchina.php
RE: Theo Goodwin
Thanks for those links.
The first link makes me wonder what sort of data Mann used, to create his map that shows Tibet as abnormally cold during the MWP, when it was in fact warmer than today.
The second link makes me wonder more, for those studies date from before Mann came up with his map, and they also suggest it was above normal where Mann states it was below normal.
Has Climate Audit gone over the data for Mann’s map?
All temperatures derived from anything other than a thermometer are nothing more than guesses. Some may be educated guesses, but they are still guesses. And in no way, shape or form can those derived temperatures be compared to modern temperatures measured by thermometer. That being said, we can however compare climate changes within a region from different periods where we have written records available – the Roman and medieval warm periods are good examples.
This is an extremely blatant straw man. Nobody claims unprecedented regional anomalies for all regions, the actual claim is that it is very likely that the global anomaly is unprecedented in at least the last millennium.
Kevin MacDonald:
I have a question.
At April 23, 2013 at 9:28 am you say
The global anomaly is the summation of all the local anomalies. Hence, a consideration of the probable validity of the global temperature requires assessment of the local reconstructions.
And the majority of the local reconstructions do not show unusual temperatures. This is not clear evidence that the “unprecedented recent temperatures”.
How is it a ‘straw man’ to assess the reconstruction of global temperature anomaly when assessing the claim that global temperature anomaly is unprecedented?
Richard
Bob’s general comment is pretty much exactly what Steve Mosher quotes Kaufman as saying (Kaufmann can’t explain recent warming without anthropogenic gases, etc.). Even if Bob had mentioned Kaufman, it would still have been an accurate comment, so I don’t see Steve’s point. That said, it’s important to quote accurately to give a true picture of an opponent’s position, something warmists rarely do.
@Steve Mosher
“Kaufman:
“The pre-industrial trend was likely caused by natural factors that continued to operate through the 20th century, making 20th century warming more difficult to explain if not for the likely impact of increased greenhouse gasses,” Kaufman said.
“According to Bob his opponents argument is this : recent warming could ONLY be explained by GHGs.
“According to the author his argument is: 20th century warming is MORE DIFFICULT to explain if not for GHGs.
+++++++++++++
I take your point. Now I turn it around for Kaufman:
What pre-industrial mechanism, other than CO2, caused the rise in Roman and Medieval temperatures that exceeded the contemporary ones? Does the claim that the part of the current trend exceeding ‘natural variation’, if attributable to human CO2 emissions, not clearly point to an earlier Medieval period with similar CO2 emissions arising from some as yet undiscovered source?
If the claim for modern CO2 rise is the only explanation (as far as Kaufman is concerned) for the current temperature trend “beyond natural variation’, then logically there must have been an earlier CO2 rise to cause the earlier trend. One goes with the other. If the earlier trend to even higher temperatures was entirely natural, then there is nothing to explain nor any need to invoke CO2 as a ’cause’ of anything.
They don’t have to be for their sum to be unusual or unprecedented.
It’s a straw man to assert that the fact that some regional temperatures are not unprecedented is somehow telling when your opponents are not arguing that temperatures in all regions are unprecedented and none of their case is predicated on it being true.
Clearly, the claims of unprecedented recent temperatures are not supported by the regional reconstructions. Four of the seven regions presented by Kaufman et al (2013) clearly show that recent temperatures are comparable to past temperatures or they have been exceeded in the past.
The PAGES 2k scientists conclude that recent global composite temperature (or at least the continents they covered) is unprecedented in 1400 years. That does not imply that each regional temperature must also be unprecedented, which as they note is not the case. But their data do support their conclusion. An average can be exceptional even if some of its parts are not exceptional by themselves.
RE: Theo Goodwin:
Your links got me irked to a degree where I had to write about what your links showed me:
http://sunriseswansong.wordpress.com/2013/04/23/be-concerned-about-cooling-not-global-warming/
The most interesting feature of the charts is the lack of agreement between pollen proxies and treemometers in North America in the period of overlap. Which one is correct, and can either one can be trusted? Unless those questions can be answered and the differences reconciled, I see no reason to trust in either proxy (based on this study). Is there a proxy having a rapid enough response to temperature to reflect recorded temperatures so that it can be verified empirically? Is there any paleo reconstruction that can be trusted and if so to what precision?
It would be fascinating extend those climatic timelines another thousand years, then to disaggregate that Figure 1, and lay next to the several regional strips the human historical timelines for those regions. Practically all the tribal migrations, wars, famines & disease catastrophes, etc. would show up as the consequence of significant swings in climate, with not-red being the colors of death and disaster.
How fortunate we are to have the energy resources to disdain such changes, although the green animists would have us go back the “the good old days”.
Caleb says:
April 23, 2013 at 10:50 am
RE: Theo Goodwin:
“Your links got me irked to a degree where I had to write about what your links showed me:”
Thanks for the mention. I read your post and recommend it to others.
Would be interesting if you also had a chart showing the number of proxies for each region versus time. Some of them are likely to be fairly ‘shallow’ even in modern times.
Kevin MacDonald:
I write to thank you for your answer (at April 23, 2013 at 10:47 am) to my question (at April 23, 2013 at 10:06 am).
OK. We could get involved in a semantic debate of what is or is not a ‘straw man’. I think there is no purpose in that, and it would distract from the subject of the thread. I merely mention that
a ‘straw man’ is a false argument posed to be defeated as a method to pretend the actual argument was defeated when, in fact, it was not addressed.
Clearly, you think Bob Tisdale has posed a straw man and I don’t.
Much more important than our difference of opinion is the reason for it. And, perhaps, that is worthy of debate.
Kaufman et al (2013) conclude that (paraphrased) recent global temperature is unprecedented for the most recent 1,400 years.
Bob Tisdale, I and others are saying the paper’s conclusion should be assessed by consideration of the indications of individual proxy indications which provide it.
We consider this assessment is needed because the considered proxies are said to be representative of the entire world. However, they do not cover the entire world: they cover 7 regions of it. Hence, for the conclusion to have high confidence then the assessed regions need to provide a clear indication of warming.
As illustration of this need, and purely hypothetically, consider if all assessed regions except one showed no change. Then, in that hypothetical and extreme case, the one region which showed a change (either warm or cool) would provide the conclusion of unprecedented global change; i.e.a nonsensical conclusion (reductio ad absurdum).
Clearly, if all regions showed a consistent change then – if the analysis method were correct – there would be little doubt of the putative unprecedented change. But if one region shows no change then confidence in the unprecedented change is reduced. Tisdale observes that 4 of the 7 assessed regions do not show unprecedented recent warming, and some show warmer past temperatures than recent temperatures. In other words, most regions do not support the conclusion reached by the compilation of all regions, and nobody knows what happened in regions that were not assessed.
So, according to this consideration the paper’s conclusion has low confidence.
But that is how we consider the matter and – as I understand it – you consider the matter differently.
As I understand it (please correct me if I am wrong) you are saying the paper’s conclusion should be assessed independently of the indications of individual proxy indications which provide it.
Now, I may have unintentionally ‘put words in your mouth’ by stating what I think you are saying. If so then I apologise. Clearly, I cannot discuss your view unless and until you have explicitly stated your view. However, if your view is as I have said I understand it to be, then we have a fundamental disagreement which merits investigation by debate.
Richard
Downdraft says:
April 23, 2013 at 10:57 am
“The most interesting feature of the charts is the lack of agreement between pollen proxies and treemometers in North America in the period of overlap. Which one is correct, and can either one can be trusted? Unless those questions can be answered and the differences reconciled, I see no reason to trust in either proxy (based on this study).”
I sympathize, Downdraft. This is one of those “palm to forehead” moments. What is the point of publishing conflicting proxy records?
Cutting to the chase and repeating myself, no paleoclimatologist has ever published an article in which they report the results of their efforts to show that one or more of commonly used proxies is not a reliable proxy for temperature. That fact alone establishes beyond the shadow of a doubt that climatologists are not practicing science. Worse, they are not interested in science.
Potatoes were introduced to Europe after 1650 from South America by the Spanish. So, not the Greenland Vikings did not have Potatoes. And there is no evidence they had Grapes in Greenland.
The Vikings in Greenland did have Barley.
Barley requires about 1500 growing degree days (GDD) to mature. GDD are the integral of the average temp minus 10C in C.
http://en.wikipedia.org/wiki/Growing-degree_day
Looking at Nuuk, the capital of Greenland, I see that they rarely get above 10C. Hence the GDD are probably near zero for Nuuk.
http://en.wikipedia.org/wiki/Nuuk
Looking at other towns in Greenland, only Qaqortoq gets up to 11C on average. So it might have a GDD needed.
There are some news reports about potatoes and hay grown in S Greenland. Potatoes have about the same GDD as Barley but are more tolerant of colder temps.
Jim Cripwell says:
April 23, 2013 at 7:29 am
oldfossil writes “But of course they do.”
Sorry, I completely disagree. BEST is not original data. Thermometers in Stevenson screens, or remote sensing satellites meausure temperature. Satellite cameras measure sea ice extent. The warmists have no control of the raw data that is actually measured.
The naivety of this is astonishing. Raw, empirical data is not commonly used in most sciences. There good reasons for it, but the adjustment process complicates any analysis. Surveying parties for example may employ an aneroid barometer to estimate altitudes, but these observations are commonly adjusted to estimate true altitude based on the behaviour of nearby barometers at fixed locations with known elevation(s). If there are multiple visible targets from a point being mapped that can be shot using a transit (dating myself) and which have known physical separations, elevation estimates can be cross checked using a completely different method of estimation. “Measurements” are not “pure” and are inherently subject to specific types of uncertainties that can be partially corrected. A measurement done with ruler has an accuracy is linked to thermal expansion properties of the ruler material, and the material being measured. A chained survey distance is subject to the skill of the surveyor at maintaining a steady, constant tension on the tape to control the sag of the tape within predetermined limits, and again the thermal properties of the tape. Over any significant distance the “true” measurement will be related to the chord of the arc described by the sagging tape. If there are significant rises and falls in the ground the elevation differences between the ends of the tape have to be measured as well. Even in a shop you have to consider type of wood for instance, wood moisture, and time of year. A flat-sawn board will “work” changing dimension with the weather and adapting itself to its environment.
When you start fiddling around with attempting to estimate global temperature based upon local temperature measurements where local conditions can have indeterminate effects (e.g. the ongoing UHI battle), and where the proper adjustments for such effects are debatable at best, good luck.
Caleb says:
April 23, 2013 at 7:52 am
A minor point, but I find it interesting that the North American pollen data doesn’t entirely agree with the tree rings. The most recent data seems to show tree rings see it is warmer than normal, while pollen says, “Ho hum. Normal.”
“Those dirty rings! You try soaking them out. You try scrubbing them out. But still you have…”
(From an incredibly annoying old TV commercial in the United States.)
To complete your sentiment
“Those dirty rings! You try soaking them out. You try scrubbing them out. But still you have…”
Briffa’s gonna holler, Briffa’s gonna holler, BRIFFA’S GONNA HOLLER
Kevin MacDonald says: “This is an extremely blatant straw man. Nobody claims unprecedented regional anomalies for all regions, the actual claim is that it is very likely that the global anomaly is unprecedented in at least the last millennium.”
As I noted in the opening paragraph, I don’t follow the paleo debate. I don’t find the data credible. But with my limited exposure, I have always been left with the impression that the hockey stick occurred regionally as well–which was why the Idsos presented all of those regional “non hockey stick” reconstructions in their Medieval Warming Period Project.
Duster you write “The naivety of this is astonishing.”
Why? So far as I am aware, ALL data starts off as raw data. There is no other way of acquiring any data except by making some form of measurement. All I am saying is that the warmists have no control over this raw data.
Given that the straw man is what informs Tisdale’s conclusions, I’d say it is the subject of the thread.
What you think has no bearing on the truth of the matter; Tisdale’s is a false argument because it fails to address the issue of synchronicity
Now you’re just repeating Tisdale’s straw man fallacy. Even if all regions showed warming comparable to or in excess of current warming in rate and/or magnitude it means nothing in the context of the global anomaly which can still set a precedent by dint of greater synchronicity of the regional trends and anomalies.
No, that’s what you’re doing and then projecting it onto me. You recognise that individual regions show comparable or even greater trends/ and or anomalies at some point in the past, but you fail to examine what was happening, concurrently, in the other regions.
They occur in some regional reconstructions, but not in others.
Wonder how the models will cope with this.
Guess it’s back to the drawing board 🙂
Kevin MacDonald:
I am disappointed and dismayed at your post at April 23, 2013 at 2:17 pm
http://wattsupwiththat.com/2013/04/23/a-quick-comment-about-the-pages-continental-temperature-reconstructions/#comment-1285264
which was in response to my post at April 23, 2013 at 11:34 am
http://wattsupwiththat.com/2013/04/23/a-quick-comment-about-the-pages-continental-temperature-reconstructions/#comment-1285118
In my post I said
I then set out my view before concluding by saying
Your response consists of your repeating your fallacious, pointless and distracting assertion of a straw man. It then refuses to state your view but – instead – says
This does not convince me that your posts were serious scientific criticisms which you are willing to support with evidence and/or argument. Indeed, your post I am replying suggests that I was mistaken when I accepted your earlier posts were intended to be serious criticism because they were merely ‘knocking copy’.
Richard
Kevin MacDonald says in reply to me regarding hockey stick reconstructions: “They occur in some regional reconstructions, but not in others.”
Thanks. And the ones that the mainstream media and alarmist websites promote would be the ones that create the hockey stick. There would be no logical reason for them to promote reconstructions with warmer-than-today Medieval Warming Periods.
Regards
I don’t think it is a straw man, it is a straw man for the reasons stated; by ignoring the asychronicity of the earlier warm events it misrepresents the argument it purports to undermine. You reject this, but the only rationale you offer is a reiteration of the original fallacy.
Another straw man Bob, where the mainstream media reports on paleoclimatic reconstructions at all it tends to be hemispheric and global rather than regional.
You’ve already stated that, through choice, you are not well informed in this topic and that’s fair enough, but it would behoove you to learn more before chucking out scurrilous insinuations.
Kevin MacDonald appears to be completely uninformed. The issue is over global warming, not ‘hemispheric’, or ‘regional’ warming.
Global warming is being disregarded and ignored, because it stopped a decade and a half ago. Warmists lost the argument, as judged by the ultimate Authority: planet earth.
Bob Tisdale:
I’m more familiar with the notion of regional difference as applied to the MWP (and LIA), usually voiced by mainstreamers when ‘skeptics’ posit that the MWP was a global phenomenon. The chart Tsidale point to here indicates that previous periods of warm and cold were regionally distinct, including for the MWP.
But we know from the instrumental record that every region of the globe has been warming for the past 40 years or so, which would appear to be ‘unprecedented’, at least in terms of the proxy data analysed in this comprehensive study.
It should be noted that some of the continental reconstructions come a bit short of AD 2000.
Arctic 1 – 2000
Europe 1 – 2003
Asia 800 – 1989
North America 480 – 1974
South America 857 – 1995
Australasia 1001 – 2001
Antarctica 167–2005
http://www.nature.com/ngeo/journal/vaop/ncurrent/fig_tab/ngeo1797_T1.html
So one should add a bit more warmth to the end of Asia and North America.
Well, we have the Arctic, Europe and Antarctica back to AD167, and North America back to AD480. That’s a lot to compare, and, at least as far as this study shows, there is quite distinct variability between regions at the same time, as well as centennial trends that go in the opposite direction. This suggests we should not expect uniform temperature reconstructions bewteen regions.
Claims of recent temperatures being likely unprecedented are about global average temperatures, not regional. Rebuttals of the claim should get the claim right to begin with.
FTR, I do not consider the question of regionality/homogeneity of the MWP and LIA to have been decisively answered. Comprehensive reconstruction efforts like these get us closer to underdstanding the past, and should be lauded. But we don’t need comments like this in the discussion;
That’s not science, that is politics. It’s a group smear, unprovable, and should be against the comments policy for guest writers.
Kevin MacDonald appears to be completely uninformed. The issue is over global warming, not ‘hemispheric’, or ‘regional’ warming.
db, I don’t think you understood what Kevin wrote. Bob was confused about the connection between regional and global, and Kevin pointed this out. Regional-global confusion is a recurring theme of this thread.
Indeed, and elsewhere, too. For a long time people claimed that temps were hotter in 1934, mistaking the US temp record for global. It takes more effort to clear up inaccuracies than it does to propagate them.
I find it curious that Antarctica looks to have been in a warm trend, at least up to 200-300 years before present.
Anomalies? Curiouser and curiouser; makes one wonder how that particular paleo data was verified and how the whole region suffered such anomalies.
Correct me if I’m wrong, but didn’t the BEST project show that a significant number of regions of the globe have actually got a cooling trend? Not a majority, obviously, but enough to be noticeable. The figure of 30% comes to mind, but I could be misremembering.
@ Bob Tisdale / April 23, 2013 at 7:22 am
Antarctica: maybe we can conclude that slow ‘coolers’ are slow ‘warmers’?
my point was to demonstrate that in this important matter in the discussion and the division you made, you missed the issue of seas and oceans;
the SH is mostly water (and ice); all that water behaves differently, you could have taken that in account;
Kaufmann et all did adress this matter in the chapter “Twentieth-centure reconstructed temperature” of their article;
Fredd and barry:
I am replying to your posts at April 23, 2013 at 7:10 pm and April 23, 2013 at 8:55 pm, respectively.
Clearly, you have completely misunderstood the issue.
This misunderstanding is endorsed by barry in his post which supports the post by Fredd which says
Firstly, at first I thought Kevin MacDonald was “completely uninformed” but his responses to me convince me he was being disingenuous.
The issue of ‘global vs regional’ was specifically addressed in my post to him at April 23, 2013 at 11:34 am
http://wattsupwiththat.com/2013/04/23/a-quick-comment-about-the-pages-continental-temperature-reconstructions/#comment-1285118
The three of you have studiously evaded that issue.
To save others needing to use the link I copy my explanation to here.
Please explain why you think the finding of Kaufman et al (2013) does not have low confidence when most of the regions it assessed disconfirm its global conclusion.
Richard
Kevin MacDonald says: “You’ve already stated that, through choice, you are not well informed in this topic and that’s fair enough, but it would behoove you to learn more before chucking out scurrilous insinuations.”
When I wrote the comment you replied to, the paper that came to mind was Gergis et al 2012, which was a hockey-stick reconstruction of Australian temperatures, not global or hemispheric. It received pre-publication promotion at alarmist websites and by the MSM–and was later withdrawn. (I also believe the Gergis et al data was incorporated into Kaufman et al 2013, so it’s relevant.) It might behoove you, Kevin MacDonald, to consider Gergis et al before making accusations of “scurrilous insinuations”. Additionally, I’m sure I could find other regional hockey-stick reconstructions discussed by the media and alarmists. While I don’t study paleoclimatology, I’m not immune to headlines.
Darrell Kaufman states on RealClimate blog 21st apr that “During the last 30-year period in the reconstructions (1971-2000 CE), the average reconstructed temperature among all of the regions was likely higher than anytime in at least ~1400 years.” Without access to the paper from my current location, I raised a question on the blog after having looked in the supplementary information:
8 Jens Raunsø Jensen says:
22 Apr 2013 at 5:31 AM
Dr Kaufman: According to the Fig S1 in the supplementary information on the Pages website referred to above, the Pages 2K reconstructed temperature consistently overestimate global temperature in more recent decades by say 0.1 C. How has this been taken into account when concluding that “.. the average reconstructed temperature among all of the regions was likely higher than anytime in at least ~1400 years.” ? (sorry, but I can not read the paper from my current location).
As there was no answer to my question, I restated the question today, which after a few hours of moderation disappeared from the blog:
1. Jens Raunsø Jensen says:
Your comment is awaiting moderation.
24 Apr 2013 at 2:29 AM
I posed a question to Dr Kaufman 2 days ago (#8). If Dr Kaufman is out of reach, perhaps one of the many reaearch team members could answer my question. Given the significant overestimation of global temperature in recent decades by the reconstructed temperatures, documented in the supplementary material, it may not be surprising that the reconstructed temperatures during the recent 30 year period may be found to be at the higher end of the reconstructed temperature curve. Do you still consider it a “likely” reality, that temperatures during “1971-2000″ was higher than at any time > 1400, or could this be an artifact associated with a bias in the temperature reconstruction?
Can anybody here comment on the substance of my question, which apparently 78 authors or the staff at RC have no time or inclimation to address?
thanks, jens
Jens Raunsø Jensen:
At April 24, 2013 at 4:36 am you ask
Yes, I do.
You have made a good find.
I respectfully suggest that you rephrase it as a statement then submit it to Nature Geoscience. Ensure your submission and all responses are recorded by e.g. copying it to WUWT. The rephrasing could be similar to this
Sirs:
I write to draw attention to an unexplained matter which seems to require and addendum or corrigendum to the paper
Ahmed M, et al., ‘Continental-scale temperature variability during the past two millennia’, Nature Geoscience, 21 April 2013.
According to the Fig S1 in the supplementary information on the Pages website, the reconstructed temperature consistently overestimate global temperature in more recent decades by about 0.1 C. The paper and supplementary information do not state how has this been taken into account when concluding that “.. the average reconstructed temperature among all of the regions was likely higher than anytime in at least ~1400 years.”
regards
& etc.
And I also suggest that you make your submission soon or somebody may take the credit for your observation and forestall it.
Richard