The press release below is from Wiley, where they worry that the polar bear can’t find enough sea ice. Meanwhile, billboards proclaim the uptick in polar bear numbers thanks to conservation efforts and other factors. See below for 10 reasons to consider why we shouldn’t worry. – Anthony

For polar bears, it’s survival of the fattest
One of the most southerly populations of polar bears in the world – and the best studied – is struggling to cope with climate-induced changes to sea ice, new research reveals. Based on over 10 years’ data the study, published in the British Ecological Society’s Journal of Animal Ecology, sheds new light on how sea ice conditions drive polar bears’ annual migration on and off the ice.

Lead by Dr Seth Cherry of the University of Alberta, the team studied polar bears in western Hudson Bay, where sea ice melts completely each summer and typically re-freezes from late November to early December. “This poses an interesting challenge for a species that has evolved as a highly efficient predator of ice-associated seals,” he explains. “Because although polar bears are excellent swimmers compared with other bear species, they use the sea ice to travel, hunt, mate and rest.”
Polar bears have adapted to the annual loss of sea ice by migrating onto land each summer. While there, they cannot hunt seals and must rely on fat reserves to see them through until the ice returns.
Dr Cherry and colleagues wanted to discover how earlier thawing and later freezing of sea ice affects the bears’ migration. “At first glance, sea ice may look like a barren, uniform environment, but in reality, it’s remarkably complex and polar bears manage to cope, and even thrive, in a habitat that moves beneath their feet and even disappears for part of the year. This is an extraordinary biological feat and biologist still don’t fully understand it,” he says.
From 1991-97 and 2004-09, they monitored movements of 109 female polar bears fitted with satellite tracking collars. They tagged only females because males’ necks are wider than their heads, so they cannot wear a collar. During the same period, the team also monitored the position and concentration of sea ice using satellite images.
“Defining precisely what aspects of sea ice break-up and freeze-up affect polar bear migration, and when these conditions occur, is a vital part of monitoring how potential climate-induced changes to sea ice freeze-thaw cycles may affect the bears,” he says.
The results reveal the timing of polar bears’ migration can be predicted by how fast the sea ice melts and freezes, and by when specific sea ice concentrations occur within a given area of Hudson Bay.
According to Dr Cherry: “The data suggest that in recent years, polar bears are arriving on shore earlier in the summer and leaving later in the autumn. These are precisely the kind of changes one would expect to see as a result of a warming climate and may help explain some other studies that are showing declines in body condition and cub production.”
Recent estimates put the western Hudson Bay polar bear population at around 900 individuals. The population has declined since the 1990s, as has the bears’ body condition and the number of cubs surviving to adulthood.
Because polar bears’ main food source is seals, and these are hunted almost exclusively on sea ice, the longer bears spend on land, the longer they must go without energy-rich seals. “Climate-induced changes that cause sea ice to melt earlier, form later, or both, likely affect the overall health of polar bears in the area. Ultimately, for polar bears, it’s survival of the fattest,” says Dr Cherry.
He hopes the results will enable other scientists and wildlife managers to predict how potential climate-induced changes to sea ice freeze-thaw cycles will affect the ecology, particularly the migration patterns, of this iconic species.
Seth Cherry et al (2013). ‘Migration phenology and seasonal fidelity of an Arctic marine predator in relation to sea ice dynamics’, doi: 10.1111/1365-2656.12050, is published in the Journal of Animal Ecology on Wednesday 20 March 2013.
===============================================================
CFACT writes on their webpage:
The polar bear invasion
While many people believe that polar bears are in danger because of global warming, it might surprise them to learn that polar bear numbers have actually quadrupled in recent decades. Such news is no surprise to residents of Churchill, Manitoba, however, who are experiencing an invasion of polar bears in their town. According to reports, polar bears are commonly seen walking down Churchill’s main street, and people have learned to leave their cars unlocked so they can quickly duck inside if one approaches. It’s gotten so bad, in fact, that dogs are routinely being eaten, a polar bear hotline has been created, and kids cannot go out trick or treating without a parent packing a shotgun for protection.
================================================================
So in a sense, the Wiley article is correct, and polar bears are coming on land, due to Hudson Bay sea ice melt. But, hasn’t this always happened?
")
Jeff Condon did a post on Hudson Bay ice here and notes:

Since we know that this region definitely melts 100% (should hit zero every year) and we can see the same step pattern in the lower edge. This appears to be another indication of a definite bias in the sea ice satellite data. How this is handled by the pro’s is an unexplored matter but this data is the final published version from the NSIDC.
Biologist Susan Crockford gives us ten good reasons not to worry about polar bears:
1) Polar bears are a conservation success story. Their numbers have rebounded remarkably since 1973 and we can say for sure that there are more polar bears now than there were 40 years ago. Although we cannot state the precise amount that populations have increased (which is true for many species – counts are usually undertaken only after a major decline is noticeable), polar bears join a long list of other marine mammals whose populations rebounded spectacularly after unregulated hunting stopped: sea otters, all eight species of fur seals, walrus, both species of elephant seal, and whales of all kinds (including grey, right, bowhead, humpback, sei, fin, blue and sperm whales). Once surveys have been completed for the four subpopulations of polar bears whose numbers are currently listed as zero (how about funding that, WWF?), the total world population will almost certainly rise to well above the current official estimate of 20,000-25,000 (perhaps to 27,000-32,000?).
2) The only polar bear subpopulation that has had a statistically significant decline in recent years is the one in Western Hudson Bay (WH)(Fig. 1). A few others have been presumed to be decreasing, based on suspicions of over-harvesting, assumed repercussions of reduced sea ice and/or statistically insignificant declines in body condition (see 3, below) – not actual population declines.
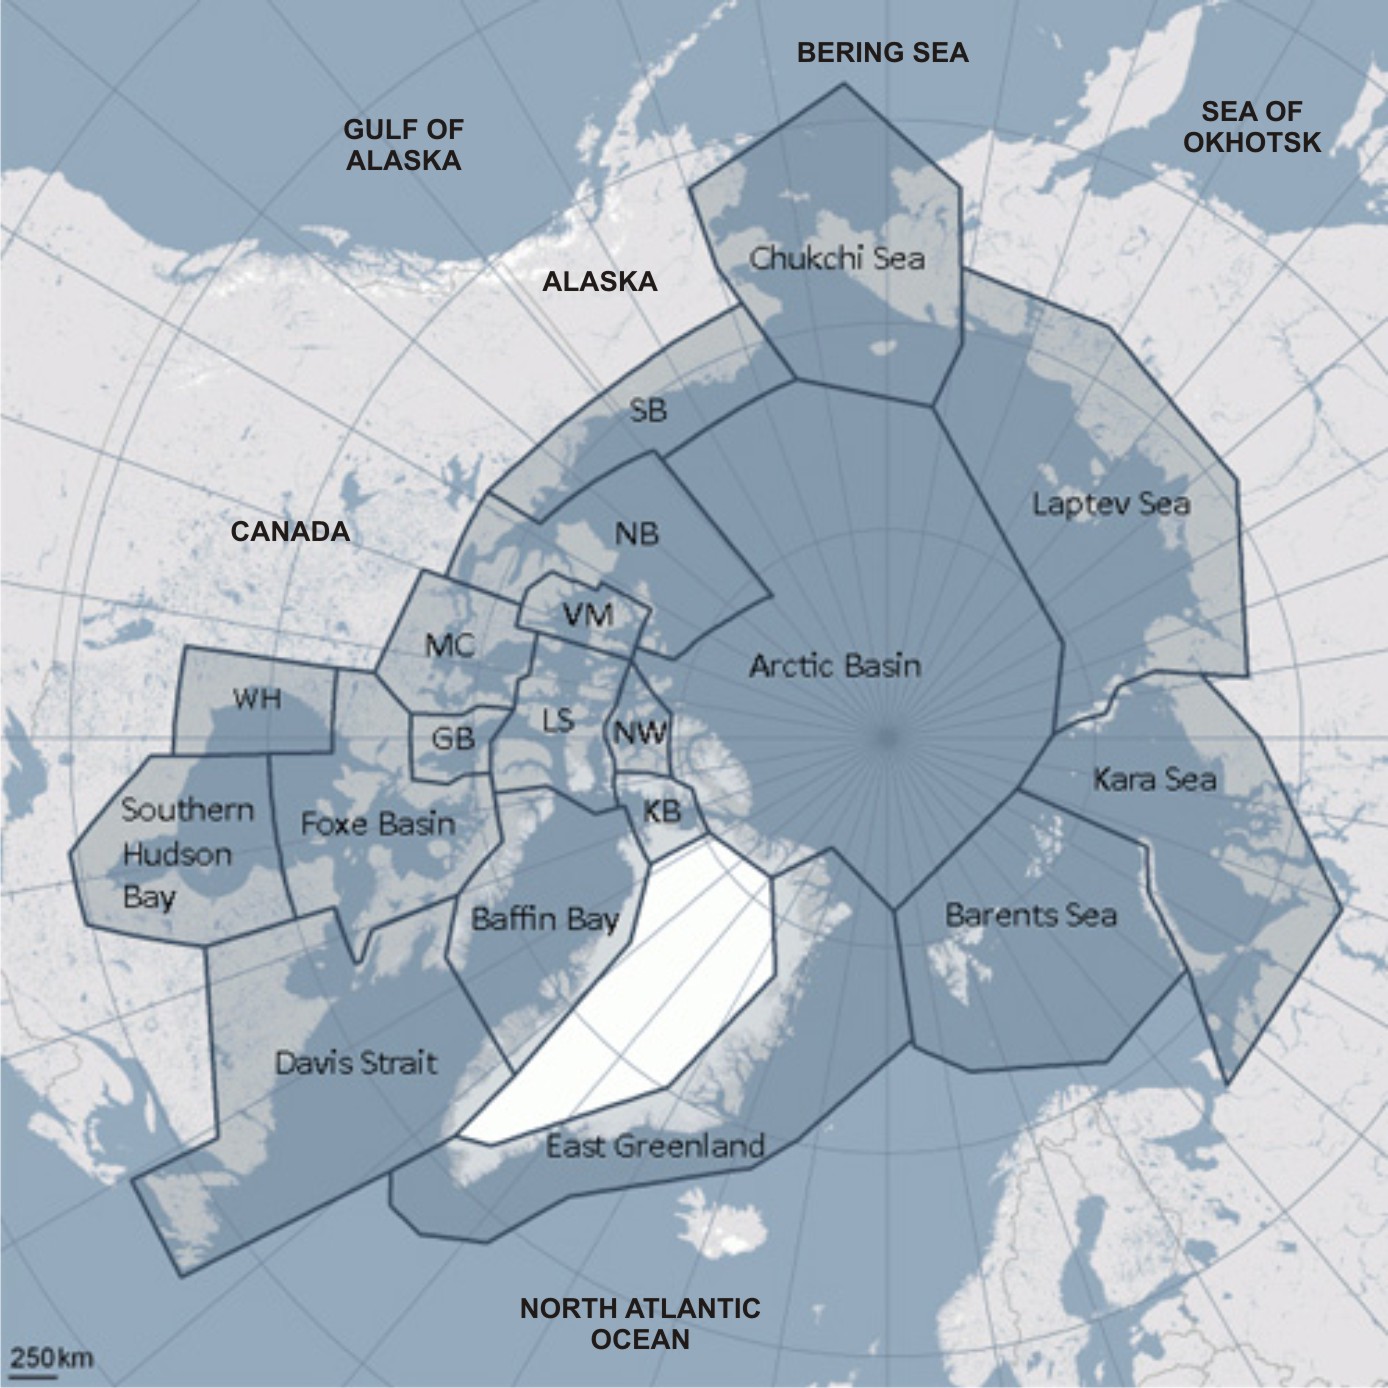
Figure 1. A map of the 19 polar bear subpopulations (courtesy the Polar Bear Specialist Group (PBSG), with a few additional labels).
3) Polar bears in the US portion of the Chukchi Sea are in good condition and reproducing well, while sea ice in the Bering Sea has rebounded from record lows over the last ten years – good reasons not to be worried about polar bears in the Chukchi. The Chukchi subpopulation (which includes bears in the Bering Sea) was formerly assumed to be decreasing due to suspected over-harvesting and past declines in sea ice – even though no population survey had ever been done (see 2, above) – but preliminary reports about a recent survey suggest that Chukchi polar bears are doing very well. While there is still no official population estimate for the Chukchi (currently listed as zero), sea ice coverage in the Bering Sea has been higher than average over the last ten years and 2012 didn’t just break the satellite-era record set in 1999, it exceeded it by almost 100,000 square kilometers.
4) A survey by the Nunavut government in 2011 showed that polar bear numbers in Western Hudson Bay have not declined since 2004 as predicted and all available evidence indicates that Hudson Bay sea ice is not on a steadily precipitous decline – good reasons not to be worried about Hudson Bay bears. While polar bear biologists Ian Stirling and Andrew Derocher continue to insist that the modest decline in numbers of Western Hudson Bay polar bears recorded between 1998 and 2004 was due to earlier breakup of sea ice – and continues on that trend to this day – it turns out that much of the data used to support that claim is either unpublished, woefully out of date, or both. Although Stirling and colleagues have not yet published comparable dates of sea ice breakup since 2007 (they use a particular computation of satellite data), Canadian Ice Service data suggests that over the last 10 years we have not seen another very early breakup in Hudson Bay like the one that occurred in 2003. Surprisingly, 2009 was a late breakup year: the Port of Churchill experienced the latest breakup of sea ice since 1974 (three weeks later than average). All of which suggests that in Western Hudson Bay, some years have been good for polar bears and others have been not so good, but there has not been a relentless decline in sea ice breakup dates over the last thirty years.
5) Population decreases in polar bear numbers attributed to earlier sea ice breakup in Western Hudson Bay (see 4, above) have not been anywhere near as severe as the catastrophic decline that took place in 1974 in the eastern Beaufort Sea, which was associated with exceptionally thick sea ice. The modest decline in the Western Hudson Bay population that took place between 1998 and 2004 (down 22%) pales in comparison to the 1974 Beaufort event, when ringed seals numbers (i.e. polar bear food) dropped by 80% or more and numbers of polar bears plummeted. Similar events took place in 1984 and 1992, which means that three precipitous population declines due to heavy ice have taken place in this polar bear population over the last 40 years – but each time, numbers rebounded a few years later. In other words, due to entirely natural causes, polar bear numbers can fluctuate quite dramatically over relatively short periods because of the highly variable sea ice habitat they live in.
6) Polar bears need spring and early summer ice (March through June) for gorging on young, fat seals and documented declines in sea ice have rarely impinged on that critical feeding period (except for a few isolated years in Hudson Bay, see 4, above). A new study suggests that while some Western Hudson Bay bears will likely perish if the ice-free period extends to six months (from its current four-to-four+), many will survive because of their exceptional fat storage abilities.
7) There is no plausible evidence that regulated subsistence hunting is causing polar bear numbers to decline, despite suspicions harbored by the Polar Bear Specialist Group.
8) Global temperatures have not risen in a statistically-significant way in the last 16 years (see Fig. 2) – a standstill not predicted by climate models and a phenomenon even the chairman of the IPCC has acknowledged – which suggests that the record sea ice lows of the last few years are probably not primarily due to CO2-caused increases in global temperatures. Such changes in Arctic sea ice appear to be normal habitat variations that polar bears have survived before (see 9, below) and are likely due to a combination of natural and man-made processes we do not yet fully understand (including the effects of black carbon).[see footnote below]

Figure 2. LEFT – There has not been any statistically significant increase in global temperatures over the last 16 years (1997-2013), even though CO2 levels have continued to rise (Graph modified from David Evans, using Hadley UK Met Office data (HadCrut4). RIGHT – Sea ice extent in September (the yearly minimum) has declined quite a bit since 1997 – although nowhere near zero – while global temperatures have barely changed overall (Graph from NSIDC) Click to enlarge.
9) Survival of polar bears over a hundred thousand years (at least) of highly variable sea ice coverage indicates that those biologists who portend a doomed future for the polar bear have grossly underestimated its ability to survive vastly different conditions than those that existed in the late 1970s when Ian Stirling began his polar bear research. Sea ice has varied – countless dozens of times – over the short term (decades-long climate oscillations) and the long term (glacial-to-interglacial cycles of thousands of years). Over the last 100,000 years, there have been periods of much less ice than today, but also much, much more. Polar bear population numbers probably fluctuated up and down in conjunction with some of these sea ice changes but the polar bear as a species survived – and so did all of the Arctic seal species it depends on for food. Such survival indicates that these Arctic species, in an evolutionary sense, are very well-adapted to their highly-variable habitat.
10) Polar bears today are well distributed throughout their available territory, which is a recognized characteristic of a healthy species.
These are all good reasons to feel good about the current status of the polar bear. It is plain to see that these ice-dwelling bears are not currently threatened with extinction due to declining sea ice, despite the hue and cry from activist scientists and environmental organizations. Indeed, because the polar bear is doing so well, those who would like to see polar bears listed as “threatened” depend entirely upon dramatic declines in sea ice prophesied to occur decades from now to make their case.
Footnote: Updated Feb. 28, 2013. I have amended the last sentence of #8 to reflect the possibility that man-made influences (such as soot) may have contributed to recent sea ice declines.
The Glorification of the Artificial Future by the Agenda 21 program is the key to their scam. If we can teach everyone how the scam works, we can all use the scam to scam each other and everyone can make money on it.
So this is kind of like the Goldilocks story. The ice can’t be to thin and the ice can’t be to thick it can only be just right for polar bears to survive. And in the end just like humans, it is the fattest ones that will survive.
“The population has declined since the 1990s,”
Really? 1995 estimated at 1200, next data “2009 but based on data from 2004” is 935.
Based on 2004 data? So most recent data is ten years old?
Very interesting . . . . but, I always wonder why we accept the (misleading at least to me) optical anomoly when it comes to looking at this part of our maps (globe) . . . .
http://www.geofx.com/images/globe_arctic.jpg
for an example comparison . . .
Cherry, et al, cite Regehr, et al, 2007, to the effect that the WHB population fell from ~1194 to 935 between 1987 & 2004. To quote Zac Unger (WSJ & elsewhere), “After that 2004 count, scientists predicted that the population would crater to 676 bears by 2011. But a recent survey found more than 1000 bears there, leading some government scientists to enthusiastically endorse increased hunting quotas.”
Recent studies have found that polar bears, while still rapidly evolving, are a much more ancient species than previously thought. Evidence suggests that they did suffer a stark decline around 500,000 years ago, during the strange interglacial of MIS 13.
That interglacial appears on average cooler than succeeding ones, including the two most recent, the Eemian & present, but it seems to have suffered a split personality, with a warm NH & cool SH, according to a recent paper funded by the Chinese government (I know, I know…right up there with the Bros. Koch, Heartland Institute, Big Oil & all the other villains who sustain Anthony & Kenji’s lavish, rich, famous, jet-setting, high carbon-footprint lifestyle). Worth reading for its heretical conclusions re. CO2:
http://www.clim-past.net/4/29/2008/cp-4-29-2008.html
So maybe a hot northern climate did harm polar bears, but so far the Modern Warm Period hasn’t significantly done so.
Can I stick this here for fun
Borrowed this from Big Ape of a CBC blog
Al Gore press conference this morning:
Good morning ladies and gentlemen
As you all know, I have made my vast personal fortune selling people on the idea that global climate change is a very real danger, threatening all life on this planet. I have been able to sell my driv…..I mean my views to people throughout this great land and beyond. I have become so rich that I can keep all the lights on in my mansion 24/7.
The last ice age and the years of the dust bowl 30’s was not climate change..just minor weather anomalies. However, a Texas snowstorm, caused by a Canadian cold front forced further south than usual by the jet stream, is clear evidence of man’s dastardly deeds. Let’s not forget that. The fact that it has snowed on rare occasions in Texas since the time of Moses is irrelevant. We are talking now.
Last year’s warm spring followed by an extremely dry and hot summer brought me untold riches as I told my story over and over again to the willing of mind. However, this latest news of a cold and rather normal spring is indeed disturbing and, I have come to the conclusion that…..I have no idea what I’m talking about.
Thank you for listening and now I must go home. I left the lights on in the kitchen, den, bathroom,…….
(rant alert!)
Holy Moses. All things being equal, I’m vaguely glad the polar bears are doing OK. That’s really very nice that their numbers aren’t in danger. But if saying this makes me an evil, inferior sort of person, so be it. On the scale of the problems surrounding the AGW and fossil fuel issues, I don’t care about the darn polar bears. At ALL. They don’t register. We’re talking about the difference between prosperity and life and misery and death for generations in developing nations. Trillions of dollars difference in developed nations. Species have gone extinct before, life goes on for the rest.
If there are people out there who really believe polar bears are in danger due to AGW and who really care, they ought to focus on coming up with a solution that doesn’t involve sending humanity back to the dark ages. I’m sure resourceful and determined people could come up with an effective answer that’d be a lot more effective, cheap and workable than that.
(end of rant)
Why do you think now that the authors of this paper Seth Cherry et al chose the Western Hudson Bay polar bear population to do their study. It is well known that out of all the searate populations of polar bears that this is the ONLY population that MAY be declining.
It wouldn’t be anything to do with going after the quick media headlines hoping that no one notices that the number of polar bears have risen from 5,000 – 10,000 bears in the 1960’s to anything up to 25,000 – 32,000 today.
If you want accurate reporting on polar bears Susan Crockfords blog at Polar Bear Science is excellent. No spin just facts. If you prefer spin with little facts anything written by Andrew Derocher should do the trick.
I can’t resist. The researcher[?]’s name is Cherry as in cherry picking??
City streets are a high risk area for bears. They avoid such areas unless pressed. This indicates the food availability is in decline or there is an overpopulation outside the high risk area. Does anyone know what Churchill was like 30 or 40 years ago in this regard?
I would like one of the above billboards to be put up outside the San Diego zoo. On a recent visit, the spiel they gave at the polar bear exhibit was so wrong and so sickening I just had to walk away. Later I had to tell the relatives we were visiting what’s really happening with the polar bear population. They seemed stunned, and actually a little disappointed !
The sea ice has not totally disappeared recently. How many bears live year-round on the ice? How many researchers are out there looking where it is not convenient to look?
they use the sea ice to travel, hunt, mate and rest.”
====
and they use land to not travel, hunt, mate and rest?
Must be hell only being able to do those things in the dead of winter……….
A study of penguins in Antarctica a years ago discovered a dramtic reduction in chick production, which was of course reported as being due to global warming.
This was later discovered to only apply to penguins wearing GPS collars. Others were doing fine.
I wonder if these “researchers” considered the possible effects of collars on the polar bears?
Reblogged this on Johnsono ne'Blog'as.
Hmmmm. Reminds me of the record Salmon runs in the last few years when the environmentalists are trying to get everything that lives in the rivers listed as endangered due to human activities. Specifically dredging and other forms of recreational mining…
Yes, finally they got it right.
That’s the right billboard.
Thanks
cn
@ Mark Bofill:
They did . . . . that’s why you can’t “legally” eat them anymore.
Reblogged this on Truth, Lies and In Between and commented:
Great ad! Global warming scam exposed.
I’ve not managed to read the post in full yet but have been reading some info & looking at polar bear population density recently. IIRC then there was only one population amongst the world’s bear groups that has been in decline, and this was somewhere around the Hudson bay I believe. That is considered to be a condition problem in the animals and not yet understood. All other population groups across the Northern Hemisphere are increasing in numbers.
I’m always amused that people think polar bears will be unable to survive without sea ice. Of course they will survive, they will just adapt as they have before. Obviously the alarmists and ecologists forget that the polar bear is just a grizzly bear who gained a taste for sushi up North. Perhaps they think the process irreversible. It may be if people keep killing them as they move south ( in this hypothetical scenario) but if not they will simply breed into the brown bear populations they come from.
Mark Bofill says:
March 20, 2013 at 11:48 am
***********************************
Mark, I appreciate the sentiment, but with all respect, you have missed the boat on this one.
Beyond any CAGW worries, there is an ecological concern. In simple terms, when you remove the apex predator from an area, everything else goes to hell. I encourage you to do some reading on the re-introduction of wolves to Yellowstone; it is a great case study.
A healthy and growing polar bear population can only be supported by a healthy ecosystem that supports it.
Therefore, our improved stewardship of the arctic (through reduced hunting, etc.) is not just good for the polar bears, but by proxy the whole of the area and all its denizens. That polar bears are flourishing is excellent evidence that anthropogenic activities are not damaging the environment in the way they are purported to do so, and may be used as a hallmark argument against further policies, so we can get back to focusing on the “prosperity and life and misery and death for generations in developing nations”, and the “trillions of dollars” churned through green schemes.
Matt Ridley had a commentary about this a few days ago.
We Should Be Listening To Susan Crockford
http://opinion.financialpost.com/2013/03/13/we-should-be-listening-to-susan-crockford/
Does anyone know what Churchill was like 30 or 40 years ago in this [polar bear sightings]regard?
I can’t go back 40 years, but when my company had a construction project up there in the early 90s polar bears were seen frequently, and were quite a hazard. I recall documentaries from the time that indicated that polar bears were a long-standing problem, since Churchill is on their normal migration route.
I’m getting confused, so is this good news for my friends the seals or not?
Recent research indicates that polar bears do best on first year ice as that is where the seals are. The make their blow holes and bring their young out on thin first year ice. Multi-year ice is a problem as it it too thick. Since we have lots of first year ice, the research (and seal counts) indicates that this is good for seals and polar bears. Comments above make the same observation. Polar Bears still eat in the summer on land, just not fat rich seals. Like all bears, they are omnivores and will eat anything – plants, roots, bearberries, carrion, eggs, animals, seaweed and anything else that is edible.
Laurie Bowen says:
March 20, 2013 at 12:31 pm
@ Mark Bofill:
They did . . . . that’s why you can’t “legally” eat them anymore.
———–
Right, but then why do they come up in the context of AGW all the time, that’s my point. Why isn’t it Michelle Obama’s purview instead, to explain to all the obese little American kids why polar bears aren’t a healthy choice for a snack? ‘Lets Move! A—Way! from — EaTiNgPoLaRbEaRs!!!’
Beats me Mark . . . Not MY marketing campaign! Maybe it has something to do with “Teddy” Bears or “Smokey” the Bear, or Yogi Bear and his sidekick “Boo Boo”!
Pathway says (11.10 am)
” And in the end like humans only the fattest ones survive”,
Now that is really really depressing, no more Heidi Klumms 🙁
Big D in TX says:
March 20, 2013 at 12:42 pm
Mark Bofill says:
March 20, 2013 at 11:48 am
——
Thanks Big D. Respectfully, seriously, I understand the benefits of conservationism. My point remains that a discussion of polar bears and their beneficial impact on their ecosystem is several orders of magnitude less important than the other issues involved in AGW policy, and that therefore concerns about the impact of the burning of fossil fuels on polar bear populations is bizarrely out of place.
I point this out because when people seriously discuss the well-being of polar bears in this context, they implicitly accept the idea of elevating the importance of this, and it’s a mistake.
Since seals are air breathers, where do they go to rest when there is no sea ice?
‘According to reports, polar bears are commonly seen walking down Churchill’s main street, and people have learned to leave their cars unlocked so they can quickly duck inside if one approaches. It’s gotten so bad, in fact, that dogs are routinely being eaten, a polar bear hotline has been created, and kids cannot go out trick or treating without a parent packing a shotgun for protection.’
That’s funny. Try ‘According to complete and utter bullshit…’
1) Polar bears are a conservation success story.
Duh.
When you stop shooting them, they do pretty well.
Kels, what about the statement is “…complete and utter bullshit”? I’m not challenging you so much as asking for info — do bears not walk down the center of Churchill or is that unlocked cars are no solution to suddenly coming face to face with a polar bear?
Sure. Absolutely. The bear, which has just completed a day of seeking pick-a-nick baskets, is now “waiting” for the sea ice to re-form. Yep. That’s what she’s doing.
This is such a common ploy for “activists” that by now I expect people to have caught on. Except, of course, for the younger ones that haven’t yet learned to be sufficiently cynical. That bear could be doing virtually anything, but the caption is designed to evoke an emotional response. Just like the lonely bear floating around on a chunk of ice, or poor victim swimming bear.
Anyone familiar with Internet Memes recognizes Grumpy Cat and Sad Keanu, and now it’s “Sad Overheated Polar Bear”.
Anthropomorphizing wild animal activities is about as dishonest as it gets when pleading for a cause.
Does anyone know what Churchill was like 30 or 40 years ago in this [polar bear sightings]regard?
There were not a lot of bears seen around Churchill until the 1960s. Going back to the 1930s/40s, there does not seem to have been much thought of bears, kids played in the rocks, etc. Bears were first attracted by the garbage dumps associated with the military base, Fort Churchill, then when that shut down, bears started coming closer to town, etc. In the early 1970s, people used to go and picnic across from the dump to watch bears. It seems that the late 1960s and early 70s were likely the peak for numbers of bears around town… really hard to say.
Basically, a lot of the ‘encounters’ are influenced not just by sea ice but also by who is baiting and where, the garbage situation (since the dump finally closed in 2004) encounters have declined and the approach by Polar Bear Alert officers (currently, they are quite aggressive).
Kels!
Are the stories about “polar bear welcome mats” true?
Enquiring minds want to know…
The results reveal the timing of polar bears’ migration can be predicted by how fast the sea ice melts and freezes, and by when specific sea ice concentrations occur within a given area of Hudson Bay.
Imagine that! Polar Bears are smart enough to learn from the condition of the ice.
And in Germany the birds are smart enough to head back south since winter won’t quit.
http://www.thelocal.de/national/20130315-48551.html#.UUogCzcvkYU
The elephant in the room is garbage addiction. We are developing bears into monsters. Nothing good can come of this. This is a problem throughout North America affecting both Black and Brown/Polar bear sub species.
Imagine how this would be playing out….if, instead of warm fuzzy polar bears……it was brutal bloodthirsty baby seal killers
http://hungertruth.com/images/baby_seal_b3c2.jpg
I always figured less I would benefit the Polar bears. Seeing that they prey on seals that have to go to a solid surface as some time, wouldn’t that make the concentration of available food go up? The baby seals that they gorge upon do not spend the early part of their life at sea. The seals also aren’t going to wait a couple extra months to have the babies. So they will find ice/land or anywhere they can to have these babies which means food for the bears. How is this most basic concept continuously ignored?
It sure sounds like the decline in sea ice is good news for the seals, as they can more easily avoid polar bears. Personally, I find seals to be cuter than polar bears, so I think this is actually a climate change success story. Why is nobody else concerned about the poor seals?
James at 48 says:
March 20, 2013 at 2:15 pm
The elephant in the room is garbage addiction. We are developing bears into monsters. Nothing good can come of this. This is a problem throughout North America affecting both Black and Brown/Polar bear sub species.
Bears are already monsters aka omnivores. Doesn’t include the evolutionary dead-end that is the bamboo eating Panda.
http://www.theglobeandmail.com/commentary/how-to-save-the-polar-bears-leave-them-alone/article8980035/
This recent study, Chambellant, et al., finds that the main prey species of polar bears, ringed seals, increased in Hudson Bay during the 2000s vs. the 1990s. Female polar bears eat ringed seal pups in their snow lairs on land-fast ice or floes, while males catch adults at their breathing holes:
http://www.bioone.org/doi/abs/10.1644/10-MAMM-A-253.1
Abstract
We related temporal variation in the environment to demographic parameters and body condition of ringed seals (Phoca hispida) in Hudson Bay, near the southern limit of the species’ geographic range. Ringed seals harvested by Inuit hunters for subsistence purposes in Arviat, Nunavut, Canada, from 1991 to 2006 were measured and sampled. Ringed seal ovulation rate did not change over time, but pregnancy rate and percent pups in the fall harvest increased in the 2000s, compared to the 1990s. Ringed seals grew faster and attained sexual maturity earlier in life, and the population age structure shifted to younger age classes in the 2000s compared to the 1990s. Ringed seal demographic parameters were characteristic of a population in decline in the 1990s and a growing population in the 2000s. A quadratic polynomial regression best described the relationship between percent pups in the harvest and snow depth, and between pup and adult female body condition index and date of spring breakup, suggesting that ringed seals have evolved to do best within a relatively limited range of environmental conditions. We propose that the decline of ringed seal reproductive parameters and pup survival in the 1990s could have been triggered by unusually cold winters and heavy ice conditions that prevailed in Hudson Bay in the early 1990s, through nutritional stress and increased predation pressure. The recovery in the 2000s may have been augmented by immigration of pups, juveniles, and young adult ringed seals into the study area. We discuss the possibility of a decadal-scale biological cycle that reflects fluctuations in climatic variables, and particularly in the sea ice regime.
(Apologies if this comment has already been posted. I have limited Net connectivity.)
Oh really?
Polar bears are just a thing fo the past.
But Polar bears will drown. Oh the humanity.
But what about the drowning polar bear cubs?
I hope I have conclusively shown that polar bears are just a thing of the past. 😉
I have to laugh, here in Ontario the lakes froze a little earlier and there still is well over a foot left in the local lakes, well south of the Hudson bay so this so called research is shit!
“we” need to stress that THICK sea ice kills polar bears (re. 1974) and with thin sea ice polar bears thrive
The Eemian wiped out the polly bears. We must act now!!!
Actual what they really saying is the most successful hunters, and that is why there fat , are the most likley to survive, just has with any other type of predator. But becasue these ‘cute ‘ bears have become icons to ‘the cause ‘ the normal rules of reality have to be forgotten.
It is to be hoped that polar bears can survive on land in the absence of summer ice flows, but this does not mean that the models showing disappearing arctic ice and the data confirming it are incorrect.
http://haveland.com/share/arctic-death-spiral-1979-201302.png
Life in the Arctic
The Western Hudson Bay polar bear population is a direct result of Churchill garbage. It is completely unnatural. The bear pops are as large as they are because of the free meal. Once the dump was closed, the bears started to leave. That is why the pops are going down. Dr. Cherry is either incompetent or a liar, or most probably both.
clipe says:
March 20, 2013 at 2:38 pm
James at 48 says:
March 20, 2013 at 2:15 pm
The elephant in the room is garbage addiction. We are developing bears into monsters. Nothing good can come of this. This is a problem throughout North America affecting both Black and Brown/Polar bear sub species.
Bears are already monsters aka omnivores. Doesn’t include the evolutionary dead-end that is the bamboo eating Panda.
###
The best classification for bears is Hyper-generalist, like us.
DesertYote, I actually thought you had left out a letter “o” in one of your words until I re-read it… since a previous comment was about examining “scats”
Let’s see. Desertification debunked. Carbon dioxide causing global warming debunked. Rising temperature because of rising CO2 debunked. Ocean warming [by the incomparable Willis] DEBUNKED. A new batch of Climategate E-mails available. The fable of the melting Himalaya glaciers debunked. Phil Jones admitting that the earth hasn’t warmed for 17 years. Climate Progress being reduced to a fringe web site. Most of all, WUWT ascendent.
And a news flash. Unfortunately I can give no verification but it is true: UVA having second thoughts about giving tenure to one Michael Mann. Start digging Anthony. This is the biggest tip you will ever get.
You would think the warmists would began to get the message.
Here are a few other billboard ideas for CFACT:
1. A line chart of US CO2 emissions vs. China & India, including projections.
Caption: “Our ‘Doing Something’ won’t accomplish anything.”
2. A line chart of US CO2 emissions vs. the EU, including projections, along with a second chart comparing costs of electricity.
Caption: “Enviro-nuts want Europe’s green path to be our future.”
3. Multiple photos of stalled or decommissioned or collapsed wind turbines along with bar-charted statistics on their projected life-spans, costs, and energy production vs. the actuals.
Caption: “Where ‘good intentions’ wind up.”
4. Photos of bankrupt / shuttered green energy factories, with names as small captions.
Caption: “‘Green jobs’ have gone with the wind.”
5. Chart of fuel poverty deaths in the UK.
Caption: “Here’s a hockey stick to worry about.”
(Perhaps with a picture of a coal train with the caption, “Life-train.”)
6. Chart of US hurricane deaths since 1913, perhaps grouped into five-year buckets in a bar chart.
7. Ditto for tornado deaths; and flood deaths.
Captions: “We had ‘weird weather’ THEN too.”
8. Photo of Kilimanjaro at its barest point vs. a photo of it today.
Caption: Dates under each photo, then, “Something you won’t learn from the media.”
9. Photo-pairs of low-lying islands decades ago vs. today, showing no sea level rise.
Caption: Dates under each photo, then, “Something you won’t learn from the media.”
10. Quote from Obama on how Spain should be the model we should emulate, vs. statistics on the country’s disastrous outcome of those policies, and its termination of subsidies.
11. Global sea ice trends. Caption: “Something you won’t learn from the media.”
12. Chart showing the temperature range in Antarctica, minus the Peninsula.
Caption, “Antarctica’s summer is still *** degrees below freezing. It’s nowhere near a tipping point.”
These are just first-draft ideas that I typed as fast as I thought of them, almost. They could be improved, and a dozen more could be imagined. (Just grease my palm, Big Oil.)
An overall caption or logo for the series could be, “Deny THIS!” And/or “Something you won’t learn from the media.”
This is where the Denial Machine would be putting its money if it had any sense. (See my http://wattsupwiththat.com/2012/12/16/notes-from-skull-island-why-skeptics-arent-well-funded-and-well-organized/.) It would get lots of bang for its buck.
“Based on over 10 years’ data”… I stopped there.
Your link to Dr David Whitehouse on global temperatures states:
“Hadcrut 4
Statistically there has been no change in the average annual temperature of the globe since 1997 meaning that the standstill is now 16 years. The latest five-year average of Hadcrut3 and Hadcrut4 data shows a decline for the first time.
Can anyone now have any doubt that the recent warming standstill is a real event of crucial climatic importance?”
This is complete rubbish and a failure to understand the limits of Fisherian statistical significance.
Even accepting the claim that there has been no statistically significant warming at face value, by exactly the same criteria, you cannot possibly claim that there has been a statistically significant standstill.
But the fact is that Hadcrut4 data shows that the temperature rise for the last 17 years is almost identical to the rise for the last 4 x 17 years. The reason that the latter is “statistically significant” and the former not is simply a consequence of the reduction in signal to noise ratio by the choice of too short a time period.
http://tinyurl.com/d4jxlth
No evidence of a standstill there, statistically significant or otherwise.
Only one of the consecutive 17 year periods from 1945 on its own shows “statistically significant” warming, and that by 0.003 degree/decade, but the data set taken as a whole is statistically significant.
http://tinyurl.com/bzpzzcl
Deliberately choosing short time periods which increase the noise level relative to the signal is an a cardinal error in statistics and those who are doing so either fail to understand statistics or are being deliberately dishonest. They are setting the data up to fail the test.
Laurie Bowen says (March 20, 2013 at 1:14 pm): ‘Beats me Mark . . . Not MY marketing campaign! Maybe it has something to do with “Teddy” Bears or “Smokey” the Bear, or Yogi Bear and his sidekick “Boo Boo”!’
It may have started here:
http://www.coca-colacompany.com/stories/coke-lore-polar-bears
My wife is as cynical as they come, but the first time she saw a Coke-drinking polar bear ad, she was enchanted. 🙂
Gary Hladik says:
March 20, 2013 at 6:50 pm
Yup – the original commercials of polar bears drinking coke were pretty good. But the latest ones have made me swear off COKE. I no longer buy any Coke products as they are affiliated with the WWF. Anyone who buys Coke is supporting a bunch of (insert appropriate epithets).
Too bad this billboard couldn’t go beside every Coke polar bear WWF promotional billboard. With this thread’s link at the bottom. GK
Don’t look back, Coke, SodaStream is gaining on you.
Phillip Shehan. Did you really write the above or was it your evil doppleganger?
stan stendara, I take that comment to mean you have no counterargument to put.
“Ben Darren Hillicoss says:
March 20, 2013 at 4:07 pm
“we” need to stress that THICK sea ice kills polar bears (re. 1974) and with thin sea ice polar bears thrive”
I watched an Attenborough? documentary showing a starving polar bear searching for many days over miles and miles of solid ice trying to find an air hole and hope a seal popped out. I believe the bear would have liked a little less ice! Oh the irony.
Philip Shehan to short a time period ? when one years is more than enough proof of climate doom and when the ‘required ‘ time scale is endless flexible depending on whatever what ever helps ‘the cause ‘ add to that the reality that 30 years actual having no particularity mathematical nor statistical significance, AGW proponents are in no position to moan about ‘short time periods ‘ until they live up to their own standards .
knr.
No.
Here are the the statistics for the plots I presented:
17yr periods since 1945 Had4
96-2013 0.091 ±0.120 °C/decade (2σ)
79 -96 0.119 ±0.116 °C/decade (2σ)
62 –79 -0.025 ±0.125 °C/decade (2σ)
45- 62 0.013 ±0.137 °C/decade (2σ)
45-2013 0.094 ±0.019 °C/decade (2σ)
knr.
Perhaps I should explain further.
The Fisherian test for stistical significance is that there is a 95% chance that the true trend lies between the 2, where 2σ is one standard deviation from the mean. This is a very tough test and not the only way of measuring confidence in a result.
Those who claim that there is no statistically significant warming for the last 17 years base this on the fact that some of that 2σ range is below zero.
96-2013 0.091 ±0.120 °C/decade (2σ)
That is there is a 95% probability that the true trend may be warming by as much as 0.211 or cooling of -.029 °C/decade. Note that 88% of this range is a warming trend.
But the first rule of statistics is that you must have a large enough sample to give meaningful results. You can always get a statistically insignificant result by choosing a data set that is too short.
Those who quote short term data sets which cannot distinguish between warming and cooling trends are showing whey there data should be ignored.
Choosing short term periods is setting the data up to fail that test.
With longer time periods the signal to noise improves. In terms of determining a warming or cooling trend, Hadcrut4 data becomes statistically significant for 1994 and earlier. The longer the time period the narrower the range of uncertainty. Thus a thirty year period certainly does have mathematical and statistical significance.
1995: 0.098 ± 0.111
1994 0.116 ± 0.102
1990: 0.144 ± 0.080
1980: 0.158 ± 0.045
1970: 0.164 ± 0.031
1960: 0.132 ± 0.025
And so on the further back you go.
Sorry for the typo.
That should read: The Fisherian test for statistical significance is that there is a 95% chance that the true trend lies between 2σ, where σ is one standard deviation from the mean.
If you and your friend are being chased by a polar bear, you don’t have to out-run the bear. You just have to out-run your friend.
Seriously, the wide-spread belief that polar bears are in danger of going extinct is possibly one of the most successful propaganda campaigns in history – apart from CAGW itself, of course.
But in these discussions, one thing always seems to be missing: actual graphs of polar bear populations. I’m sure many measurements are being taken. Could it be that the actual data, and therefore graphs showing the data, are just too inconvenient? Could it be that the graphs would actually be hockey sticks?
There’s another terrible suspicion: could it be that graphs of polar bear populations have already gone extinct?
Chris
So, I glean from comments here that The fattest polar bears survive..and I read that also the fattest humans survive.
But if you co-mingle the two species, only the FASTEST humans survive.
To PBs, we are “land seals”
The BBC is getting grief from Norwegians for harassing polar bears:
http://www.bbc.co.uk/news/entertainment-arts-21847507?utm_source=feedburner&utm_medium=feed&utm_campaign=Feed%3A+bbc_news+%28BBC+News+-+Home%29
Well, Susan Crockford, kudos for courage and factual analysis. Rare commodities these days.
Polar bear vandalism:
http://seaice.alaska.edu/gi/observatories/barrow_sealevel
“The Mass Balance site was damaged by a polar bear earlier this season and field repair attempts were unsuccessful. The data are being collected and the complete dataset will be available at the end of the ice season. Thank you for your patience.”
How much can a polar bear bear? A lot, actually.
Phillip Shehan: Figures lie and liars figure.
I apologize for baiting a troll, Anthony.
Crockford responds to Cherry, et al. today:
http://polarbearscience.com/2013/03/21/polar-bears-of-w-hudson-bay-came-ashore-in-2009-as-late-as-in-1992/
The link title itself says a lot, but please read her excellent post, which also comments on hoarding of ice data.
stan stendera, instead of apologizing to Mr Watts for “baiting a troll”, you should do him a big favor and lift the quality of his blog by vacating it permanently.
You are one of those arrogant ideologues who claim to be a “skeptic” who thinks that anyone who has the temerity to disagree with you is a “troll”.
I understand this to be a public forum for the discussion of science. I believe Mr Watts regards it as such. It is not a forum for those who agree totally with your point of view to engage in group hugs and rounds of mutual congratulation on your stunning insights and telling each other how right you are.
If you are incapable of putting a counterargument to mine, best to say nothing at all.
stan stendera,
I have to laugh at Philip Shehan, the most blinkered of true believers. His consternation comes from the plain fact that the planet is debunking his belief system.
Any honest scientist would look at current facts and conclude that the catastrophic AGW conjecture has been falsified. Note that I said “honest”.
Mr Stealey
So your graph shows the temperature moving from the red zone into the pink zone of probability for a few years and that is the planet debunking my “belief system”?
Did you notice the other periods on your graph when that happened in the short term and returned to trend?
My “consternation” is caused by people peddling nonsense that polar bears learning to survive on land invalidates the fact of a melting arctic or that there has been a pause in temperature rise for the last 17 years.
http://haveland.com/share/arctic-death-spiral-1979-201302.png
http://tinyurl.com/d4jxlth
How about tackling those points I made or are you just another troll who cannot make an argument without resorting to abuse?
Shehan,
I wasn’t talking to you, I was conversing with stan.
But since you’ve butted in, listen up: the Arctic has routinely melted in the past. Many times. Naturally. It is happening again, and there is no measurable evidence that human activity has anything to do with it.
And Polar bears are a nonsensical diversion; a last resort of climate alarmists, who have nothing substantive to discuss. Polar bears! Could you be any less credible? Polar bears are an Algore scare tactic — but anyone aware of reality knows that the Polar bear population is steadily rising. Polar bears are simply another debunked scare tactic. But Polar bears are all you’ve got, so that’s the scare tactic you promote. But we know better here.
The fact is that there is nothing either unusual or unprecedented happening with the planet. Nothing. Your wild-eyed conspiracy theories amount to climate creationism, not science.
I will apologize if you can provide any verifiable measurements proving that CO2 causes specific, measurable temperature change. Post your empirical, testable, falsifiable evidence right here. Show us the global T change from each ppm of CO2.
But if you don’t have measurable evidence, then all the labels apply. You are just emitting alarmist propaganda because that is your personal, unscientific belief system — but it is not the Real World, which is busy debunking your bogus alarmist nonsense.
I haven’t read the previous comments so this may have already been addressed. Time is short at the moment.
Has the population of Polar Bears exceeded the carrying capacity of their food source? At an expansion of population by a factor of four maybe there are too many bears. I’ve seen photos of seals on land in years past. Was there a shortage of ice many many years ago? Do seals never come ashore if there is a lessor ice coverage? Where do they go (the seals)? Why can’t the bears follow them? Are the seals and the bears separated by fencing? I have personally been involved in a bear hunt where the bear was tracked over 25 miles in the snow from the time the track was cut to where it bedded with no pressure applied, just walking. It was a black bear in the eastern U.S. I have read that a polar bear was documented to have swam over 100 miles ( I believe that it may have been over 100 miles from shore). My bird dog has logged over 5 miles non-stop, maybe more. I stopped the swim due to the takeout being passed. Typically on a 10 mile float the dogs don’t stay in the canoe much. For an animal (dog) swimming is easier than walking. The long fur is natural flotation.
Mr Stealy, So why did you but in on my conversation with stan?
There is no point in presenting evidence concerning the role of CO2 in warming the planet as you simply refuse to recognise it as evidence. You demand “proof” which is a mathematical, not scientific concept. Scientific theories are always open to revision in the light of new evidence, therefore they are never finally “proven”.
The simple physics of CO2 as a greenhouse gas has been known for a century and a half. The consequences of the increase in atmospheric CO2 from 280 to 390 ppm for global average temperatures were predicted decades ago, and have come to pass but you simply want to say that is some sort of coincidence, when the increase cannot be accounted for by taking into the effect of “natural” forcings. They can only be explained by including calculations of the effect of increased atmospheric CO2. That is just one strand of evidence.
Simply saying these things have happened before is not a counterargument. You have to account for observations.
As for the plight or otherwise of polar bears – that is an effect of the warming and loss of ice. Polar bears do not cause global warming. I have never claimed they did.
You have failed to answer the question concerning bogus claims that it has not warmed for the last 17 years.
PS
Mr Stealey, your odious personality is evident not just in the personal attacks you make upon me adressed to others instead of confining yourself to arguing the science, but in your sanctimonious remark that it is none of my business and that I have no right to but in.
Thank you Mr. Stealy! The warmists get more “alarmed” the more the Earth debunks their belief system. I have never claimed to be a scientist but because of life experience I can spot hokum when I see it. The whole global warming meme is obviously hokum.
Correction: Stealey not Stealy.
“Since seals are air breathers, where do they go to rest when there is no sea ice?”
Some rest on beaches and skerries, other species can actually sleep floating hundreds of kilometers from land.
As for the decline of the West Hudson bay population I have heard it suggested by local that this may actually be due to this populatuion being very heavily “researched”. Most of the bears have been tranquilized at one time or another and did not like it, so now they hide whenever they hear a helicopter.
Why is global warming obviously hokum? What they propose is basically that a TRACE gas will lead to global meltdown. They have piggy backed this quaint notion on a completely natural warming trend to create hysteria. Shame on them! Now that we have a completely natural cooling trend they just don’t know what to do except amusingly spout off nonsense.
I notice that Mr. Shehan set up a straw man. None of us said that polar bears caused global warming, but in typical warmist debate tactics he refuted that nonexistant argument.
stan stendara.
Science is full small amounts of material having very large impacts.
And where is the completely natural cooling trend?
http://tinyurl.com/d4jxlth
Still waiting for a substantive argument on this.
I note that Shehan is unable to provide any scientific evidence showing that CO2 is the direct cause of global warming. Instead, he complains because I am holding his feet to the fire.
I stated in response to Shehan calling me ‘just another troll’ that I would be willing to apologize and say that I was wrong — IF Shehan could post convincing scientific evidence proving the existence of AGW. For the record, Shehan has been unable to post testable, verifiable, falsifiable evidence of AGW.
Shehan’s assertions are no different than these assertions [click in image to embiggen]:
http://oi55.tinypic.com/2jb7fk7.jpg
Now, AGW may exist as a minuscule forcing. But since it is too small to measure, it must be disregarded as inconsequential.
Latitude says:
they use the sea ice to travel, hunt, mate and rest.”
====
and they use land to not travel, hunt, mate and rest?
If the land in question is covered in ice/snow could they easily tell the difference between land and sea ice?
Anyway not many zoos appear to use what amounts to an ice rink for their polar bear enclosure. Thus the animals don’t appear to require ice underfoot.
#8 misses a bad period of heavy ice in Beaufort sea, IIRC 1960s-70 (near bottom of the lat cooling cycle (which Crockford refers to on her blog or other writings). Problem was population of ringed seals was way down due ice, hence polar bear population declined.
Pregnant females need food near their den, as they cannot forage far when cubs are young (IIRC baby polar bears take a while to develope).
Den location on Hudson’s Bay is unusual in that it is well inland, I speculate due food sources and to keep male polar bears away as they are a threat instead of a help. (Gosh, birds share nesting duty, what’s wrong with polar bears.
Mr Stealy. Your previous post contains a link which is an irrefutable scientific argument – your best yet. I must surrender to your giant intellect.
Fawning accepted.
You will note that prior to Mr Stealy’s slam dunk argument that some bad people think AGW is real therefore it must be wrong, I did indeed present evidence for AGW which as I predicted he simply refused to recognise as such.
No testable, measurable, falsifiable scientific evidence verifying that AGW exists has ever been posted by Shehan, or by anyone else. Any such evidence must conclusively show the specific amount of global warming that results from each ppm rise in human-emitted CO2. But there are no such measurements.
Shehan is blustering as usual: the fact that there is no agreement regarding the climate sensitivity number means that there are no verifiable measurements of AGW. None. Shehan’s baseless assertions are not scientific evidence, they are merely his opinion; his belief. Such assertions are what passes for ‘scientific evidence’ among the anti-science crowd — AKA: climate alarmists.
But there is plenty of evidence that burning fossil fuels affects the environment, the greening of the earth, rolling back the Sahara easy to blame on emitted CO2 if someone can read and has a reasonable memory the AGW scam was plain from the start but let us face it common sense ells us communism and socialism are both really bad for the common man, in fact a disaster for all but the elite and who votes for it?? the same people who will be most damaged by it. This is another battle in the same war against the elite and for the ungrateful and gullible man in the street.
“Any such evidence must conclusively show the specific amount of global warming that results from each ppm rise in human-emitted CO2.”
As with the demand for “proof” which even Isaac Newton failed to deliver, science does not demand this amount of detail before a theory is accepted. The theory only need supply the best explanation for the observed phenomena.
The amount of energy added to the earth per ppm is known to a high degree of precision.
http://knowledgedrift.files.wordpress.com/2010/05/log1-co2.jpg
For someone demanding such precision, you have not specified how the “specific” amount of warming is to be measured.
Atmospheric temperature anomaly only accounts for part of the increased energy content, and must take into account other forcings, which vary over time and short term weather fluctuations. Then there is the sensitivity question the degree to which the increase in atmospheric temperature due to increasing CO2 concentration effects the concentration of water vapour in the atmosphere which will increase temperature, and clouds, which shade the earth’s surface.
An empirical relationship between CO2 concentration and atmospheric temperature can however be demonstrated:
http://oi46.tinypic.com/29faz45.jpg
The amount of heat transferred to the oceans is more difficult to measure, and thius far measurements are restricted to a depth of 2000 M.
The multiple lines of evidence for AGW are enough to establish to a probability of 90% that human activities are increasing CO2 content which is having a measurable effect on climate.
It is simply not possible to do a laboratory type experiment on a complex system such as the entire earth to satisfy your demands. Even a laboratory experiment conducted with the utmost precision on a simple system cannot supply “proof” of a theory.
Science simply does not make those demands for a theory to be established and accepted.
That is the fallback position of the tobacco industry demanding proof that cigarettes cause cancer. There is none.
Wow: a mirror site with Sheehan reporting his activities over here and being encourage to continue is singular debate with DB Stealey and a couple of others. So, who are you Sheehan?
Not that I care.
Can I post this here?: http://www.skepticalscience.com/the-y-axis-of-evil.html
Hmm. AXIX OF EVIL! Thread bomb them out of existence!
Have a great Sunday Y’all.
With his cut ‘n’ paste models Shehan proves that there are no empirical [real world] measurements of AGW. None.
All that Shehan can do is link to curves that have nothing to do with real world measurements. If warming due to CO2 was measurable, then the question of the climate sensitivity number would be answered with precision. But it is not answered: there is an extremely wide divergence of opinion regarding the climate sensitivity number, from a negative CO2 forcing, to zero temperature rise due to CO2, to the UN/IPCC’s preposterous 3ºC – 6ºC for 2xCO2.
The fact that no one can agree on the sensitivity number means that it has never been measured. As usual, Shehan is prevaricating. There are no measurements showing that ∆CO2 causes ∆T. But there ARE measurements showing that changes in temperature cause changes in CO2.
The alarmist crowd has cause and effect confused. ∆T causes ∆CO2 — not vice versa. The proof is in the real world measurements, not in Shehan’s mendacious assertions.
Wayne: the name is Shehan with one “e”.
As to who I “am”. Among other things I have a PhD in Nuclear Magnetic Resonance spectroscopy and over 3 decades of research experience. I also have a post graduate qualification in History and Philosphy of Science – discipline which studies the nature of science and what constitutes scientific method and knowledege and distinguishes it from other types of knowledge.
Mr Stealey. In some circumstnces temperature causes CO2 concentrations to rise, in others increasing CO2 concentration causes temperature rise.
http://www.nature.com/news/how-carbon-dioxide-melted-the-world-1.10393
Philip Shehan says:
March 24, 2013 at 7:41 pm
Wayne: the name is Shehan with one “e”.
As to who I “am”. Among other things I have a PhD in Nuclear Magnetic Resonance spectroscopy and over 3 decades of research experience. I also have a post graduate qualification in History and Philosphy of Science – discipline which studies the nature of science and what constitutes scientific method and knowledege and distinguishes it from other types of knowledge.
+++++++++++++++++++++++++++++++++++++++++++++++++++++++++++++++++++++++++++
Then with your study of the Philosophy of Science you will be familiar with the “Theory of Great Machines” which is exactly what this whole CAGW thing is. IMHO. Ciao
From Shehan’s link, Nature candidly admits:
“There are many ideas about what caused the end of the last ice age 10,000 years ago, but a lack of data has hindered testing of hypotheses.”
In other words: they simply do not know.
But one thing is certain: CO2 was not the primary cause of past climate change. In fact, there is no measurable evidence showing that CO2 has any effect on temperature; none. There is simply no corroborating evidence.
The fact is that CO2 has no measurable effect on temperature. That scientific fact destroys the alarmists’ nonsense claiming that “carbon” is the cause of global warming. Therefore, Shehan’s credulous Belief System is once again debunked by Real World evidence.
Philip Shehan says:
March 24, 2013 at 2:15 am
The amount of energy added to the earth per ppm is known to a high degree of precision.
http://knowledgedrift.files.wordpress.com/2010/05/log1-co2.jpg
————————————————————————-
Philip, could you please elaborate on exactly what the data is we’re looking at here, and what you think this graph tells us regarding the earth’s climate.
I don’t doubt its accuracy.
Tell us in your own words, or cut and paste. Either way’s fine.
More years ago then I care to admit in what the English refer to as “at university” I took some statistics classes. During the opening class the professor, who I later learned was a world class statasian, said ” If your statiscal analysis leads to an absurd conclusion your method is either wrong or your math is.” Mr. Shehan’s initial post had a statsical analysis in it that postulated that some kind of 17 year series in which only one example of which confirmed global warming [out of a bunch of examples] somehow established some kind of trend that global warming was real. The conclusion is absurd! Enough said!
PS: I wish I could spell! My spell checker is asleep.
Just for the record I don’t “cut and paste”.
philincalifornia,
You will often hear it acknowledged by skeptics that while CO2 is indeed a greenhouse gas which makes the earth warmer than it would otherwise be, further increases CO2 concentration cannot lead to any significant increase in temperature because the relationship between concentration and temperature is logarithmic. See the curves here:
http://wattsupwiththat.com/2010/03/08/the-logarithmic-effect-of-carbon-dioxide/
The units of watts per square metre are the measure of energy per surface area and are proportional to temperature.
The graphs presented there are quite correct but because of the vertical “squashing” in the presentation of the curves to cover an energy and/or CO2 range from zero to present concentrations they can give the impression that at current levels of CO2 concentration, addition of more CO2 will not make much difference to temperature.
The graph I provided covers the CO2 concentration from pre industrial revolution to the present – about 280 ppm to 390 ppm – and associated rise in energy (temperature) in the first horizontal division.
It shows that addition of another hundred, two hundred or three hundred ppm of CO2 will have a significant (though diminishing) effect on temperature.
The point I was making to Mr Stealy is that whereas the amount of extra energy directly added (or more accurately retained by preventing re-radiation) with addition of CO2 is known very precisely, it cannot directly be observed in terms of atmospheric temperature increase because there are many variables other than CO2 concentration contributing to atmospheric temperature.
I hope that answers your question.
Mr. Shehan you have the persistance of the fanatic or the zealot. There is no point in talking to you. Your mind is obviously closed.
so If we start planting bamboo which grows rapidly, gives off lots of O2 and uses large amounts of CO2 we can cool the earth without taxing the fool out of Americans
Philip Shehan says:
March 24, 2013 at 11:43 pm
——————————-
Yes, thank you, I understand.
You said “The point I was making to Mr Stealy is that whereas the amount of extra energy directly added (or more accurately retained by preventing re-radiation) with addition of CO2 is known very precisely, it cannot directly be observed in terms of atmospheric temperature increase because there are many variables other than CO2 concentration contributing to atmospheric temperature.”
I hardly think that you need to point that out to D.B. Stealey. Presenting that graph in isolation is just another rehash of the ludicrous “simple physics” theory of global warming, so I was wondering about you and your argument ??
Also, personally, I find the graphs that you linked to to be a better visual representation of what is going on in the simple Beer-Lambert Law world, but we all have our own opinions.
Mr Stealey writes:
‘Nature candidly admits:
“There are many ideas about what caused the end of the last ice age 10,000 years ago, but a lack of data has hindered testing of hypotheses.”
He fails to acknowledge that this refers to the situation before the study under discussion. That study provides that data
‘by analysing data gathered from 80 locations around the world, Jeremy Shakun, a palaeoclimatologist at Harvard University in Cambridge, Massachusetts, and his colleagues have shown that at the global level, warming followed CO2 increases. The team used seven different records of past temperature, including ice cores, ancient pollen and the chemical composition of fossilized microscopic life.
“This is the first effort to get most of the data that’s out there together,” says Shakun. “It’s the first hard empirical proof that CO2 was a big driver of global warming out of the ice age.”’
Mr Stealey claims that because the amplification in temperature due to CO2, largely due to water vapour is not known with precision, and is currently a subject of intense research – the current values are between 2 and 4.5 C with the most likely value 3 C – that means that the warming due to CO2 is not understood. That is a nonsense argument.
Mr Stendara makes yet another personal remark without making any attempt whatsoever to engage the scientific argument. And he calls me a closed minded zealot and fanatic.
As for his claim that I have presented one data set to support my argument on the alleged stalling of temperature, how about actually tackling this data:
http://tinyurl.com/a35ttdu
philincalifornia.
I agree that the other graphs in the link provide a more complete representation of the logarithmic nature of the CO2 temperature relationship, but as I pointed out, that can lead to an erroneous conclusion regarding the effect of further CO2 on temperature at concentrations relevant to the global warming debate.
I agree that the graph in isolation is simple but that was the point I was making to Mr Stealey. He demands a precision in the observation of the effect on temperature which cannot be obtained as there are many factors other than CO2 concentration affecting atmospheric temperature, and it is my experience that many people overlook this fact in comments, claiming for instance that a failure of observed temperature to correlate precisely with CO2 concentration is a demonstration of the failure of the theory of AGW.
Philip Shehan says:
March 25, 2013 at 9:16 am
————————————
D. B. Stealey is perfectly capable of answering himself, but since I have the keyboard ……
……… I’ve never seen him dispute the fact that CO2 could cause some warming. Quite the opposite, in fact.
If, however, the CO2 temperature signal cannot be separated from natural variability or, as you say “many factors other than CO2”, then there can be no cAGW or dangerous AGW, right ?
Somehow this thread on Polar Bears has transformed. (I am not terribly worried about the bears as long as we don’t take away the food supply for seals, or Caribou, or Musk Ox or Reindeer. [Yes Martha, Polar Bears hunt on land as well but not as successfully.] They also eat whales, birds, birds eggs, rabbits, roots, berries and all sorts of other available foods as they are omnivores. The are quite adaptable.)
However the “Science” discussions going on in this thread between a few about temperature trends, projected temperatures, radiative values and such and the whole philosophy of science makes me think that some folks should read this:
http://arachnoid.com/theory/index.html
Makes me wonder if AGW is “Science”. Politics for sure, Philosophy perhaps; a hint of science -most likely; a “Great Machine” – undoubtedly.
I do like the last comment from Dr. Shehan:
“I agree that the graph in isolation is simple but that was the point I was making to Mr Stealey. He demands a precision in the observation of the effect on temperature which cannot be obtained as there are many factors other than CO2 concentration affecting atmospheric temperature, and it is my experience that many people overlook this fact in comments, claiming for instance that a failure of observed temperature to correlate precisely with CO2 concentration is a demonstration of the failure of the theory of AGW.”
So, it appears conclusive. AGW and CO2 effects on the earth as a whole is a “belief” since “…there are many factors other than CO2 concentration affecting atmospheric temperature…”
My opinion exactly. We don’t know. So why are we spending trillions on something we can’t attribute and measure?
Mr. Delbeke: Thank you for adding some sanity to this thread.
It is impossible not to notice in the article you so kindly gave a link to that the AGW crowd are not practicising science.
Wayne. You mistake my point. The effects of CO2 on global tmperature can be measured. Just not with the unrealistic degree of precision that Mr Stealey is demanding for a complicated system like climate.
But the accuracy of the theories is high enough to account for what has been observed to a very high degree, which gives confidence that predictions of what will happen to global temperatures in the future.
I note that your link is titled:
“Why Science Needs Theories – Theories set science apart from stamp collecting”
Exactly the point I have made repeatedly to “skeptics” who condemn “models”.
Model is another term for theory which long predates the computer age, as in the Bohr model of the atom. Sometimes the theory is actually what the layman understands a model to be – a material reconstruction as with Watson and Crick’s theory of the structure of DNA which they presented as a metal structure.
So it is with computer models of the climate. They are a mathematical representation of the current theoretical understanding of the many factors affecting climate.. When theories of global temperature are compared to the empirical data, they show a very good match with reality. Excluding what is understood to be the contribution from anthropogenic causes, principally CO2 does not match reality.
”Skeptics” who simply dismiss this evidence because it does not match their “beliefs” are being utterly unscientific.
http://www.ipcc.ch/publications_and_data/ar4/wg1/en/figure-9-5.html
http://web.archive.org/web/20100322194954/http://tamino.wordpress.com/2010/01/13/models-2/
‘Nuff said.
http://bigmedicine.ca/wordpress/2013/03/newfoundland-and-labrador-polar-bear-warning-issued-for-st-anthony/
http://www.cbc.ca/news/canada/newfoundland-labrador/story/2012/04/02/nl-bonavista-bear-402.html
http://www.cbc.ca/news/canada/newfoundland-labrador/story/2012/05/07/nl-photos-polar-bear-nap-507.html
Philip Shehan makes presumed assertions regarding my position, but without cutting and pasting any of my comments. It is difficult debating a mind-reader, and it is certainly un-scientific.
Here is how Shehan should do it:
Shehan says: “The effects of CO2 on global temperature can be measured. Just not with the unrealistic degree of precision that Mr Stealey is demanding for a complicated system like climate.”
Shehan’s first sentence is easily deconstructed. The effects of CO2 cannot be measured. How many times do I have to explain that if the effect of CO2 could be measured, then there would be no question about the climate sensitivity number for 2xCO2? As it is, there is a wide range of guesstimates. But if we could empirically measure the effect of CO2, then there would be no dispute about the amount of warming from 2xCO2. As it is, there is no such empirical measurement available.
If the effect of CO2 on temperature could be measured, then Shehan could produce a graph just like this one, showing a cause and effect relationship between changes in CO2 and subsequent changes in temperature.
Shehan’s second sentence demands no more than equal “precision” to the WFT chart that I posted here. Shehan is just tap-dancing around the fact that he has no credible argument: there is no comparable chart showing measurements of the effect [if any] of CO2 on global temperature.
Certainly, if Shehan could produce such a chart, he would have by now. The reason that he cannot produce such a chart is because the effect of CO2 cannot be measured. It is either too small, or it is non-existent.
Thus, the entire AGW argument fails. Either the effect of CO2 is so minuscule that it can be completely disregarded for all practical purposes, or CO2 simply does not affect temperature at all. Take your pick. Either way, the “carbon” scare fails — based on science and reason. The alarmist crowd has decisively lost the argument, and they are now reduced to hand-waving.
Why should I routinely curt and paste Mr Stealy’s comments? I did above to demonstrate he was wrong, which hew has failed to acknowledge:
http://www.nature.com/news/how-carbon-dioxide-melted-the-world-1.10393
Mr Stealey writes:
‘Nature candidly admits:
“There are many ideas about what caused the end of the last ice age 10,000 years ago, but a lack of data has hindered testing of hypotheses.”
He fails to acknowledge that this refers to the situation before the study under discussion. That study provides that data
‘by analysing data gathered from 80 locations around the world, Jeremy Shakun, a palaeoclimatologist at Harvard University in Cambridge, Massachusetts, and his colleagues have shown that at the global level, warming followed CO2 increases. The team used seven different records of past temperature, including ice cores, ancient pollen and the chemical composition of fossilized microscopic life.
“This is the first effort to get most of the data that’s out there together,” says Shakun. “It’s the first hard empirical proof that CO2 was a big driver of global warming out of the ice age.”’
Mr Stealey certainly has faith in CO2 and temperature measurements when he produces his graph, in which he has factored out the long term trend.
I have no argument whatsoever with the assertion that temperature can and does effect temperature.
Mr Stealey ignores the established fact that can also CO2 causes rises in temperature. This is simple physics, demonstrated in the laboratory.
He has no answer to the link I provided other than to fail to understand it or misrepresent it as I noted above when I corrected him.
Now for more cut and paste:
“Shehan’s first sentence is easily deconstructed. The effects of CO2 cannot be measured. How many times do I have to explain that if the effect of CO2 could be measured, then there would be no question about the climate sensitivity number for 2xCO2?”
This is simply nonsense. The precision with which the effect of CO2 on temperature is known is quite separate from the precision with which the amplification or reduction of this effect which causes the sensitivity:
http://www.image.ucar.edu/idag/Papers/PapersIDAGsubtask1.3/Knutti_nature08.pdf
S = T2CO2 the equilibrium climate sensitivity,
the equilibrium global average temperature change for a
doubling (usually relative to pre-industrial) of the atmospheric
CO2 concentration, which corresponds to a long-wave forcing
of about 3.7 W m−2 (ref. 7). The beauty of this simple conceptual
model of radiative forcing and climate sensitivity (equation (1))
is that the equilibrium warming is proportional to the radiative
forcing and is readily computed as a function of the current CO2
relative to the pre-industrial CO2: T = S ln(CO2/CO2(t=1750))/ln2.
The total forcing is assumed to be the sum of all individual
forcings. The sensitivity S can also be phrased as8–10
S = T0/(1 −f) (2)
where f is the feedback factor amplifying (if 0 < f < 1) or damping
the initial blackbody response of T0 = 1.2 °C for a CO2 doubling.
The total feedback can be phrased as the sum of all individual
feedbacks9 (see Fig. 2; examples of feedbacks are increases in
the greenhouse gas water vapour with warming; other feedbacks
are associated with changes in lapse rate, albedo and clouds). To
first order, the feedbacks are independent of T, yielding a climate
sensitivity that is constant over time and similar between many
forcings. The global temperature response from different forcings is
therefore approximately additive11.
But the observed global temperature is not simply due to the primary effect of CO2 and its secondary amplification/reduction because there are other “natural” forcings which contribute to global temperature.
Just how is one supposed to satisfy Mr Stealey’s requirement that we directly “measure” the effect the of CO2 on global temperature in isolation, keeping every other parameter constant? Science simply does not require that to come to valid scientific conclusions. Climate science is one of many disciplines, like evolution and cosmology which are too big and to complex to be reproduced in a laboratory and reductionist experiments can be carried out, but this does not preclude scientific measurements being carried out and theories developed.
The difficulties involved in separating and quantifying these effects notwithstanding, climate theory can calculate the effects of “natural” and man made forcings on temperature which match reality to a very high degree of accuracy. Once again I present this link:
http://www.ipcc.ch/publications_and_data/ar4/wg1/en/figure-9-5.html
This is also a rebuttal to philincalifornia’s comment:
“If, however, the CO2 temperature signal cannot be separated from natural variability or, as you say “many factors other than CO2″, then there can be no cAGW or dangerous AGW, right ?”
Wrong.
philincalifornia also writes:
“D. B. Stealey is perfectly capable of answering himself, but since I have the keyboard ……
……… I’ve never seen him dispute the fact that CO2 could cause some warming. Quite the opposite, in fact.”
I would be delighted if Mr Stealey would explain his position on this.
Shehan says:
“I have no argument whatsoever with the assertion that temperature can and does effect temperature.”
Try making sense.
And:
“Why should I routinely curt [sic] and paste Mr Stealy’s comments?”
Answer: because without addressing my exact words, Shehan is erecting his own strawman, and arguing with that. If it were not for his failed strawman arguments, Shehan wouldn’t have much to say.
Next, Shehan asserts:
“Mr Stealey ignores the established fact that can also CO2 causes rises in temperature. This is simple physics, demonstrated in the laboratory.”
I didn’t “assert”; I proved it with empirical measurements — something that Shehan is incapable of proving regarding his failed assertions.
Shehan incapable of posting a chart like the CO2/T chart that I posted, but which shows that ∆CO2 is the measurable cause of ∆T. Why? Because Shehan has no such scientific evidence. He has no chart that shows empirically that changes in CO2 cause measurable changes in temperature. And Shehan’s ‘laboratory’ is completely different than the convection-controlled atmosphere, while a laboratory inhibits convection. Apples/Oranges.
Next, Shehan says: “Just how is one supposed to satisfy Mr Stealey’s requirement that we directly ‘measure’ the effect the of CO2 on global temperature in isolation, keeping every other parameter constant?”
Simple answer: In the exact same way that the relationship between T [the cause] and CO2 [the effect] was measured. But Shehan cannot produce any such measurements showing that CO2 causes T. Thus, his conjecture fails.
And by falsely asserting that catastrophic AGW exists, Shehan’s little remaining credibility is completely destroyed. There is NO empirical evidence supporting that baseless nonsense. CAGW is simply Shehan’s True Belief; it is his religion. That’s all.
Finally, philincalifornia is correct. My consistent, long-held position has always been that either
1) AGW exists, but it is too minuscule to measure; therefore it can be completely disregarded for all practical purposes, or
2) AGW does not exist.
I tend to go with #1, but take your pick. Either way, AGW does not matter at all.
Cut and paste:
‘Next, Shehan asserts:
“Mr Stealey ignores the established fact that can also CO2 causes rises in temperature. This is simple physics, demonstrated in the laboratory.”
I didn’t “assert”; I proved it with empirical measurements — something that Shehan is incapable of proving regarding his failed assertions.’
Pardon the failure of proof reading in my statement which was clearly meant to read CO2 can also cause rises in temperature, and my earlier statement was clearly meant to read that that I had no argument with the fact that temperature can and does cause changes in CO2 concentration.
Mr Stealey has not “proven” by any empiriical evidence whatsoever that the statement is correct – that CO2 can also cause reises in temperature- or incorrect.
He has simply produced a graph which shows variation on CO2 following temperature changes. Such a correlation is entirely unremarkable given the seasonal variation in CO2 concentration resulting from plant growth and decay.
“But Shehan cannot produce any such measurements showing that CO2 causes T.”
Mr Stealey demands evidence that CO2 causes temperature rises, but remains totally silent on his misrepresentation of the paper which presents such evidence:
“How carbon dioxide melted the world
Global data set shows that rising greenhouse-gas levels drove the end of the last ice age.”
http://www.nature.com/news/how-carbon-dioxide-melted-the-world-1.10393
He regards his simple graphical presentation of CO2 following temperature as “proof” that temperature cannot follow CO2 concentration (a logical nonsense), yet goes bananas every time if present two graphs showing the upswing in temperature following the upswing in CO2 concentration.
He cannot bear to look at the temperature graph because it shows something he cannot accept as it runs counter to his cherished belief, falsely describing it as the work of John Cook, a cartoon, hand drawn, without “provenance”, a lie decietful, mendacious, etc etc etc without being able to provide a skeric of evidence to support these claims.
CO2 concentrations strt to rise in the 1850s
http://tinyurl.com/aj2us99
Global temperatures start to rise in the 1880s:
http://tinyurl.com/aj2us99
Pardon me. The temperature graph is here:
http://www.skepticalscience.com/pics/AMTI.png
As usual, Shehan does a simple overlay of CO2/T, and then he claims that it shows that the rise in CO2 caused the rise in T. But of course, it shows no such thing. For a longer term trend, see here.
That chart covers the Holocene, and it shows that T is not the result of the entirely coincidental rise in CO2. Even the Economist now admits that the CO2 claim is foundering on the rocks of solid scientific evidence. And once again Shehan has posted his mendacious chart, purportedly showing an accelerating rise in temperature. Disagreement is one thing, but when Shehan resorts to lying about reality, we know that he has run out of honest facts. Werner Brozek and others have corrected Shehan for posting that dishonest chart, yet he continues to link to it. Disgraceful.
I provided a chart demonstrating conclusively that ∆CO2 is caused by ∆T. But Shehan does not like the fact that he is unable to produce a similar chart, showing that ∆CO2 causes ∆T. That is because his mind is made up, and closed tighter than a drum skin [it is also because there is no measurable evidence that ∆CO2 causes ∆T]. Science is certainly not Shehan’s strong point; his religious True Belief is. The unscientific belief in the repeatedly debunked CO2=CAGW conjecture is Shehan’s religion.
Like most here, I prefer the Scientific Method, testability, reproducibility, empirical evidence, and the climate Null Hypothesis — all of which refute Shehan’s religious belief in the “carbon” demon. The nice thing about religious faith is that you don’t have to think for yourself, so you can arbitrarily reject inconvenient facts that do not fit your dogma. That is the same religious attitude that kept witch doctors in business for millennia.
WHERE’s MY GLOBAL WARMING Shehan?
It is NOT Nice to fool with Mother Nature
Well, as predicted Mr Stealey goes into overdrive over this graph:
http://www.skepticalscience.com/pics/AMTI.png
“And once again Shehan has posted his mendacious chart, purportedly showing an accelerating rise in temperature. Disagreement is one thing, but when Shehan resorts to lying about reality, we know that he has run out of honest facts. Werner Brozek and others have corrected Shehan for posting that dishonest chart, yet he continues to link to it. Disgraceful.”
Note again Mr Stealey’s appeal to “authority”- alleged posts from other skeptics who like Mr Stealey don’t like it either but can produce no evidence that it it in any way incorrect. (And I don’t believe Werner Brozak was one of those, but if he was, so what?)
Now in all the time he has been fulminating about this graph, he has never produced one iota of evidence that it is in any way incorrect. If you have such evidence Mr Stealey, produce it.
I previously provided links to the temperature data on which it is based, and the mathematical fit produces a curve with a very respectable correlation coefficient r2 of 0.8412. If Mr Stealey wishes to maintain that a linear fit of the data is superior he is entitled to his opinion, but that does not make the nonlinear fit in any way dishonest.
http://www.woodfortrees.org/plot/hadcrut4gl/from:1850/to:2013/mean:12/plot/hadcrut4gl/from:1850/to:2013/trend
In line with Mr Stealey’s appeal to authority, I present the opinion of a skeptic who does not share Mr Stealey’s opinion regarding the quality of the fits:
Graham W says:
January 14, 2013 at 5:35 am
Philip Shehan: When drawing a straight line through the data from 1880 to 2007, compared to an exponential curve through the same data…Yes, the exponential curve fits the data better than the straight line.
Stealey hates it because it does not support his cherished beliefs on temperature dependence.
Gail Combs. Here is your global warming:
http://www.woodfortrees.org/plot/hadcrut4gl/from:1945/to:2103/mean:12/plot/hadcrut4gl/from:1945/to:2103/trend/plot/hadcrut4gl/from:1996/trend
If you have noticed, extreme winter weather has followed extreme summer weather and increasing areas of open sea in the summer arctic for several years now. The warming arctic produces a southward movement of the jetstream bringing colder winds further south in the winter.
Shehan, your dishonest, fabricated graph is the kind of chart liars use to purvey their climate scare. There is no truth in it; it is unsourced nonsense emitted by a thinly-trafficked propaganda blog. Even the Economist now admits that global warming has stalled. You are the only purveyor of mendacious climate nonsense left who falsely claims that global warming is accelerating.
And of course I can prove that Shehan’s Pseudo-skeptical Pseudo-science chart is a lie made by a liar: it has no provenance. It is hand-made by a John Cook fanboi, and it misrepresents reality. This is a correct representation of reality, from a widely accepted database. Where is the acceleration in temperature? There is none. But Shehan posts lies about it; lies are all he’s got.
Shehan says: “Stealey hates it because it does not support his cherished beliefs…” That is pure psychological projection there. In fact, no one agrees with Shehan’s anti-science ‘accelerating temperature’ beliefs, which are purely religious beliefs.
It is a pleasure correcting Shehan’s deliberate misrepresentations where everyone can see them. SkS has very little traffic, and anyway they heavily censor comments from honest scientific skeptics. But here, on the internet’s “Best Science” site, Shehan’s alarmist lies can be easily exposed for everyone to see.
As predicted Mr Stealey continues his hysterical condemnation of temperature data graph from 1850 to the present without explainig where it is incorrect.
Mr Stealey presents a number of graphs, one showing temperature Hadcrut3 and 4 temperature data from 1003 to 2013. So what? Here are Hadcrut3 and 4 and data from 1859 to 2013:
http://www.woodfortrees.org/plot/hadcrut4gl/from:1850/to:2013/mean:12/plot/hadcrut3vgl/from:1850/to:2013/mean:12
Where is the acceleration in the graph showing (what) data from1980? I don’t know. What is the graph supposed to be showing?
Here is Had4 data for that period:
http://www.woodfortrees.org/plot/hadcrut4gl/from:1980/to:2013/mean:12
What does the temperature plot from 1997 to the present have to do with the data from 1850, other than the obvious fact that it covers only the last 16 years of that period?
Why does the only temperature graph Stealey is willing to consider covering the period from 1850 so compress the data in the vertical axis that no trend can be discerned? (Rhetorical question – we all know the answer)
Why does he show superimposed temperature –Muana Loa CO2 concentration data only from 1996 instead of when Muana Loa data began in 1950? (Another rhetorical question)
http://www.woodfortrees.org/plot/gistemp/from:1958/mean:12/normalise/offset:-0.05/plot/esrl-co2/from:1958/to:2013/normalise/scale:0.9/offset
But most of all, these arguments concerning other data sets are diversions from the fact that Mr Stealey cannot demonstrate where this graph is wrong.
http://www.skepticalscience.com/pics/AMTI.png
All he can do is repeat the nonsense arguments:
It has “no provenance”. Meaning what? The temperature data sets have been provided.
“Hand made” Complete nonsense which has provided absolutely no evidence for.
Not only hand made, but “hand made by a John Cook fanboi”
Only Stealey could consider that a scientific argument.
His argument from authority- he puts up his plots and announces they and his opinions appear on the internet’s “Best Science” site.
Well so does this one:
http://www.skepticalscience.com/pics/AMTI.png
Pardon the typos again.
Philip[ Shehan says:
“Pardon the typos again.”
Typos pardoned. Lying is not.
Shehan’s first chart above shows only a simple overlay. So does his third chart. Neither shows cause-and-effect, as this chart clearly does. In fact, Shehan is incapable of posting empirical evidence showing that ∆CO2 causes ∆temperature. Why? Because there is no such evidence. That’s why. If more CO2 caused a rise in temperature, that putative rise is simply too minuscule to measure. That is the reason there are no charts showing what Shehan baselessly asserts.
Shehan keeps trotting out completely irrelevant charts, hoping that no one will notice that he’s blowing smoke. But I am here to point out that he is being serially disingenuous: there has been no acceleration of global warming. None. No one except Shehan disputes that, and Shehan’s only “evidence” is his fabricated chart — which Shehan now feels he needs to post twice — as if that would make it legitimate.
Shehan’s second chart above shows nothing but the planet’s natural recovery from the LIA. It certainly shows no accelerated warming — flatly contradicting Shehan’s last chart above, which of course is an outright lie, as noted by several other commenters.
So, why does Shehan lie? It is not because Shehan must support his climate religion at all costs. It is not because Shehan has a credible argument to make, but lacks real world supporting facts. No. Shehan lies about ‘accelerating’ global warming for only one reason. Take a guess what it is.
I see that Climate Audit has just posted a detailed article today, detailing the lying endemic to the climate alarmist cult.
Alarmists like Lewandowski, Shehan and Cook [among others] lie because if they admitted the truth, their false narrative would come crashing down. The fact is that nothing unusual or unprecedented is, or has been, occurring. Current climate parameters are all well within historical norms [including polar ice cover, which is above its long-term average]. The Null Hypothesis has never been falsified.
Any honest scientist would look at the complete lack of physical corroboration, and rightly conclude that the “carbon” scare has been falsified. But the alarmist crowd has no integrity, none at all. They lie like children caught with chocolate on their faces, standing next to an open cookie jar. The rest of us know they are lying. But when called on their lies, they double down and still insist — despite mountains of evidence falsifying their mendacious claims — that catastrophic AGW is upon us. The worst of it is, they know they are lying. And the reason is not because they need to support their religious AGW cult at all costs, or that they lack real world facts. No. They lie for only one basic reason: they lie because they are liars.
It is truly despicable the depths that many alarmists have sunk to. Personal integrity means nothing to them; their false narrative is everything, and if it must be supported with lies, then that is just the cost of admission. Honesty is simply not in them. As Steve McIntyre points out, they are bald faced liars. Read McIntyre’s article; you will see. As usual, McIntyre thoroughly backs up his accusation.
Apart from the usual name calling, Stealey’s argument is this.
If you put two data sets on a single graph with one apparently following the other that demonstrates causer and effect. Actually in principle it does not as both data may be caused by a third factor. However I have stated that I accept Stealeys proposition for the reasons given above.
If however you present two sets of data on seperate graphs but do not superimpose them on on a single graph, even though one trend clearly follows the other, that does not demonstrate cause and effect.
Go figure.
Shehan says:
“If you put two data sets on a single graph with one apparently following the other that demonstrates causer and effect.”
No, it doesn’t. For example, this graph appears to show cause and effect. But in reality, it does not. It is only a simple overlay.
One more time: the only chart that shows cause and effect, shows that ∆CO2 follows ∆T. There is no chart, and no empirical evidence, showing that temperature changes are caused by CO2.
Once that basic fact is understood, the AGW conjecture self-deconstructs.
I refer readers to the current exposé of the endless alarmist lying, by Steve McIntyre, Geoff Chambers, and Barry Woods. They have shown how mendacious John Cook and his pals are.
If it were not for the lies they tell, along with their psychological projection, the alarmist crowd would have nothing to say. Shehan has been reprimanded by a physics professor and by others for repeatedly posting Cook’s fabricated chart, purportedly showing rapidly accelerating global temperatures.
But we know that global warming has essentially halted for the past decade and a half. Since the physics community now accepts that fact, the response of the alarmist crowd has been to double down, and to now lie about it outright.
Satellite observations show that global warming has stalled out. The ARGO deep ocean buoys show that the ocean is not warming. The Envisat satellite observations showed that the planet is cooling — so Envisat was decommissioned. In fact, every empirical observation shows that the global warming scare is a baseless canard.
The alarmist crowd has nothing left now, except for their lies. The planet is decisively falsifying their false alarm. There is nothing either unprecedented, or unusual, with regard to current climate parameters — which have been routinely exceeded in the past. Thus, their wild-eyed cult does what any cult would do: they lie about it.
Society is very fortunate in having an honest resource like WUWT to set the record straight. Alarmist lies can easily be proven, which is why fewer and fewer people are spouting CO2=CAGW lies. There is simply no real world evidence to support the repeatedly falsified “carbon” conjecture. But rather than accept the reality of what Planet Earth is saying, a few of the truly whacked out prevaricators continue to emit the false propaganda that global warming is ‘accelerating’. But it is not, as any honest person will admit.
dbstealey says:
March 28, 2013 at 6:05 pm
…. But rather than accept the reality of what Planet Earth is saying, a few of the truly whacked out prevaricators continue to emit the false propaganda that global warming is ‘accelerating’. But it is not, as any honest person will admit.
>>>>>>>>>>>>>>>>>>>>>>>>
But db, they are correct it is ‘accelerating’
So yes global warming is ‘accelerating’ because there has been a change in the rate of warming. The fact that the change has been negative does not mean it has not “accelerated” we can have global warming ‘accelerating’ right into the depths of an ice age.
/sarc>
MORE POLAR BEARS MORE HAPPINESS YAHHH
Gail Combs,
Philip Shehan was reprimanded by Werner Brozek, a professor of physics, for the fabricated upward-curving red line in his chart. To most folks that would indicate acceleration of global warming. But that chart has no provenance; it was fabricated for the SkS blog by an anonymous cartoonist. It is an invention constructed to promote a false alarm. In fact, there has been no acceleration in global warming.
Most people understand ‘acceleration’ to mean a geometric rise in temperature, where each time period shows a greater rise than the preceding time period. But as numerous charts posted in this thread show, global temperatures are not accelerating. In reality, the steady rise in global temperature follows the long term rising trend line of ≈0.35ºC/Century. That naturally rising trend has not changed since the end of the LIA.
It is a dishonest scare tactic to falsely show an ever-faster rise in global temperatures. Empirical observations and measurements show no acceleration, only a very mild, steady rise in temperature.
As a matter of fact, global warming has stalled for at least the past decade and a half. Given that fact, the alarmist crowd has one of two choices: either admit that their models and predictions have been falsified by reality — or, they can lie about it, claiming that global warming is continuing at an ever accelerating rate. People like Shehan, Lewandowski and Cook have chosen to lie about it for their own self-serving reasons.
[snip.]
I might add that Mr Stealey is so obsessed with arguing with me regardless of the facts that here he ended up arguing with himself:
dbstealey says:
March 28, 2013 at 4:55 pm
Shehan says:
“If you put two data sets on a single graph with one apparently following the other that demonstrates causer and effect.”
No, it doesn’t. For example, this graph appears to show cause and effect. But in reality, it does not. It is only a simple overlay.”
The graph I had been referring to was “this one”
http://www.woodfortrees.org/plot/esrl-co2/isolate:60/mean:12/scale:0.26/plot/hadcrut3vgl/isolate:60/mean:12/from:1958
which Stealey posted with the comment:
“Shehan’s first chart above shows only a simple overlay. So does his third chart. Neither shows cause-and-effect, as this chart clearly does.”
Now never mind the fact that “this graph” is also a simple overlay.
In Stealey world, if he posts it, he states it shows cause and effect.
If I agree with him on that point, he says it does not.
Amazing from anyone but Stealey.
Mr Stealey. I have never reprimanded Werner Brozak. He has never reprimanded me. I have disagreed with Werner on a number of matters but our exchanges have always been conducted with courtesy and mutual respect. You should take note.
I will here address you in your own terms. You are a serial liar.
You repeatedly claim the graph has no “provenace”. You fail to state what you mean by that term I have provided all the “provenance” required on numerous occassions.
This is a lie and you know it to be a lie because I have repeatedly corrected you on this matter:
“it was fabricated for the SkS blog by an anonymous cartoonist.”
The graph is by Robert Way, PhD.
Dr Way gives the source of the temperature data with an explanation:
http://www.skepticalscience.com/pics/SummaryTable.png
“Each temperature dataset has their own individual caveats so it is difficult to assess which is the most reliable, but a purely unscientific way to look at this issue is to put all the datasets on the same baseline and to average them to create the All Method Temperature Index (AMTI). I have put all the Table 1 datasets on the 1990-2000 baseline (so we could include all) and have averaged them to create Figure 1 below.”
http://www.skepticalscience.com/pics/AMTI.png
The temperature data is fitted to a best fitted by computer to polynomial function to produce the red curve with an extremely good correlation coefficient R2 of 0.8412.
Shehan says:
“In Stealey world, if he posts it, he states it shows cause and effect.”
Correct. But in Shehan world, any overlay Shehan posts shows cause and effect.
But of course, it does not. This chart clearly shows cause and effect. But not one of Shehan’s links is anything but an overlay of one chart on top of another. None of them show cause and effect. Anyone with even the most rudimentary scientific education can see that ∆temperature is the cause of ∆CO2; not vice-versa.
Shehan is just sniveling because he cannot argue based on any empirical evidence. His one dishonest, fabricated chart that he posts incessantly purports to show accelerated warming. But even the Economist now admits that global warming has stalled. In fact, it is the consensus even among the climate alarmist crowd that global warming has stopped.
Any honest scientist would look at the complete lack of evidence for the runaway global warming conjecture, and admit that the CAGW conjecture has been deconstructed. But many in the alarmist crowd, such as Shehan, are being dishonest. They know that the steady rise in harmless, beneficial CO2 has no effect on global temperature.
My job — which I am very good at — is to prevent new readers from getting the misimpression that catastrophic AGW is occurring. It is not. The Null Hypothesis proves beyond any doubt that there is no runaway global warming, because all current climate parameters have been routinely exceeded in the past. Nothing now occurring is either unprecedented, or even unusual. Shehan is simply lying about it when he claims that global warming is accelerating. There is zero empirical evidence supporting that belief system. An honest scientist would admit that their conjecture has failed; a dishonest person would double down on their CAGW fantasy.
May I know the grounds for the snip on my post which was a correction of the record with regard to Stealey’s repeated personal attacks and misrepresentations of me?
Why is he allowed to continue this if I am not allowed to respond?
Mr Stealey. I have never reprimanded Werner Brozak. He has never reprimanded me. I have disagreed with Werner on a number of matters but our exchanges have always been conducted with courtesy and mutual respect. You should take note.
I will here address you in your own terms. You are a serial liar.
You repeatedly claim the graph has no “provenace”. You fail to state what you mean by that term I have provided all the “provenance” required on numerous occassions.
This is a lie and you know it to be a lie because I have repeatedly corrected you on this matter:
“it was fabricated for the SkS blog by an anonymous cartoonist.”
The graph is by Robert Way, PhD.
Dr Way gives the source of the temperature data with an explanation:
http://www.skepticalscience.com/pics/SummaryTable.png
“Each temperature dataset has their own individual caveats so it is difficult to assess which is the most reliable, but a purely unscientific way to look at this issue is to put all the datasets on the same baseline and to average them to create the All Method Temperature Index (AMTI). I have put all the Table 1 datasets on the 1990-2000 baseline (so we could include all) and have averaged them to create Figure 1 below.”
http://www.skepticalscience.com/pics/AMTI.png
The temperature data is fitted to a best fitted by computer to polynomial function to produce the red curve with an extremely good correlation coefficient R2 of 0.8412.
Is Stealey on moderating duty at the moment? I know he has this position and has access to posts which do not apppear as on one occasion he has made specific references to such commments of mine.
Shehan says:
“I have never reprimanded Werner Brozak. [sic]” Correct.
“He has never reprimanded me.” False.
Shehan was informed by Prof Brozek that the red line in his linked chart is incorrect. Yet Shehan has posted that incorrect link even more often after being corrected. Why is Shehan deliberately trying to mislead? There has been no acceleration in global warming. In fact, global warming has halted.
Perhaps Shehan can get Robert Way to defend his fabrication right here. Note that it is contradicted by other charts linked by Shehan, which show no acceleration in global warming. In fact, the longest-term charts show conclusively that global warming has been rising naturally at the same rate — whether CO2 was low, or high — thus falsifying the failed conjecture that rising CO2 is the cause of [mythical] ‘accelerated’ global warming [btw, the problem is specifically regarding the red line].
By sticking to the scientific facts, the CAGW scare is shown to be absolutely baseless nonsense.
I don’t think you guys are getting anywhere. 🙂 I like a good brawl as much as the next guy, more than most maybe, but still this isn’t going anyplace.
Philip, I’m offering an unsolicited suggestion. You would get more traction here by pulling the raw data from the various sets yourself, averaging and polynomial fitting yourself than you would by citing an SkS graph. I’m certainly not going to accept a graph from the purveyor of twitterbots, recursive fury, and after the fact comment/post editing without walking through the data and method, and I fail to see why you’d expect anybody else here to either.
Nite gents.
By the way, I thank the moderator for reconsideration of the snip of my post.
May I also add that I have had courteous disagreements with Werner Brozak, which is the nature of scientific discussion amongst professionals. I do not recall him informing me that the “red line” was incorrect or on what grounds, but even if he had, so what?
Stealey’s proposition that because one scientist disagrees with another, one should be considered to have been definitively “corrected”, withdraw or be considered dishonest is anitscientific hogwash. Why not say that Werner should shut up or be branded a liar even if he did disagree with me on this point (which I do not believe he did).