Date: March 4, 2013
Subject: Upcoming NCADAC Climate Assessment Report
From: Bob Tisdale – Climate Observations
To: Lead Authors of NCADAC Report
Dear Lead Authors:
The draft of your upcoming NCADAC Climate Assessment Report was recently released for comment. Thank you for the time, effort and taxpayer dollars you’ve expended preparing that document. Unfortunately, in many parts, it appears simply to be a rehashing of your previous reports. And it contains numerous problems and inconsistencies.
MODEL-BASED SPECULATION IS CONTRADICTED BY DECADES OF DATA-BASED RESEARCH
In the late 1990s and early 2000s, NOAA created educational webpages that explained how weather patterns were linked to El Niños and La Niñas. They were supported by decades of data-based research, including Newell and Weare (1976) Factors Governing Tropospheric Mean Temperature, Angell (1981) Comparison of Variations in Atmospheric Quantities with Sea Surface Temperature Variations in the Equatorial Eastern Pacific, Pan and Oort (1983) Global Climate Variations Connected with Sea Surface Temperature Anomalies in the Eastern Equatorial Pacific Ocean for the 1958–73 Period, to name a few of the early ones. Now you’re suggesting changes in weather patterns in the United States are caused by increases in manmade greenhouse gases. That flip-flop in the attribution of weather patterns from Mother Nature to human-induced climate change occurred gradually over the past decade or so, and there are no bases from which to attribute weather patterns to manmade factors—other than speculation. Returning to data-based analysis, more recently, the summary of Higgins and Kousky (2012) Changes in Observed Daily Precipitation over the United States Between 1950-1979 and 1980-2009 includes:
The increases in daily (and multi-day) heavy precipitation events are associated with changes in the mean and frequency of occurrence of daily precipitation events during the more recent 30-year period. The difference patterns are strongly related to the ENSO cycle, and are consistent with the stronger El Niño events and weaker La Niña events during the more recent 30-year period.
And in case someone wants to speculate about the stronger El Niño events being tied to human induced global warming, the abstract of Ray and Giese (2012) Historical changes in El Niño and La Niña characteristics in an ocean reanalysis ends with:
Overall, there is no evidence that there are changes in the strength, frequency, duration, location or direction of propagation of El Niño and La Niña anomalies caused by global warming during the period from 1871 to 2008.
That’s pretty clear.
THE SUBSURFACE OCEAN PROCESSES THAT DRIVE MULTIDECADAL WEATHER PATTERNS ARE UNKNOWN
We listened to your pleas to congress in 2000 when you wanted funding for the ARGO program—when the testimony of the climate science community included:
While we have in place a system for monitoring El Nino, we have no such ability to observe the motions of thermal anomalies in the mid- and high latitude oceans. Nor do we monitor the salt content of ocean currents, to determine the potential for deep convection or to help understand the vast water cycle over the oceans.
The ARGO floats have now been in place for less than a decade. Through them, we’ve had sporadically accurate subsurface ocean temperature and salinity data—for less than ten years.
Further to this, less than a decade ago, McCabe et al (2004) used sea surface temperature-based data since 1900 (not subsurface data based on ARGO floats) to determine the impacts of North Atlantic and North Pacific ocean-climate phases on drought in the United States. Those oceanic-climate processes portray themselves at the surface as sea surface temperature phenomena called the Atlantic Multidecadal Oscillation and Pacific Decadal Oscillation, and as their names imply they take multiple decades to run through their “phases”. While we may have sufficient sea surface temperature data to determine the relationship between multidecadal variations in the patterns of sea surface temperature and the resulting tendencies in weather patterns in the United States, we only have 10 years of often-adjusted ARGO-based subsurface ocean temperature and salinity data from which to hope to determine the causes of those multidecadal (50 to 80 year) oceanic-climate processes and to predict their changes.
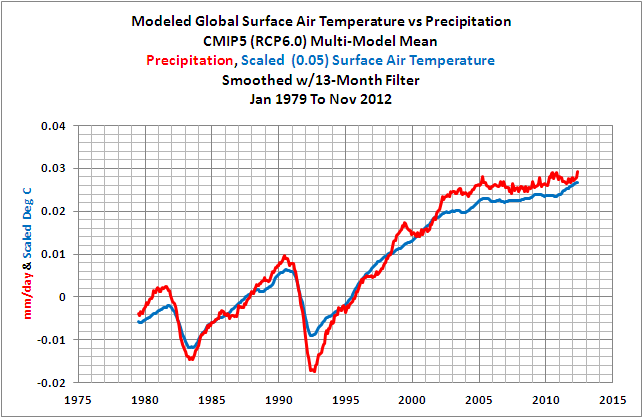
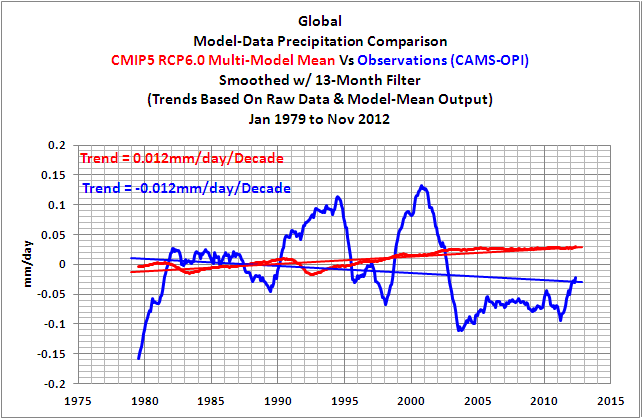
Because there is insufficient subsurface data, there continue to be conflicting climate studies about the causes of multidecadal variability. For example, Booth et al (2012)—a climate model-based study—claimed in their abstract that a “…state-of-the-art Earth system climate model…” was used “…to show that aerosol emissions and periods of volcanic activity explain 76 per cent of the simulated multidecadal variance in detrended 1860–2005 North Atlantic sea surface temperatures.” Zhang et al (2013), on the other hand, utilized the limited data that is available to dispute those claims. Apparently a “state-of-the-art Earth system climate model” is still inadequate for attribution studies. Do we know what causes the multidecadal variations in North Atlantic sea surface temperatures based on computers models and on very limited data? The realistic answer is no. Further, the climate models prepared for the IPCC’s upcoming 5th Assessment Report indicate global precipitation since 1979 should be increasing along with global temperatures, but satellite- and rain gage-based precipitation data from NOAA show that global precipitation has declined over that period. (Those graphs are from this post.) Nevertheless, you continue to present computer-based speculation to us about the causes of regional flooding and drought.
In the late 1990s and early 2000s, we read PBS’s wonderfully written series of articles about El Niño, which included a FAQ discussion prepared by a NOAA oceanographer. In response to the question Why can’t I find any information about links between El Niño and global warming? the author replied (my boldface):
Some say that the string of warm El Niño events during the 1990s are evidence that a general warming trend is starting to change the weather; others say that these variations are within normal limits. The fact is we have only a few events to talk about, which means there is no statistical rigor to any argument for or against this idea. It is simply shooting the breeze. We won’t have good statistics about El Niño for another hundred years or so (perhaps even longer if it is truly chaotic), so I don’t bother with such arguments at all.
Looks like you’re still “shooting the breeze” with your upcoming report. Much of the data for El Niño- and La Niña-related research comes from the NOAA TAO Project. Those buoys have been fully in place for almost 2 decades now—not one hundred years. Yet somehow, without sufficient data to provide “good statistics about El Niño” we’re continuously being bombarded with fairytales about human-induced extreme weather—weather that’s unremarkable because it’s been comparable or worse in the past.
YOU CONTINUE TO MISREPRESENT THE IMPACTS OF EL NIÑO AND LA NIÑA
Your draft report (147MB) misrepresents the impacts of El Niño and La Niña events on global surface temperatures. The “Appendix: The Science of Climate Change” begins on page 1117. You started on the right foot with the title of one of the “Key Messages” of that appendix, which is:
3. Natural variability, including El Niño events and other recurring patterns of ocean-atmosphere interactions, influences global and regional temperature and precipitation over timescales ranging from months up to a decade or more.
That statement is very true, and it’s supported by data. Strong El Niño events can cause naturally fueled upward shifts in sea surface temperatures for about 67% of the surface area of the global oceans, and those upward shifts do last for a decade or more. But then in the text of that section (page 1134) you contradict yourselves and elect to misrepresent the impacts of La Niña and El Niño events on global surface temperatures. You write:
Natural variability such as ENSO can also affect global temperatures. In general, El Niño years tend to be warmer than average and La Niña, cooler. The strongest El Niño event recorded over the last hundred years occurred in 1998. Superimposed on the long-term increase in global temperatures due to human activities, this event caused record high global temperatures. After 1998, the El Niño event subsided, resulting in a nearly flat overall trend for the decade 1998-2007.
In effect, you’re prolonging the myth that La Niña and El Niño events simply add noise to the global surface temperature record—that they add only annual variations in temperature on top of the manmade global warming signal. And your Figure 12 (Page 1136) and your Figure 13 (Page 1137) help to visually confirm your misrepresentations of La Niña and El Niño.
The NOAA/NCDC Optimum Interpolation Sea Surface Temperature dataset (the best sea surface temperature dataset available) and the NOAA/NODC Ocean Heat Content data (the only ocean heat content dataset available on a gridded basis through the KNMI Climate Explorer) clearly show that La Niña and El Niño events act as a naturally fueled recharge-discharge oscillator. For example, let’s look at the recharge and discharge associated with the 1995/96 La Niña and the 1997/98 El Niño and their aftereffects:
1. Through stronger-than-normal trade winds and the resulting decrease in cloud cover, La Niñas permit more sunlight to warm the tropical Pacific. This allows La Niñas to act as the recharge mode for ocean heat content in the tropical Pacific (the source of fuel for El Niños). The period highlighted in red in the attached link captures the impact of the 1995/96 La Niña on ocean heat content for the tropical Pacific. It provided the fuel for the 1997/98 El Niño, which shows itself as the significant subsequent drop. The 1995/96 La Niña also shifted up ocean heat content in the tropical Pacific with the aid of the recharge from the 1998-01 La Niña.
2. McPhaden 1999 may be the only scientific paper that made an effort to explain the source of the warm water—the fuel—for the 1997/98 super El Niño. McPhaden wrote:
For at least a year before the onset of the 1997–98 El Niño, there was a buildup of heat content in the western equatorial Pacific due to stronger than normal trade winds associated with a weak La Niña in 1995–96.
To confirm the opening sentence of “1.” above, a graph of surface downward shortwave radiation (penetrating solar radiation) and downward longwave radiation (infrared radiation) anomalies for the western equatorial Pacific indicates sunlight increased 25 watts per square meter during the 1995/96 La Niña, while infrared radiation decreased.
3. El Niños act as the discharge mode. The 1997/98 El Niño released a monstrously large volume of naturally created warm water from below the surface of the west Pacific Warm Pool. That warm water sloshed briefly into the East Pacific (90S-90N, 180-80W) where it temporarily warmed sea surface temperatures more than 0.5 deg C. (Note that the sea surface temperatures of the East Pacific haven’t warmed in 31 years.) Then it sloshed back to the west and was redistributed by ocean currents, warming the sea surface temperatures of the Atlantic, Indian and West Pacific Oceans (90S-90N, 80W-180) about 0.19 deg C. And the sea surface temperatures remained at that level until the 2009/10 El Niño, which bumped sea surface temperatures up a little more.
Looking back a few decades, the 1973/74/75/76 La Niña also shifted up the ocean heat content of the tropical Pacific. That La Niña provided the initial fuel for the series of El Niño events through to the mid-1990s. The sea surface temperature records indicate the 1986/87/88 released enough naturally created warm water to raise the sea surface temperatures of the Atlantic, Indian and West Pacific Oceans by about 0.09 deg C. Sea surface temperatures remained there, with the dip and rebound from the eruption of Mount Pinatubo, until the 1997/98 El Niño.
Anyone who can read a graph can understand that Mother Nature played the primary role in the warming of global sea surface temperatures over the past 30 years, assuming they want to understand. In fact, it’s difficult, if not impossible, to find a human-induced global warming signal in satellite-era sea surface temperature data. The sea surface temperatures of the East Pacific Ocean haven’t warmed in 31 years. But let’s confirm a few other things: Without the 1986/87/88, the 1997/98 and the 2009/10 El Niño events, sea surface temperatures for the Atlantic, Indian and West Pacific Oceans would not have warmed. Removing the impacts of the additional warming of the North Atlantic illustrates something more remarkable. Without the 1986/87/88, the 1997/98 and the 2009/10 El Niñoevents, sea surface temperatures for the South Atlantic, Indian and West Pacific Oceans would have cooled over the past 31 years. Similarly, without the 1973/74/75/76 La Niña and the 1995/96 La Niña, which provided the fuel for those El Niño events, there would be a long-term cooling of the ocean heat content of the tropical Pacific. For more information, see my essay “The Manmade Global Warming Challenge”.
Additionally, the sea surface temperatures for the entire Pacific Ocean (60S-65N, 120E-80W) have not warmed in 19+ years (see here), and the sea surface temperatures of the East Pacific Ocean from pole to pole (90S-90N, 180-80W) have not warmed in 31+ years. I first presented the East Pacific sea surface temperature data in a March 2011 blog post. I followed it a month later with a post titled How Can Things So Obvious Be Overlooked by the Climate Science Community? One might have expected climate scientists to have found this long before I did, yet there are no climate model-based studies that explain why the largest body of water on this ocean-covered planet is not warming in response to anthropogenic greenhouse gases. Why aren’t there any studies? The obvious answer: the climate science community would then have to acknowledge the failings of its hypotheses and models.
I understand the ClimateGate emails are a sore subject with the climate science community, but a quote from one seems appropriate here. It’s a statement in Kevin Trenberth’s October 14, 2009 email to Michael Mann, which was, I believe, a follow-up to the “travesty” email. Trenberth wrote:
Where did the heat go? We know there is a build up of ocean heat prior to El Nino, and a discharge (and sfc T warming) during late stages of El Nino, but is the observing system sufficient to track it?
The observing system may not be sufficient to track the heat, but the aftereffects of the naturally created heat, in the form of warm water released to the surface by El Niños, are hiding in plain sight. They are blatantly obvious in the upward shifts in the sea surface temperature anomalies of the Atlantic, Indian and West Pacific Oceans, resulting from the 1986/87/88, the 1997/98 and the 2009/10 El Niño events.
CLIMATE MODELS SHOW NO SKILL
Your U.S. Global Climate Change Research Program webpage states in the second paragraph that NCADAC “…is supported through the National Oceanic and Atmospheric Administration (NOAA).” Now consider this: as discussed and illustrated above, NOAA’s sea surface temperature and ocean heat content data indicate the oceans warmed naturally. That is, those two NOAA datasets do not support human-induced climate change. This contradicts the next section in your appendix, which starts on page 1139. The self-explanatory title for that section reads:
Key Message 4. Human-induced increases in atmospheric levels of heat-trapping gases are the main cause of observed climate change over the past 50 years. The “fingerprints” of human-induced change also have been identified in many other aspects of the climate system, including changes in ocean heat content, precipitation, atmospheric moisture, and Arctic sea ice.
This claim is further discussed and illustrated in your document. The bases for it are climate models of course. At the top of page 1140, you write:
Climate simulations are used to test hypotheses regarding the causes of observed changes. First, simulations that include changes in both external natural and human drivers that may cause climate changes, such as increases in heat-trapping gases and changes in energy from the Sun, are used to characterize what effect those factors would have had. Then, simulations with no changes in external drivers, only changes in natural variability, are used to characterize what would be expected from normal internal variations in the climate.
You then used your Figure 16 (Page 1141) to reinforce that. The title of the illustration reads “Only Human Influence Can Explain Recent Warming”. That’s incorrect. Only human influence can explain the recent warming in climate models, but we know that climate models are imperfect statistical representations of the Earth’s coupled ocean-atmosphere processes.
Let me expand on that: There’s a very obvious flaw in your logic or you’re attempting to mislead policymakers and the public—I’m not sure which. Essentially, you’re representing that climate models properly simulate “normal internal variations in the climate”. But it’s well known they don’t. We’ve already discussed two recent conflicting papers about the multidecadal variations in North Atlantic sea surface temperatures, with data contradicting models. Climate models also cannot simulate El Niño and La Niña—more on those failings later. If climate models were capable of modeling internal variability, they would have been able to simulate the naturally occurring and naturally fueled recharge-discharge processes of La Niña and El Niño. As discussed and illustrated earlier, those naturally fueled La Niña events are responsible for the warming of ocean heat content in the tropical Pacific, and it’s that naturally created warm water that supplied the warm water for the strong El Niños, which caused sea surface temperatures to warm in apparent steps. Without that natural warming of the oceans, there would be little warming of land surface air temperatures.
Additionally, climate models show no skill simulating the past:
1. Climate models can’t simulate observed satellite-era sea surface temperatures.
4. Climate models cannot simulate global surface temperatures since 1900, when the data and model outputs are broken down into the two warming periods and the two flat (slightly cooling) periods, as illustrated in the posts here and here.
MORE NOTES ON CLIMATE MODEL FAILINGS
Another bit of misdirection can be found in your Question and Answer section, which starts on page 1057. The first question is:
How can we predict what climate will be like in 100 years if we can’t even predict the weather next week?
After a few introductory paragraphs, your answer reads (my boldface):
Climate is how the atmosphere behaves over relatively long periods of time, usually taken as the statistics of weather over time scales of 30 years or more. Climate is primarily the result of the local effects of geographic location (for example, whether you live in the mountains or near the ocean) combined with large-scale climate factors, including the energy received from the sun and levels of heat-trapping gases in the atmosphere. “Climate change” refers to changes in the long-term averages and variations in weather.
We know how these have changed in the past and can successfully explain the climate change that has already occurred. Because we understand the physics of how the atmosphere works relatively well, we use the same approach to estimate how the climate will change in the future in response to a given increase in human emissions of heat-trapping gases, or natural changes such as variations in energy from the Sun.
Your statements that you “…can successfully explain the climate change that has already occurred”, and “…we understand the physics of how the atmosphere works relatively well…” are not supported by model-data comparisons. Your climate models indicate you can’t explain past climate change, and since you can’t, that suggests your understanding of the physics of how the atmosphere works is inadequate. There’s a very good reason for that. Your assumed knowledge of how the atmosphere works overlooks a critical part of atmospheric circulation, and it is, atmospheric circulation is coupled with the ocean circulation. The atmosphere and oceans are interdependent. And after multiple decades of modeling efforts, climate models still to this day cannot simulate coupled ocean-air processes, especially of the strongest naturally caused and naturally fueled events that impact climate on this planet: those events are commonly known as El Niño and La Nina.
Climate models stored in the Coupled Model Intercomparison Project phases 3 & 5 (CMIP3 and CMIP5) archives are being used to project future climate for your upcoming report. Are they able to predict shifts from El Niño to La Niña dominance or skewness? The answer is no. Coupled ocean-atmosphere climate models have existed for a couple of decades, but they still cannot simulate El Niño and La Niña. Guilyardi et al (2009) cited more than 100 papers in their discussions of climate model failings when those models attempted to simulate El Niño and La Niña processes. The authors of Guilyardi et al (2009) were so disappointed with climate model performance they stated:
Because ENSO is the dominant mode of climate variability at interannual time scales, the lack of consistency in the model predictions of the response of ENSO to global warming currently limits our confidence in using these predictions to address adaptive societal concerns, such as regional impacts or extremes (Joseph and Nigam 2006; Power et al. 2006).
Strong El Niño events release immeasurable amounts of naturally created heat into the atmosphere primarily through evaporation. They also release to the surface of the tropical Pacific vast amounts of naturally created warm water from beneath the ocean surface there, and ocean currents redistribute that warm water around the global oceans. The warm water released by a strong El Niño counteracts the cooling effects of the trailing La Niña. Logically, during multidecadal periods when El Niños dominate, global temperatures and ocean heat content warm. And during multidecadal periods when El Niño and La Niña events are more evenly matched, global surface temperatures and ocean heat content logically do not warm.
The climate science community uses the word skewness to describe the dominance of El Niño and La Niña over decadal and multidecadal periods. Smoothing the sea surface temperature anomalies of the NINO3.4 region (a commonly used index for the frequency, magnitude and duration of El Niños and La Niñas) with a 121-month filter indicates there are decadal and multidecadal variations in the skewness of El Niño and La Niña events. As noted earlier, climate models do not simulate the variations in the skewness of El Niño and La Niña. Guilyardi et al 2009 were quite clear about this, when they wrote:
Unlike observations, most GCMs exhibit a linear ENSO, with SST skewness near zero in the tropical Pacific (Hannachi et al. 2001; van Oldenborgh et al. 2005).
If climate models do not match the observed decadal and multidecadal variations of El Niño and La Niña dominance, it is impossible for them to determine the natural contribution of El Niño and La Niña to the long-term warming of global surface temperatures and ocean heat content.
The coupled ocean-atmosphere processes of El Niño and La Niña occur naturally, and their impacts on global weather and climate existed long before climate models. Their effects on regional weather around the globe have been studied in hundreds of scientific papers since the 1970s. But your climate model-based studies still focus on manmade greenhouse gases and other anthropogenic climate forcings—not on natural variability. The last I heard from an IPCC lead author regarding El Niño and La Niña simulations was:
…this is an area where there is a lot of research going on at the moment.
Sounds like the priorities for your modeling efforts were ill founded in the past. Simulating natural ocean processes and their impacts should have been the initial area of study, not the last.
CLIMATE MODELS CANNOT BE USED IN ATTRIBUTION STUDIES
That brings us to another discussion of attribution. Droughts and floods, heat waves and cold spells are byproducts of the oceanic processes called El Niño-Southern Oscillation, Pacific Decadal Oscillation, Atlantic Multidecadal Oscillation—along with variations in sea level pressure: North Atlantic Oscillation, Arctic Oscillation, Pacific/North American (PNA) Pattern, etc. (See the presentation Flavors of Climate variability: El Nino, La Niña, Recurring Jet Stream patterns, Multi-Decadal Variability.) Can your climate models predict with any certainty the impacts on regional weather of the annual, multiyear and decadal variations in ocean phases and atmospheric circulation patterns? One would have to assume they cannot be used for prediction, because they cannot be used to diagnose the causes of regional weather events.
We know climate models could not be used to diagnose the causes of individual weather events such as the 2010 Russian heat wave and other weather-related happenings that year. Trenberth and Fasullo (2012), both of NCAR, were quite clear about that when they stated in their abstract:
Attribution is limited by shortcomings in models in replicating monsoons, teleconnections and blocking.
Trenberth and Fasullo (2012) were more precise when they stated:
Central to the analysis here is the question as to whether models are capable of depicting the modes of variability associated with the extremes generally. Our analyses suggest that they are not.
And Trenberth and Fasullo (2012) were even more specific with:
A finding is that discerning the causal interactions between these events is a considerable challenge given the shortcomings of many models. A major difficulty is that climate models do not simulate monsoon rains well [Meehl et al., 2012], or tropical heating more generally, and the links to Europe and other regions are often poorly captured as a result. Many climate models cannot replicate the kinds of patterns seen in Figure 12 [see, e.g., Shin et al., 2010; Yang and DelSole, 2012]. Moreover, models are deficient in simulating blocking [Scaife et al., 2010]. We have examined several runs with the latest versions of the NCAR Community Atmospheric Model (CAM) versions 3, 4 and 5 run with specified SSTs for 2010.
QUICK NOTE ABOUT THE LACK OF OPENESS BY THE CLIMATE SCIENCE COMMUNITY
Human-induced global warming only exists in climate models, which cannot be used in attribution studies. In light of that, Trenberth and Fasullo (2012) attempted to blame those weather events on manmade global warming (my boldface):
Natural variability, especially ENSO, and global warming from human influences together resulted in very high sea surface temperatures (SSTs) in several places that played a vital role in subsequent developments.
Trenberth and Fasullo failed, however, to present that the sea surface temperature data show no warming for the last 19 years in the ocean basins encompassing the areas they studied. That illustration also shows the model-projected warming for the Indian and Pacific Oceans, from pole to pole. See the blog post here. It appears Trenberth and Fasullo based their understanding of global warming on climate models—not on data. This seems to be the case for many claims by the climate science community about global warming, including the upcoming NCADAC Climate Assessment Report.
OPENING PARAGRAPH OF EXECUTIVE SUMMARY
If you’d like the NCADAC to lose credibility, you’ll leave as is the opening paragraph of the Executive Summary to the upcoming Climate Assessment Report (my boldface):
Climate change is already affecting the American people. Certain types of weather events have become more frequent and/or intense, including heat waves, heavy downpours, and, in some regions, floods and droughts. Sea level is rising, oceans are becoming more acidic, and glaciers and arctic sea ice are melting. These changes are part of the pattern of global climate change, which is primarily driven by human activity.
As described earlier, NOAA’s ocean heat content data and their satellite-era sea surface temperature data both indicate the oceans have warmed naturally. Further, outside of volcanic eruptions and the annual seasonal cycles, El Niño and La Niña have the strongest impacts on climate. That’s been understood for decades. But as noted in Guilyardi et al (2009), climate models cannot simulate those El Niño and La Niña processes. Further, Trenberth and Fasullo (2012) highlighted many of the other failings of climate models with respect to natural weather phenomena, many of which are linked to El Niño and La Niña. Decades of data-based analyses attribute changes in rainfall patterns in the U.S. to ENSO and other sea surface temperature-based modes of variability. Yet you, the authors of the upcoming NCADAC Climate Assessment Report, have stated in the opening of your Executive Summary that:
These changes are part of the pattern of global climate change, which is primarily driven by human activity.
Reasonable persons will wonder how you could have divined that with the known faults and limitations of climate models. Additionally, unfounded statements like that at the beginning of a document will also cause those reasonable persons to dismiss the entire report.
DATA CONTRADICTS ALARMISM
People have memories. We can remember storms of the past that were as powerful if not more furious than those we are experiencing today. We also have internet access to data. We can, as Roger Pielke, Jr. has done, examine the data and refute baseless claims. In a recent post, Roger presented:
§ US floods have not increased over a century or longer (same globally).
§ US hurricane landfall frequency or intensity have not increased (in US for over a century or longer).
§ US intense hurricane landfalls are currently in the longest drought (7 years+) ever documented.
§ US tornadoes, especially the strongest ones, have not increased since at least 1950.
§ US drought has decreased since the middle of the past century.
§ US East Cost Winter Storms show no trends (here also).
§ Disaster losses normalized for societal changes show no residual trends (US, other regions or globally).
§ Trends in the costs of disasters are not a proxy for trends in climate phenomena.
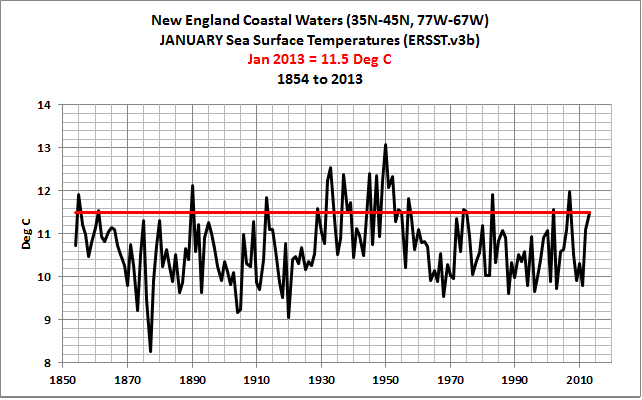
The intensity of Hurricane Sandy and the recent New England Blizzard were blamed on the human-induced warming of the sea surface temperatures of their North Atlantic storm tracks. Of course, those claims are contradicted by data. The sea surface temperatures of the extratropical portion of Sandy’s track have cooled since 1938. I started that analysis in 1938 because it was the year of the Great New England Hurricane. The cooling since 1938 was due to a downward shift in the 1960s. Refer to the post here. Similarly, the sea surface temperatures of the North Atlantic along the 2013 blizzard’s track were warmer in the 1930s, 1940s and early-1950s. That was discussed in the post here.
ADDITIONAL COMMENTS
Are you aware that there are numerous peer-reviewed papers that indicate short-term regional predictions from climate models have limited value? For examples, see Roger Pielke, Sr.’s blog posts here and here. The reason I ask, the exaggerated confidences you express in this report suggest you only read papers that confirm your beliefs.
Your upcoming report will of course serve as fodder for continued debate in climate change blogs. I’ll be happy to repeat my message that NOAA’s ocean heat content data and their satellite-era sea surface temperature data do not support the hypothesis of manmade global warming—that is, both of those datasets indicate the oceans warmed naturally. Again, see my essay “The Manmade Global Warming Challenge”. And I’ll continue to sell more copies of my ebook Who Turned on the Heat?
CLOSING
It’s likely there are portions of your report that are very good. I’ve only read a few sections, and I obviously found them lacking. Consider a few new tacks. End the alarmism. It detracts from your message. With the internet, we, in effect, have very long memories and can find evidence to refute the unfounded claims you insist on making. Also, you need to end the unsupported allegations that emissions of greenhouse gases are responsible for the warming we’ve experienced. It’s computer-based speculation—nothing more, nothing less—and it’s based on climate models that cannot properly simulate natural variability. And to counter those allegations of human-induced global warming, satellite-era sea surface temperature data and ocean heat content data indicate the oceans warmed naturally. Unfortunately you’d need to present to those funding your research the reasons for your change in tack—that climate science is still in its infancy, that climate models still cannot be used for attribution purposes. It’s quite likely those parties won’t be happy to learn that the instrument temperature record contradicts what you’ve been telling them for so long.
Sincerely,
Bob Tisdale
You were doing great until
“In effect, you’re prolonging the myth that La Niña and El Niño events simply add noise to the global surface temperature record—that they add only annual variations in temperature on top of the manmade global warming signal. And your Figure 12 (Page 1136) and your Figure 13 (Page 1137) help to visually confirm your misrepresentations of La Niña and El Niño.”
You really need to drop your theory that El Niño events cause a permanent departure of SST from equilibrium. It is simply unphysical and will cause the knowledgeable reader to ignore the rest of your letter.
Attaboy Bob. Well said.
wow! Thanks Bob for a very clear explanation of where they’re going wrong.
SteveT
Bravo!, Bob…
It used to be-”Lies,- damn Lies,- Statistics.
Now-
Lies,- damn Lies,- Climate Science.
Mr. Tisdale is a scientist.
The question is, can he continue to bear the burden of the profession?
There are so few actual scientists left the load must be staggering.
Wow! Good work. I do not hold out much hope that your message will be read by AGW advocates, let alone absorbed. Neverthelless, I congratulate you on your keen observation skills, and your ability to assimilate huge amounts of data into a unified concept. That surely constitutes scientific progress. Also a big thank you to WUWT, which has changed the dynamics of scientific communications.
Simply… awesome!
Bob
My first read through (which did not do the thoroughness of this post justice) suggests that it is an excellent piece of comment. I need to spend sometime rereading and viewing the linked data.
As you are an expert in oceans, I wonder whether you can point me in the right direction. I am interested in the vertical (not lateral) rate of nocturnal, diurnal ocean overtrning. How quickly in a vertical compoent does the ocean mix the top surface layer with say the 10 metre layer. Further, can the very top microns of the ocean actually be over turned by what is in effect a quasi mechanical circulating current?.
I recall seeing some research some time ago (I think by James Ledwell) which was dealing more with abyssal and meridional circulation where some SF6 tracer was used to mark water in the Atlantic, below the thermocline, I think at a depth of about 300 metres, I recall that the upshot of the innvestigation/research was that they marked, below the thermocline, with tracer a vertical spread of some 20 metres and after about 6 months the spread had expanded laterally hundreds of kilometres but in the same time had expanded vertically from 20 metres only to about 55 metres. They assessed that the vertical component was an exchange of no more than about 0.11cbm per sec, which was only about 10% of the rate previously assumed.
If you know of any more up to date research in this area, I would very much appreciate a heads up. Thanks.
pochas says: “You really need to drop your theory that El Niño events cause a permanent departure of SST from equilibrium. It is simply unphysical and will cause the knowledgeable reader to ignore the rest of your letter.”
Ah, I don’t believe I’ve had the pleasure before today.
First, I don’t present theories, I present data.
Second, thank you for confirming your limited grasp of the topic and/or your inability to read and comprehend time-series graphs, pochas. Sea surface temperature and ocean heat content records do a wonderful job of indicating how and why they’re warmed. The coupled ocean-atmosphere processes that caused that warming go by the name of ENSO. In addition to sea surface temperature and ocean heat content data, my understandings of the processes of ENSO are confirmed and supported by ocean current data, downward shortwave radiation data, downward longwave radiation data, cloud amount data, depth-averaged temperature data, warm water volume data, thermocline depth data, trade wind strength and direction data, sea level data, lower troposphere temperature data, combined land plus sea surface temperature data, etc.
When you’ve studied the topic and gained a sufficient background so that you can discuss the matter intelligently, I’ll be happy to chat. Until that time, adios.
richard verney: I’ve never seen the data you’re looking for–but I also haven’t been looking for it. Sorry.
John Marshall says
It used to be-”Lies,- damn Lies,- Statistics.
Henry says
The stats were always right.
It has been cooling for the past 12 years
here are my own stats
http://blogs.24.com/henryp/2013/02/21/henrys-pool-tables-on-global-warmingcooling/
here are everyone’s else stats
http://www.woodfortrees.org/plot/hadcrut4gl/from:2002/to:2013/plot/hadcrut4gl/from:2002/to:2013/trend/plot/hadcrut3vgl/from:2002/to:2013/plot/hadcrut3vgl/from:2002/to:2013/trend/plot/rss/from:2002/to:2013/plot/rss/from:2002/to:2013/trend/plot/gistemp/from:2002/to:2013/plot/gistemp/from:2002/to:2013/trend/plot/hadsst2gl/from:2002/to:2013/plot/hadsst2gl/from:2002/to:2013/trend
it is getting cooler by just about everyone’s account. Just learn to live with it.
It is going to get cooler still…
http://blogs.24.com/henryp/2012/10/02/best-sine-wave-fit-for-the-drop-in-global-maximum-temperatures/
Bob, thank you for your continued focus on the oceans, and thanks to Anthony as well for providing the medium.
I think you used “bases” instead of “basis”, spell check won’t catch that.
Bob, love your posts, but flogging your book on every post is a bit tiresome.
I know, it’s your right to do so, but, to me, the whole post comes off as you trying to sell something instead of presenting science.
Just my two cents. Please take it as constructive, not destructive.
Steve Keohane: I believe I’ve got the singular (basis) and plural (bases) in the right places.
Thanks for the kind words. Regards.
In their introduction, NCADAC talk about
Climate change is already affecting the American people
Certain types of weather events have become more frequent and/or intense, including heat waves, heavy downpours, and, in some regions, floods and droughts.”
Strange, because the USGS have specifically said
Only one of four large regions of the United States showed a significant relationship between carbon dioxide (CO2) in the atmosphere and the size of floods over the last 100 years. This was in the southwestern region, where floods have become smaller as CO2 has increased.
They go on
“Currently we do not see a clear pattern that enables us to understand how climate change will alter flood conditions in the future
It appears NCADAC aren’t too interested in facts.
http://notalotofpeopleknowthat.wordpress.com/2013/02/06/federal-advisory-committee-draft-climate-assessment-report/
Paul Humewood says
http://wattsupwiththat.com/2013/03/04/blog-memo-to-lead-authors-of-ncadac-climate-assessment-report/#comment-1238295
Henry says
acc.to my records Alaska is going to get a lot colder yet…
http://blogs.24.com/henryp/2013/02/21/henrys-pool-tables-on-global-warmingcooling/
sorry.
I would pack my bags if I were living there…
The problem: One set of AGW proponents need El Nino to get warmer while another set needs it to be cyclic with a net zero contribution to temperatures. It’s amazing to see. It’s like hurricane explanations: AGW explains all.
Observable: One year has higher hurricanes than average.
AGW Explanation: “Increasing SST’s due to AGW cause more energy to be available to hurricanes making them more frequent.
Observable: One year has lower hurricanes than average.
AGW Explanation: Jetstream is lower over North Atlantic ridge due AGW induced polar warming. Increased wind shear stops tropical cyclones from forming.
No matter what you observe, there is a scientific explanation that can quickly receive peer review and publication.
Absolutely brilliant, Mr. Tisdale, including your response to pochas. It appears that NCADAC has become a propaganda agency. Thanks so much for setting them straight and for standing in the gap for science. (Everyone should buy multiple copies of Mr. Tisdale’s book.) (NCADAC should actually read the copy they have.)
Thanks, Bob. Superb article!
Bob, this is wonderfully done. I should imagine that at least some of the lead authors you wrote to are aware of the turning of the tide (if you’ll pardon the pun) and therefore will sit up and take notice. If not, well, they were going to the wall anyway and there’s nothing you can do about that. Some people will keep the blinkers on until the end.
Just an aside and in reply to another comment – I have no problem with you “pushing your book”. The information you present is important and when an article like this grabs someone’s attention, it’s fitting that they have an immediate link to further information.
You put a tremendous amount of time and effort into what you write and I do think it’s permeating the thoughts and minds of some who might never openly admit it. Many climate scientist know their claims are shaky. Some are smart enough to know they should start thinking about an escape route about now. Others might not really know and might not want to look too closely, in which case they’ll still have the sense of not doing their job properly.
A good dose of data and a multitude of backup links showing the tide of information that contradicts their claims might be just the thing to wake them up. I hope so. People might toe the party line and certainly they want to protect their funding, but that doesn’t stop that deep down sick feeling knowing that what they claim is being used to take down civilization (at the very least our economy). They are selling out humanity and know it. Their lie – whether it be big or little – will follow them to their grave unless they turn around now and do the right thing.
Thank you for all your work and for nudging them in the right direction. Cheers.
Great stuff Mr. Tisdale
Re: Pochas
Everything after your 2nd sentence was overkill :), but enjoyed.
Fixed a typo: vaiarions. Thanks to blogger John (in Oz) at the cross post at my blog.
Thanks for another great posting from Bob Tisdale. I liked the attention given to the ocean effects and heat content, Thanks Anthony for bringing this useful information to us.
Bob,
I just explained ENSO to my college aged daughter. Thanks for all the work. Just to get ahead of the normal waterfall of dumb questions…
Read what the man says before you tell him that ENSO cannot heat the ocean! Keywords to look for: Clouds, sun.
(I get tired of reading them, figure you must be really tired of answering them)
Eric
Message for Bob:
Is “Who turned on the heat?” available in Kindle format yet? If not are you planning on a Kindle version anytime soon?
Thanks
David Jojnes: Sorry, I still have no plans for a Kindle edition of “Who Turned on the Heat?” Due to its size (54mb in that format, if memory serves), the Kindle version would be whole lot more expensive. And then I’d also have to increase the price of the pdf version. If sales increase a lot, I may consider it.
Thanks Bob, keep after ’em, for they can not get away with claiming ignorance again.
Bob, Very well done. Thanks.
You address this to “Lead Authors” — who wrote all this stuff?
The Federal Advisory Committee is reported to be a 60-person group:
http://ncadac.globalchange.gov/
. . . with a link to member names here:
http://globalchange.gov/what-we-do/assessment/ncadac
There are university names here but one would have to look at other sources to find out what they really do. Others are consultants, advocacy groups, and a few unidentifiable from info given. Keep digging:
http://downloads.usgcrp.gov/NCA/people/NCA-2013-CLA-and-LA-List_05-02-2012.pdf
A lot of names are here, many known to skeptics as biased toward the “cause” or their own agenda. I do not believe this report is about science. I think to understand what has been put in the draft there needs to be someone to put as much effort into providing a picture of these folks based on “follow the money” and self interest.
@Bob Tisdale: I love this post… and read your book. It’s music to my ears.
You may have meant 2012 in this sentence, where you wrote 2013:
“the sea surface temperatures of the North Atlantic along the 2013 blizzard’s track were warmer in the 1930s, 1940s and early-1950s. “
@Bob Tisdale: I love this post… and read your book. It’s music to my ears.
You may have meant 2012 in this sentence quote below, where you wrote 2013:
“the sea surface temperatures of the North Atlantic along the 2013 blizzard’s track were warmer in the 1930s, 1940s and early-1950s.”
pochas says: “You really need to drop your theory that El Niño events cause a permanent departure of SST from equilibrium. It is simply unphysical and will cause the knowledgeable reader to ignore the rest of your letter.”
Pochas: Where you do get off making such a statement? Certainly, you consider yourself knowledgable… But you’ve just let everyone here know you are not.
As a process engineer, I found his explanations on where the heat comes from clear… and as a process engineer, I fully appreciate that all, every single one of Bob’s claims comes from observations which can be substanciated by anyone since he provides a clear path towards enlightenment that even you could understand. Read his book, and repent. It’s a really small price to pay if you actually want to have some knowledge on the subject. I will even provide you with a link… you can read the summary and if you so choose, purchase the book. Which is a gift less costly than a mocha latte…
http://bobtisdale.wordpress.com/2012/09/03/everything-you-every-wanted-to-know-about-el-nino-and-la-nina-2/
Just read your essay again after a break of 36 hours. It is a brilliant essay. It demands a point by point response from NCADAC. Thanks for the extended references to some hot off the press essays, such as Trenberth and Fasullo (2012). You are providing an ongoing education about ENSO and sea surface temperatures to everyone willing to study your work.
Mario Lento: Glad you enjoyed the book. Regarding the blizzard, I was discussing the one a few weeks ago, so that would be 2013.
Regards
Thanks, Anthony. And thanks to all who read the post and commented.
Next week, I’ll try to get back to the ENSO FAQs.
Hi to every one, the contents present at this website are actually remarkable for people experience,
well, keep up the good work fellows.