Guest Post by Willis Eschenbach
In my last post, “Emergent Climate Phenomena“, I gave a different paradigm for the climate. The current paradigm is that climate is a system in which temperature slavishly follows the changes in inputs. Under my paradigm, on the other hand, natural thermoregulatory systems constrain the temperature to vary within a narrow range. In the last century, for example, the temperature has varied only about ± 0.3°C, which is a temperature variation of only about a tenth of one percent. I hold that this astonishing stability, in a system whose temperature is controlled by something as fickle and variable as clouds and wind, is clear evidence that there is a strong thermostatic mechanism, or more accurately a host of interlocking thermostatic mechanisms, controlling the temperature.
 Figure 1. The behavior of flocks of birds and schools of fish are emergent phenomena.
However, this brings up a new question—although the change in temperature is quite small, with changes of only a few tenths of a percent per century, less than a degree, sometimes the global average temperature has been rising, and sometimes falling.
So what are some of the things that might be causing these slow, century or millennia long drifts in temperature? Is it changes in the sun? I think that the explanation lies elsewhere than the sun, and here’s why.
The temperature control system I describe above, based on the timing and duration of the onset and existence of emergent temperature phenomena, is temperature based. It is not based on the amount of forcing (downwelling solar and greenhouse radiation).
By that I mean that the control system starts to kick in when the local temperature rises above the critical level for cloud emergence. As a result, by and large the global average temperature of the planet is relatively indifferent to variations in the level of the forcing, whether from the sun, from CO2, from volcanoes, or any other reason. That’s why meteors and volcanoes have come and gone and the temperature just goes on. Remember that at the current temperature, the system variably rejects about a quarter of the available incoming solar energy through reflections off of clouds. We could be a whole lot hotter than we are now, and we’re not …
This means that the system is actively regulating the amount of incoming solar energy to maintain the temperature within bounds. It doesn’t disturb the control system that the solar forcing is constantly varying from a host of factors, from dust and volcanoes to 11 and 22 year solar cycles. The thermoregulation system is not based on how much energy there is available from the sun or from CO2. The resulting temperature is not based on the available forcing, we know there’s more than enough forcing available to fry us. It is set instead by the unchanging physics of wind and wave and pressure and most of all temperature that regulates when clouds form … so when the sun goes up a bit, the clouds go up a bit, and balance is maintained.
And this, in turn, is my explanation of why it is so difficult to find any strong, clear solar signal in the temperature records. Oh, you can find hints, and bits, a weak correlation to this or that, but overall those sun-climate correlations, which under the current paradigm should show visible effects, are very hard to find. I hold that this shows that in general, global average temperature is not a function of the forcing. The sun waxes and wanes, the volcanoes go off for centuries, meteors hit the earth … and the clouds simply adjust to return us to the same thermal level. And this weak dependence of output on input is exactly what we would expect in any significantly complex system.
So if the sun is not guilty of causing the slow drift in global average surface temperature over the centuries, what other possible defendants might we haul before the bar?
Well, the obvious suspects would include anything that affects the timing and duration of the onset and existence of clouds, or their albedo (color). Unfortunately, cloud formation is a complex and poorly understood process. Water droplets in clouds form around a “nucleus”, some kind of particle. This can be sea salt, dust, organic materials, aerosols, a variety of types and species of microorganisms, black carbon, there are a host of known participants with no clear evidence on how or why they vary, or what effects they have when they do vary. Here’s a quote from the abstract of a 2013 scientific paper, emphasis mine:
The composition and prevalence of microorganisms in the middle-to-upper troposphere (8–15 km altitude) and their role in aerosol-cloud-precipitation interactions represent important, unresolved questions for biological and atmospheric science. In particular, airborne microorganisms above the oceans remain essentially uncharacterized, as most work to date is restricted to samples taken near the Earth’s surface. SOURCE
Here’s another example:
Cumulus clouds result from the ascent of moist air parcels. An unresolved issue in cloud physics is why observed cumulus cloud droplet spectra even in the core of cumulus clouds are broader than the spectra predicted by cloud droplet nucleation and condensational growth in adiabatically ascending parcels (Pruppacher and Klett, 1997). SOURCE
Cumulus clouds are one of the most common types on earth and we don’t even understand cloud nucleation there. The problem is that the size and composition of atmospheric aerosols, and the complex interaction between those aerosols and the various organic and inorganic atmospheric chemicals, ions, free radicals, and natural and man-made particles, plus variations in the type and amount of microbial populations of the atmosphere, plus the ability of one chemical to adsorb onto and totally change the surface properties of another substance, all have the potential to affect both the timing and the duration of both cloud formation and precipitation, along with cloud optical properties. As such, they would have to be strong contenders for any century-scale (and perhaps shorter-scale) drifts in temperature.
Another possible cause for the slow drift might be the proposed cosmic ray connection, sun’s magnetic field –> cosmic ray variations –> changes in cloud nucleation rate. I see no theoretical reason it couldn’t work under existing laws of physics, I made a “cloud chamber” as a kid to see radioactivity come off of a watch. However, one difficulty with this cosmic ray connection is that the records have been combed pretty extensively for sun/climate links, and we haven’t found any strong correlations between the sun and climate. We see weak correlations, but nothing stands out. Doesn’t mean they don’t exist, but it may be indicative of their possible strength … or as always, indicative of our lack of knowledge …
Another cause might be the effect on thunderstorms of gradual changes in the earth’s electromagnetic fields. Thunderstorms have a huge (think lightning bolts) and extremely poorly understood electromagnetic complement. They serve an incredibly complex electromagnetic circuit that couples the atmosphere and the surface. It ties them together electromagnetically from the “sprites” that form when thunderstorms push high above the surrounding tropopause, and from there in various ways through dimly glimpsed channels the electromagnetic current runs down to and up from the ground. Thunderstorms also are independent natural electrical Van de Graaf machines, stripping electrons in one part of the thunderstorm, transporting them miles away, and reuniting them in a thunderous electrical arc. We have no idea what things like the gradual changes in the location of the Magnetic Poles and alterations in the magnetosphere or variations in the solar wind might do to the timing and duration of thunderstorms, so we have to include slow alterations in the global magnetic and electrical fields in the list of possibilities, perhaps only because we understand so little about them.
The next possibility for slow changes involves the idea of bifurcation points. Let me take the alteration between the two states of the Pacific Decadal Oscillation as an example. In each of the states of the PDO, we have a quasi-stable (for decades) configuration of ocean currents. At some point in time, for unclear reasons, that configuration of ocean currents changes, and is replaced by an entirely different quasi-stable (for decades) state. In other words, somewhere in there is a bifurcation point in the annual ebb and flow of the currents, and at some point in time, the currents take the path not recently travelled and as a result, the whole North Pacific shifts to the other state.
Now, even in theory one of these two state has to be more efficient than the other in the great work of the heat engine we call the climate. That great work is moving energy from the equator to the poles. And in fact there is a distinct difference, one of the two states is called the “warm” state and the other is called the “cool” state.
Intuitively, it would seem that IF for whatever reason the Pacific Decadal Oscillation stayed permanently in one state or the other, that the world would end up either warmer overall or cooler overall. Let me explain why I don’t think the PDO or the El Nino/La Nina or the North Atlantic Oscillations are responsible for slow drifts in the regulated temperature.
The reason is that just like the thunderstorms, all of those are emergent phenomena of the system. Take the PDO as an example. Looking at the Pacific Ocean, you’d never say “I bet the North Pacific stays warm for decade after decade, and then there’s a great shift, all of the sea life changes, the winds change, the very currents change, and then it will be cold for decade after decade”. No way you’d guess that, it’s emergent.
And because they are emergent systems, I hold that they too are a part of the interconnected thermal regulation system, which in my view includes short term emergent systems (daily thunderstorms), longer term (multi monthly Madden Julian oscillations), longer term (clouds cooling in summer and warming in winter), longer term (3-5 years El Nino/La Nina), and longer term (multidecadal PDO, AMO) emergent systems of all types all working to maintain a constant temperature, with many more uncounted.
And as a result, I would hold that none of those emergent systems would be a cause of slow drift. To the contrary, I would expect that they would work the other way, to counteract slow drift and prevent overheating.
Moving on, here’s an off-the-wall possibility for human induced change—oil on the global oceans. It only takes the thinnest, almost monomolecular layer of oil on water to change the surface tension, and we’ve added lots of it. This reduces evaporation in two ways. It reduces evaporation directly by reducing the amount of water in contact with the air.
The second way is by preventing the formation of breaking waves, spray, and spume (sea foam). Spray of any kind greatly increases the water surface available for evaporation, depending on windspeed. Remember that evaporation due to wind speed is the way that the thunderstorm is able to sustain itself. So when the amount of area evaporating is decreased by ten or twenty percent due to lack of spray, that will commensurately decrease the evaporation, and thus affect the timing of the onset and the duration of thunderstorms.
…
OK, you gotta love this. I thought “time for more research” after writing the last paragraph, and I find this:
Sailors who traditionally dumped barrels of oil into the sea to calm stormy waters may have been on to something, a new study suggests. The old practice reduces wind speeds in tropical hurricanes by damping ocean spray, according to a new mathematical “sandwich model”.
As hurricane winds kick up ocean waves, large water droplets become suspended in the air. This cloud of spray can be treated mathematically as a third fluid sandwiched between the air and sea. “Our calculations show that drops in the spray decrease turbulence and reduce friction, allowing for far greater wind speeds – sometimes eight times as much,” explains researcher Alexandre Chorin at the University of California at Berkeley, US.
He believes the findings shed light on an age-old sea ritual. “Ancient mariners poured oil on troubled waters – hence the expression – but it was never very clear what this accomplished,” says Chorin. Since oil inhibits the formation of drops, Chorin thinks the strategy would have increased the drag in the air and successfully decreased the intensity of the squalls.
Hmmm … good scientists, not such good sailors. As scientists, I’d say they only have part of the answer. They should also run a calculation on the increase of the evaporative area due to the spray, and then consider that the hurricane runs on evaporation. That’s why they die out over the land, no moisture. Cut down the spray, put oil on the water, cut down the evaporation, cut down the power of the storms. And just like you get sweatier and hotter if a muggy day prevents evaporation, the same is true of the ocean. If you cut down evaporation, it will get warmer.
Of course, the counter-argument to the oil-on-the-water cuts evaporation and warms the ocean hypothesis was World War II. It put more oil into all of the oceans of the world than at any time before or since, and during the war in general the world was quite cold … dang fact, they always get in the way.
Having said that, as a blue-water man I can assure you that the authors of that claim are not sailors. Sailors don’t dump oil in the water to lower the wind speed, that’s a landlubber fantasy. They do it because it prevents waves from breaking and drops and spray from forming, so it can help in rough conditions. It doesn’t take much, you’d be surprise at the effect it has. You soak a rag in motor oil and tow it a ways behind the boat when you are drifting downwind. If the Coast Guard catches you, you’ll get a ticket for causing a sheen on the water and rightly so, but if it saves your life once, it’s probably worth it. Heck, when you’re caught in a big offshore blow, if it just has a placebo effect and reduces your personal pucker factor, its probably worth it … but I digress.
One thing is clear, however. The climate has been on a slow drift up and down and up and down, warm in Roman times, cold in the Dark Ages, warm in the Middle Ages, cold in the Little Ice Age, warm now … so while humans may indeed play some part the post-1940’s drift (down, then up, now level), it’s likely not a big part or we would have seen it by now … and in any case if we did have an effect, we still don’t know how.
I want to close by noting the power of the paradigm. If the paradigm is that greenhouse gases are the likely reason for slow climate drift because you assert (curiously and incorrectly) that temperature slavishly follows forcing, then you will look for variations in all the things that affect those GHGs.
But once the paradigm shifts to describing the climate as composed of interlocking active thermoregulatory mechanisms, we find ourselves with a range of entirely different and credible candidates for slow drift that are untouched and uninvestigated. It may be something above, or something I haven’t even considered, the change in plankton affecting the clouds or something.
This is why the claim that we have identified the “major forcings” as being say CO2 and methane and such ring hollow. Those are only the major players within the current paradigm. The problem is, that paradigm cannot explain a system so tightly thermoregulated that over the last century, the global average surface temperature only varied by ± one tenth of a percent … engineers, please correct me if I’m wrong, but given volcanoes and aerosols and the like that is a record that any control systems engineer would be proud of, and it is done with things as ephemeral as clouds. To me, that fact alone proves that the earth has a thermostat, and a dang precise one for that matter. A truly wondrous and marvel-filled planet indeed.
In friendship and exploration of the aforesaid marvels,
w.
As always, Willis, you bring up interesting stuff to think about.
I liked the quote including the unknown factor of “airborne microorganisms above the oceans.”
Just suppose those critters are microorganisms that, in some way, respond to their environment in a way that alters their environment. If it gets too hot, they cool it, and if gets too cool, they warm it back up.
I could get grant money to study these possible microorganisms, if only I could figure out some way to blame mankind’s progress for reducing their population, and consequently altering the weather and dooming all life as we know it.
You have such skill as a writer, I was wondering if you would mind writing the grant proposal for me?
So if the sun is not guilty of causing the slow drift in global average surface temperature over the centuries, what other possible defendants might we haul before the bar?
==============
Life (microorganisms) evolved the ability to control the temperature of the earth within a narrow range to ensure life’s continued existence. If this were not true then life would have long ago gone extinct on earth from run-away cooling or warming, to be replaced eventually by organisms that could regulate the temperature.
This is really nothing surprising. 90% of the cells in a person’s body are not made up of the person’s DNA. Rather they are microorganisms that keep us alive. Without them we would not exist. Yet we barely recognize the role these microorganisms play.
The same is true for the oceans and the soils. Microorganisms rule the earth and control the climate through their evolved response to climate change. We like to believe we are the dominate life form. This is however an arrogant delusion. We are simply one of a long line of hosts.
I would love to know what a representative sample of climatologists would have to say about these musings. Willis suggests many potentially important, unexplored factors in climate. Would the climatologists agree on the “unexplored,” what about the “potentially important”?
The thing that strikes me is that ALL of us (and climatologists) know that it does not take much change in global cloud cover to have a pretty big impact on global temperatures. And, many of us (and many climatologists) will assert that current theory, data, and models do a fairly poor job explaining clouds…
The only thing I’ve heard is the belief that more CO2 leads to higher temps, leads to more evaporation (and clouds), and that the water vapor/ clouds mix this “forced” are a net positive feedback. Makes no real sense (wouldn’t temps “runaway” if that were true), but it’s the primary (if not only) way current AGW climatology seems to deal with water vapor/ clouds.
Mr. Eschenbach, thanks very much for your interesting ideas regarding thermoregulation. In living systems, biologists would call it homeostasis by negative feedabck. And thanks for explaing the use of oil by sailors in heavy weather. I sail and have read of the practice. Thanks again.
The oil layer on the water dampens waves because surface tension within the oil layer acts to against the waves – it is like an elastic band stretched over the water – you get the same effect with a plastic sheet.
In the case of the atmosphere we need look no further than water vapor: evaporation, condensation and convection of water is the great thermal stabilizer, distributing heat very efficiently and reducing extremes.
The Earth in a way is a kind of organism, it self-regulates, and will “look after itself”. If not, we would not even be here to write these words. Our very existence is proof that this is the case. Levels of all forcings have varied a great deal over geological time and yet life persists. This alone is enough. Even when you break down the ultimate question of life, the Universe, and everything, the answer is it exists because it does. If not, nothing could be. Therefore it is. The answer may as well be 42.
Climate science is enormously complex. It is not that the scientists themselves haven’t necessarily considered the points Willis raises. It is more that the mathematics does not even currently exist to deal with the complexities involved. Therefore no climate models can currently be accurate at any level. This does not mean that the scientific endeavour to further human understanding should cease. Climate scientists should be applauded for continuing the process as best they can with the current knowledge.
The problem in my opinion is not the science but the intrusion of politics. Climate scientists should not be in a position of advising governments at this stage, and I don’t believe it’s their fault that they are.
Power corrupts.
A heartfelt thank you for your all your writings on this blog Willis.
Old paradigms die hard, their adherents clinging grimly till the end while those who were not invested might nod and say “Yeah, I can see how they would have thought that but this new explanation makes so much more sense.”
Willis, I don’t know whether what you describe here will prove to be the next paradigm or just a plausible enough alternative that it convinces someone else to look in new places. But either way, you are doing a service to science and society. Cheers!
Fascinating stuff Willis. Very well observed that (as far as we can measure to date) that in the last century the global temperature has varied only about a tenth of one percent.
“…..and then consider that the hurricane runs on evaporation. That’s why they die out over the land, no moisture…..”
True enough …they always start over water and die quickly enough over land .. but a slight digression and a question … what do you think of the work of Anastassia Makarieva etal re the role of condensation in driving storms/cyclones/hurricanes/typhoons? To me it makes a lot of sense when you consider the escalating nature of such events… that there is more going on than just uprising/buoyancy as incoming air is both warmed and evaporates warm water. An added ‘draw’ from condensation seems logical (to me at least) but it seems that is quite controversial … and is discussed here on Judith Curry’s site:
http://judithcurry.com/2013/01/31/condensation-driven-winds-an-update-new-version/
Without severe disagreement, the Middle Ages theorem was that the price of grain varied by the number of sunspots. That seemed to be a pretty tight correlation. Today you would have to factor in motor fuel, but going back to then… Propose a control or regulatory mechanism with somewhat sinusoidal properties that does not involve the sun. Me thinks you can conjure one entirely consistent with the thunderstorm theory presented.
Net of everything, the sun matters.
Another thought provoking post Willis. Thank you. You add so much to the thinking and writing of your audience at WUWT, I wish there were some better way to acknowledge you and your contributions. All I know to say is thank you and please keep it up. All the best.
I went through diferent logic some time ago, and came up with ‘Climate change is caused by factors that affect the phase changes of water’. You don’t mention snow and ice, but particulates and aerosols affect their creation through precipitation and melting/sublimation.
The key question in the AGW debate is what caused the modern warm period that commenced after the Little Ice Age. I maintain that the likely culprit is reduced black and organic carbon emissions from charcoal production in Europe and fire stick practices in the rest of the world. Resulting in reduced cloud seeding.
Prior to the Industrial Revolution, charcoal production was a very large industry primarily to feed the many blacksmiths who required charcoal for their forges. That there were large of numbers of blacksmiths can be inferred from Smith being the commonest name in English and Schmidt the second commonest in German.
So, contrary to the widespread belief that black and organic carbon emissions increased with introduction of coal as the primary fuel for the Industrial Revolution, emissions in fact substantially decreased. Anyone who has seen charcoal made, as I have, knowns it produces huge amounts of smoke for about 3 days to produce a single batch of charcoal, and coal requires no such production process.
To support this theory, I looked for a cooling dip in the paleo record after the Black Death when Europe’s population reduced by a third and charcoal production would have reduced by a similar amount, but couldn’t find any evidence.
The post 1975 warming is largely the result of eliminating open hearth fires, catalytic converters, scrubbers and similar measures. Initially in the developed world and then spreading to the developing world, and the ex-Soviet Block after 1991.
When different people arrive at the same conclusion from different directions, its a good indication the conclusion is sound.
“… for example, the temperature has varied only about ± 0.3°C, which is a temperature variation of only about a tenth of one percent. I hold that this astonishing … ”
That’s funny. You switch to the Kelvin scale to get an astonishingly small number and are then astonished! Percent temperature change depends on the scale used and is meaningless as an measure of stability. What matters is what is the impact of a given temperature change on the ecological systems on which we depend. If that is low then the change is not important (to us) and if it is high it is, although it would be hard to reduce to just one number.
Bravo, Willis. My takeaway is that the Earth and Sun were formed at the same time and have co-evolved ever since. The human bacterium has virtually nothing to do with the larger scheme of solar system evoultion, so the best we can do is make ‘intelligent’ obsrvations about the ongoing process. We are spectators, not players.
A little disconcerting in that since you show pretty clearly that no one knows squat about how real climate systems function; we are very likely to be blindsided by the next big freeze event (which historically constitutes a high percentage of the last half million years of Earth’s climate).
And if anything like the Younger Dryas, the temperature changes could be very rapid.
Terry Jackson says:
February 8, 2013 at 9:36 pm
Thanks, Terry. An actual citation to such an actual correlation sunspots/grain prices would make your claim more than an anecdote. There are many alleged correlations, some of which run for decades, half a century … and then the stop, for the next half century there’s no correlation, then it starts again …
My point is that IF the current paradigm is true, if
$latex\frac{Temperature Variation}{Forcing Variation} = Constant$
then the 11-year variation in the sun should be much more visible than it is. But in fact such correlations as you speak of tend to be very weak and often disappear with a longer record.
So yes, the sun matters … just not much.
w.
As Edward Lorenz noted in 1960, over the long term Planet Earth may not have a “climate” at all. Regardless of total solar irradiation (TSI) and various global atmospheric factors, not climatological but geophysical influences are all-determining.
When all Earth’s landmasses clustered together in a super-continent called Pangaea centered on the South Pole for a billion years, pre-Cambrian ice ages dominated “snowball Earth” for a quarter of this world’s existence. Only when Pangaea fragmented, setting great chunks adrift to equatorial regions, did “climate” begin accumulating atmospheric oxygen sufficient to support land life– a “warming” process lasting several hundred million years which had precisely nothing to do with astro-solar cycles or intermittent exo-stellar influences.
For some time now, and probably for another 50 – 100 million years, North and South American continents have walled off atmospheric/oceanic circulation from Eastern vs. Western hemispheres, inducing the cyclically recurrent glaciations that characterize Earth’s current Pleistocene. Only when plate tectonic dispositions remove hemispheric barriers will periodic Ice Times end– and then only supposing that continental landmasses remain dispersed in temperate rather than Arctic or Antarctic zones.
Marc says:
February 8, 2013 at 10:11 pm
“Switch” to the Kelvin scale? Are you seriously proposing that we look at percentage variations using the Celsius scale?
There is one and only one temperature scale that is used for percentage change, the Kelvin scale. Truly, my friend, your grasp of numbers is weak.
No, what matters is that we learn to understand the climate system, and we won’t do that by going all Disney and Bambi on the question. The ecological changes are indeed important, but if we cannot understand the climate, that doesn’t matter.
Marc, you seem to believe that I am championing action, or that I’m in favor inaction, or something. I’m not. I’m trying to understand how the climate works, not guess what it might do if it doesn’t work. If you wish to worry about what will happen if the climate goes off the rails, be my guest. Me, I’m just trying to understand what has kept the climate from going off the rails for the last half billion years …
w.
” Under my paradigm, on the other hand, natural thermoregulatory systems constrain the temperature to vary within a narrow range. In the last century, for example, the temperature has varied only about ± 0.3°C, which is a temperature variation of only about a tenth of one percent.”
Exactly what you would expect from a system with a huge amount of inertia. On the scale of the last 200 years the temperature has varied considerably more that .3C so the 1/10th of a percent is more like 5% or more. During the course of human history the climate has varied from about 12C to 16C. Guess thurnderstorms dont work on a long scale as a governor.
How about the constructual paper.. hows that looking?
You reported the change as +/- 0.3 C. Then did the average using Kelvins. That is called switching. I do not care what scale you use but be honest about it. Further, this average says nothing about stability.
Willis, you have the gift for expressing the boggling complexity of the Earth system, our water planet. I would like to share a video link my son recently sent to me.
“Water, Energy, and Life: Fresh Views From the Water’s Edge “.
If you have not seen it I am certain it will increase your gob smacking awe of nature’s complexity. It is full of manifold implications.
“Uploaded on Apr 29, 2009
Dr. Gerald Pollack, UW professor of bioengineering, has developed a theory of water that has been called revolutionary. The researcher has spent the past decade convincing worldwide audiences that water is not actually a liquid. Pollack explains his fascinating theory in this 32nd Annual Faculty Lecture”
http://youtu.be/XVBEwn6iWOo
Willis,
Your mention of thin film oil on (troubled) waters reminded me of the rule of thumb back in the 50s or 60s (it may be older than that, but the world only came into existence for me a few years earlier ;)) that one pint of light machine oil per 1000 acres was sufficient to suffocate nearly all mosquito larvae in that body. Wonderful stuff that petroleum stuff.
cheers,
gary
±0.3°C would be about 2/10 of 1%, wouldn’t it? Or am I setting myself up for another example of Muphry’s Law?
Next big hurricane to come along, we should have a courageous ship cut a diagonal swath in its path spraying a band of bunker fuel. Any effect should show up on radar and satellite images.
And understanding the climate will achieve … what? Best (and IMO inevitable) case: awareness of the wasteful futility of trying to manipulate it, and get on with making best accommodation to it.
Steven Mosher
Am new here as far as comments go but noticed your negative comments no matter what the subject.
What about you providing some facts, corrections instead of constant sniping?
Mark, C stands for centigrade, the units that the kelvin (and celsius) scales use. Simples.
Marc says:
February 8, 2013 at 11:32 pm
I had said above that your grasp of the subject is weak. This is another example. Perhaps you could tell us the difference between a temperature that varies by +/- 0.3 C, and a temperature that varies by +/- 0.3 K.
w.
If we propose that life plays a (major) part in regulating temperature, the most appropriate temperature scale to use may not be degrees Kelvin. Nor degrees Celsius. My recollection from studying biochemistry nearly 50 years ago is that (most) life forms thrive between around 10C and 45C. Call it a 30 degree range. A human constructed system which regulated itself to ±1% without intervention for a century or so would be quite impressive.
Steven Mosher says:
February 8, 2013 at 11:30 pm
A huge amount of inertia? The surface temperature changes by 30°C in a day, my friend, where is your “inertia” in that? The global average surface temperature varies by about 5°C in the course of a single year, each hemisphere swings twice that … and you think it is sufficient to wave your hands and say the magic word “inertia”, and that shows that thermal inertia is keeping the average temperature within ± 0.3°C per century? Really?
If that is the case, then I’m sure that you can provide mathematical details on how the physics of thermal inertia allow it to operate as a governor on a complex system to that extent … I’m not seeing how that works. I mean, when the earth starts to heat or cool like it does every year, how does “inertia” act on the system to keep it within ±0.3°C over the 20th century?
We don’t have global temperature records back 200 years, and for a man who is always calling for data and code, as usual you have provided none, so I don’t have a clue what you are talking about.
And IF the temperature actually were fluctuating ± 5% instead of ± 0.1% as you fatuously claim above, that would be a temperature swing of 28 FREAKING DEGREES in the last 200 years … so I gotta believe you are drunkblogging, or you’ve lost the plot.
Finally, this should be a warning to you:
Mark Aurel says:
February 9, 2013 at 12:43 am
When even the new folks see through your act that fast, you have problems, my friend. I have to confess that I agree with him, the constant negativity and sniping grows old.
It wouldn’t be bad, but you rarely back up your goofy claims, you rarely follow up on my requests for actual data, you rarely provide citations, you rarely answer objections to your claims.
Mostly you just come in, squat, take a dump on the floor, and leave without cleaning it up.
It’s getting old, my friend, how about you try something else. Or if not, how about you go take a dump on someone else’s floor. I’m tired of it.
w.
“Of course, the counter-argument to the oil-on-the-water cuts evaporation and warms the ocean hypothesis was World War II. It put more oil into all of the oceans of the world than at any time before or since, and during the war in general the world was quite cold … dang fact, they always get in the way.”
Now that is a very interesting point. Here is what the ICOADS ship based SST record looks like. Here I have removed a fixed 0.4K from when the US got involved in WWII, until the demobilisation of US Navy after the war. My adjusted (green) line looks “correct”. The red plot is the actual ship-based data:
http://curryja.files.wordpress.com/2012/03/icoads_monthly_detail2.png
The Met Office Hadley group have taken the odd approach of correcting one side but not the other, but that is another storey. A much closer look at that here for anyone interested:
http://judithcurry.com/2012/03/15/on-the-adjustments-to-the-hadsst3-data-set-2/#comment-188237
I had always regarded the war-time increase in SST as an obvious sampling problem due to changes in maritime circulation (convoys etc) ; mobilisation of US Navy with possibly different water sampling methods etc. It is easy to come up with reasons to dismiss it as a sampling issue and attempt to remove it. Indeed this is probably the biggest issue in the 20th c. SST record.
This idea that it may be a real phenomenon is interesting. You say that “during the war in general the world was quite cold ” . Now since that was not the case for SST , I assume you are referring to air temperatures.
Far from being a fact that gets in the way, it would seem to be totally consistent with the idea that oil on the oceans was preventing heat from escaping. Warmer oceans, cooler land.
What data were you basing the “during the war in general the world was quite cold ” comment on?
Damn, have a look at this too:
http://oi49.tinypic.com/xbfqtw.jpg
Again, I had concluded that the marked drop in cyclone energy during the war was that many non land-falling storms simply did not get noticed because of much reduced shipping patterns in the Atlantic.
Is that your oil too ?!
OK? but our temperature measuring system is flawed, surface land coverage is uneven and concentrated in warmer areas presumably because it makes servicing/data collection easier, and ocean surface temperature measurement is poor at best. Satellite measurement has its own problems that pose data problems though better coverage. Using temperature alone is wrong because there is no allowance for heat content and it is heat that drives climate. There is only one source of global climate energy, the sun. GHG theory ignored because thermodynamic law violations make that a hopeless case. We do have one exceptional thermoregulating substance— water. when the sun forces temperature up surface water evapourates soaking up heat, as latent heat, convecting, forming clouds which increase albedo and release the latent heat which escapes to space. It is simple. CO2 has no place in this system because it has no physical property, apart from adsorbing and emitting IR, that would act like water’s holding onto latent heat and releasing this heat on condensing. No other system required. In fact there is no need of the GHG theory because we get more than enough heat from the sun.
Thank you Willis for your timely “cold shower” article. I think you called it a new paradigm. Very readable, calmly presented veiwpoint that made plenty of sense to me. Just for your interest it is 9.30pm in Sydney Australia and i’m sitting at my desk eating my dinner and reading these comments. Your demolition of S.M was brilliant and long overdue, i almost choked on my spagetti bol. Keep up the good work.
The video of Gerald Pollack explaining “EZ Water” certainly suggests that electricity/ magnetism and photons in certain energy ranges may have significant impact on the hydrological cycle, which governs the nature of cloud formation. Certainly relates to Wllis’ thoughts on things like oil on water. Possible there are effects here relevant to emergent phenomena and important to climate.
Great again Willis! I love the little fishies in the cartoon,amazing how
they can act as a single unit.Microoganisms swimming in the air,think of
them as little fish….. just saying
BTW do not ban Steven Mosher.Why? Well when I am having hard time
understanding,he posts something and i can see my way to the correct
understanding. I take the view contrary to his….he is a great help to me ];{)
Alfred
Here is a closer look at accumulated cyclone energy, annual totals, with less filtering
http://i47.tinypic.com/vg769i.png
The general pattern would lead to the expectation of one or two strong peaks in the war years.
There is current work on trying to asses under-counting (Vecchi et al from memory) that estimates there was probably one missed storm in that period. This would increase it a bit but not really change the notable lack of storm energy in that period.
Excellent Willis as ever.
We used to do something in fluid mechanics called dimensionless analysis which I never quite understood? To determine a formulae for a given effect all the likely variables and constants were brought together and to me if course as if by magic a formula would result. So what’s this got to do with the price of bread?
What are some of the major constants which are largely un changing?
The earths rotation, orbital speed around the sun, gravitational pull of the sun and moon etc etc.
The output of these major constants is a chaotic system of weather wrapped in a stable climate.
Just maybe it these constants combined which are the controllers of the emergent system so well put forward by Willis.
Emergent systems were part of a talk I gave on ornamental horticulture in Jersey in the early 1990s. Just as flowers can be considered to be more complex developments of leaves, flowers can get their construction out of order and end up missing usual parts like petals or stamens – or even including residual leaf parts. I showed a series of slides of camellias and how they could have parts emerging out of order. For some flowering plants, the order that produces a certain colour of flower can be disrupted, so that “sports” of different colour, striped ones, spotted ones, can evolve spontaneously.
I mention this because the origin of the change is reasonably assumed in the first instance to be at the molecular level to protein size. This leads to the easy introduction here of nucleation as a topic in the formation of cloud and rain.
The cause of the emergence seems to me to be more likely to act on small particles, where less energy is required to commence it. Small particles with nominated similar properties are generally more abundant than large systems with nominated properties, so the frequency of these events is not population limited so much with smaller particles.
However, there are still some questions, not for immediate answer but for thought. I’ll mention but one. Below is a map showing some tropical cyclone paths. Three factors might be real. First, the tracks often take a 90 degree turn after some days out to sea and head for the coast. Second, many of them (at map scale) cross the cost at very near to perpendicular to the general shoreline; and third, the hard one, many tracks continue for several days over hot, dry desert, covering up to 2,000 km.
Might it be a rider to your explanations that not all storms follow the pattern of behaviour that you describe?
The interactive site for cyclone tracks by the BoM is at http://www.bom.gov.au/cgi-bin/silo/cyclones.cgi?region=aus&syear=1992&eyear=2006&loc=0
A less cluttered illustration from this source is at http://www.geoffstuff.com/tracks.jpg
Lloyd Martin Hendaye says:
February 8, 2013 at 11:15 pm
As Edward Lorenz noted in 1960, over the long term Planet Earth may not have a “climate” at all. Regardless of total solar irradiation (TSI) and various global atmospheric factors, not climatological but geophysical influences are all-determining…..
>>>>>>>>>>>>>>>>>>>>>>>>>>>>>>
Agreed. It is something that is often left out of the discussions on climate.
Intuitively, it would seem that IF for whatever reason the Pacific Decadal Oscillation stayed permanently in one state or the other, that the world would end up either warmer overall or cooler overall.
Yes it would,
http://virakkraft.com/Hadcrut4gl-derivative-NPI.png
http://virakkraft.com/Hadcrut4NH-AO-NPIintegral.png
So what you are saying is that the atmosphere could be a lot more complex, with a host of still-unknown factors, than the “brilliant” minds of the IPCC/CRU/UEA have been telling us. Egad, sir! Who would have thunk it?
Another possible route of solar effects on cloud formation is the UV shift, which is known to have an impact on the position of the jet streams, which as Stephen Wilde keeps pointing out, are major main corridors of cloud formation. It the polar jet moves equator-ward, or shows higher amplitude Rossby waves, the amount of jet-associated cloud cover increases.
Willis Eschenbach says to Steven Mosher:
February 9, 2013 at 1:33 am
When I see a WUWT post authored by Willis I normally give it a miss and now I’m reminded why.
Another cause might be the effect on thunderstorms of gradual changes in the earth’s electromagnetic fields.
This led me to look up wiki here http://en.wikipedia.org/wiki/File:Magnetic_North_Pole_Positions.svg
Maybe little ice age when magnetic pole drifts south, then getting warmer as it heads towards the geographic pole?
Willis’ first point about temperature stability is a good one. The electronic thermostat controlling your heating system, the similar thermostat in your refrigerator or freezer can’t achieve the low variability of the Earth’s natural thermostat. Less than 1°C over more than a century is quite an achievement for natural processes.
Stacey:
This is an off-topic aside provided for amusement.
At February 9, 2013 at 3:03 am you said
A beauty of dimensionless analysis is that it enables simplified physical modelling of fluid dynamic systems: simply, if you keep the dimensionless numbers the same then a physical model will behave similar to the real thing when the model is at different scale and/or different temperature and/or different pressure than the real thing.
In the 1980s at the UK’s Coal Research Establishment (CRE) we were developing advanced power generation systems (PFBC, ABGC, etc.). These systems have combustion chambers that are fluidised beds of ash particles at high temperatures and pressures. Behaviours of the beds needed to be studied, and this could be done relatively cheaply at atmospheric pressure and ambient temperature by choosing the correct flow rates, particle sizes and particle densities.
Dimensionless analysis enabled choice of appropriate particles and it was determined that grain (i.e. wheat) was ideal. So a large grain store was needed (the models were full-size replicas of power station combustors).
However, the grain store was rodent paradise. Unknown to us, it became infested with countless numbers of mice. They stayed in the store so went unnoticed.
The work was stopped in the 1990s, the equipment was sold for scrap, and the grain was disposed of. The mice fled the emptying grain store and very, very rapidly dispersed throughout CRE. They would pop up on and under, desks, lab. benches and equipment.
Everybody played ‘Bat A Mole’ with the mice for weeks until they were eradicated.
Richard
[*NB* I know you don’t mind the short wait Gail but for the benefit of others. The use of multiple links in a post results in the automatic diversion of the post to the spam bin for human attention. Some of you become anxious over the delay in your post appearing and this would be one of the reasons. Don’t worry, we will get it and post it up . . mod]
Willis Eschenbach says:
February 9, 2013 at 1:33 am
A huge amount of inertia? The surface temperature changes by 30°C in a day, my friend, where is your “inertia” in that?
>>>>>>>>>>>>>>>>>>>>>>>>>>>>>>>
The daily surface air temperature variation is a function of the sun as can be seen in the temperature changes of the air and sand during a total eclipse graph
The inertia is from the huge amount of water in the oceans namely 70% of the earth is covered by water.
Dr. Nir Shaviv has a paper out Nir J. Shaviv (2008); Using the oceans as a calorimeter to quantify the solar radiative forcing, J. Geophys. Res. and a layman’s article The oceans as a calorimeter
Does the biosphere play a part in temperature modification? Yes
Phytoplankton are thought to influence ocean cloud cover directly link Trees modify the temperature around their leaves. …plants protect one of their most important functions – photosynthesis – by maintaining average leaf temperatures at around 21 °C, regardless of the weather.
For those interested “Just The Facts” compiled this set of Potential Climatic Variables for WUWT.
oldfossil says:
February 9, 2013 at 3:35 am
When I see a WUWT post authored by Willis I normally give it a miss and now I’m reminded why.
***************************************************************************************************
So what happened this time???
Willis
thanks for your continuing efforts to shed light into a world of darkness. Your posts always stimulate the grey cells (and confirmation bias?) in this old aquatic mammal.
Some observations:
1. I have read somewhere that the GHE is greatest at the poles and reduces as one approaches the tropics where the GHE = zero. I don’t know if this is generally accepted, but your writings about the self-regulating mechanism of tropical thunderstorms driven purely by the energy of the sun seems to support this view. Now if this is true (no GHE in the tropics) then any fluctuations in the temperature record of the tropics on a daily, seasonal, annual, decadal or longer basis must be due to something other than greenhouse gasses. Do you agree and if so what does the record show? Does this support the slow longterm temperature drift? Do we actually have enough reliable data to form a view?
2. Do fluctuations in the temperature record in other parts of the globe (where GHE applies) follow a different pattern? or a similar pattern? or is there a lagged response to changes in the tropics? is the lag over days weeks months years decades? Given that the tropics are the throttle of the earth’s heat engine, is there empirical evidence that it drives temperatures in other parts of the world notwithstanding the mooted effects of GHG’s?
3. Would one not expect that there would be greater fluctuation in temperature in the higher latitudes – lower temperatures (and possibly less humidity) requiring less heat to drive them one way or the other? Does the record reflect this?
4. Even within the tropics, on an annual basis the proportion of land/water presented to the sun varies fairly significantly with substantially more land mass in the northern hemisphere. Is there anything within the annual temperature records that correlates with these changes that may or may not support your hypothesis?
Apologies if this is somewhat rambling and/or displays any basic lack of understanding. Hopefully we are all here to extend our limited understanding of what is truly an incredible system.
Kind regards
DH
Willis,
How do you explain the ice ages using your hypothesis that the Earth naturally keeps temperatures steady? Why does the temperature change during ice ages? Perhaps the natural temperature is cold and the current warm era is a fluke?
“Remember that at the current temperature, the system variably rejects about a quarter of the available incoming solar energy through reflections off of clouds.”
Is it only clouds? The highest heat ever recorded was about 57C, which I expect would have been under a blue sky with the sun overhead. The max temp on the surface of the Space Station is about 120C and on the moon 116C. So without clouds what is preventing the Earths surface getting up to 120C?
Why can’t the atmosphere itself act as a reflector or absorber of heat thus preventing what looks like 50% of the suns energy getting to the surface? Some representations of the Earth’s heat ‘budget’ show 50% of heat being reflected at the surface. In that case reflection should also work just as well for the Space Station and the moon and they should also experience max temps 50% cooler than they are?
Why is it also that if you go up a mountain where there is less air between you and the sun the temperature goes down, even though exposure to Ultraviolet goes up? As you so eloquently explain our oceans and atmosphere work like a giant water and air conditioning system moving heat around the planet in what is a very thin layer, however the max temp in Death Valley would have been in still air and going up a mountain in still air doesn’t expose one to the full force of the Sun’s heat.
It also seems to me that the area rule is applied as a singular and all important factor in the difference between temperatures at the equator and poles (that’s once the ice has melted). I would contend that first is the amount of atmosphere the sun’s heat has to get through followed by the ocean and atmospheric circulation and heat redistribution, followed then by area rule, This is because any surface at either pole such as a mountain or ridge that is face on to the sun should have the same temperature as any similar type of surface sharing the same angle to the sun, anywhere else on the planet. So if a valley face on Greenland happens to be face on to the sun (under a clear sky) it should be the same temperature as perhaps the valley floor in Death Valley when it is face on to the sun?
“So if a valley face on Greenland happens to be face on to the sun (under a clear sky) it should be the same temperature as perhaps the valley floor in Death Valley when it is face on to the sun?”
I should have added “…according to the area rule?”
Perhaps the reason for all the problems with understanding what regulates climate is because using an average global temperature as a benchmark is meaningless. Local climates can have large ranges in temperature so “average global temperature” does nothing to tell anyone what is actually happening.
oldfossil says: “When I see a WUWT post authored by Willis I normally give it a miss and now I’m reminded why.”
Just as well you got so far reading this one and about fifty comments to get to the comment you quoted. For someone who would “normally give it a miss ” , you seem to be paying particularly close attention.
Just saying…
I usually find Willis’ stuff excellent and his replies polite and even handed.
Most readers’ minds can no doubt deal readily with concepts as abstract as “emergent phenomena,” but for those of us not so blessed it may perhaps be of some assistance to peruse these much simpler (and readily googleable) examples of that concept’s component features: hysteresis in ferromagnetic-core solenoids and in static/dynamic friction (pumping brakes) and bimodality in tunnel diodes and in departure from nucleate boiling.
Note to Mr. Eschenbach: For some of us the use of “overshoot” as a synonym for hysteresis is confusing because, I am reliably informed, it is used in some circles to refer to the behavior of underdamped second-order systems that are completely linear.
Gail,
It turns out that one can use the Earth’s oceans as one giant calorimeter to measure the amount of heat Earth absorbs and reemits every solar cycle
Change that to ‘volcano cycle’ http://virakkraft.com/sealevel-VEI-4.jpg
The correlation with solar totally breaks around 1920.
An interesting and thoughtful presentation Willis. Have you seen what might count as evidence for the oil on the water scenario associated with the BP oil spill in the gulf or any other major spills?
Note that I do agree with you on the cloud factor. I believe that Lindzen’s Iris theory is based upon variation in cloud albedo rather than overall cloud cover where the albedo is changing due to the nucleation materials. It was ‘supposedly refuted by some warmista trying to prove it didn’t work in the arctic region when it was presented by Lindzen as a tropical factor.
Willis Eschenbach says:
February 9, 2013 at 1:33 am
I agree that Mosh has been a bit obtuse there – but he has a valid point and I would respectively add that the total thermal inertia in the system (land,oceans, etc) is much greater than in the atmospheric surface ‘air’ temperatures! The diurnal temperature variation noted in a normal day affects only the top few millimetres of land and sea and of course the convected heat into the lower atmosphere ‘air’. I am sure you realise that the thermal inertia (or latent heat content, if you prefer) of the oceans and land, buildings, etc – is what ‘smooths’ out both the diurnal temp variation and reduces the effect of other cyclic changes (ENSO, AMO, etc).
FWIW, this is why I do not take palaeo temp (or other proxy) data as entirely ‘read’, except with a bucket of salt – because we know from current observations, that cyclic changes can take a long time to appear/affect the climate system. But what we do not know is how long some of these lag effects are or what their periodicity will do to the palaeo record (in effect, the palaeo record is thus at best a severely smoothed temperature average!) – the lag effects could be decadal right through to multi-millenial (e.g Milankovitch).
Equally, this is why current temp data needs to be taken with a large pinch of salt (UHI and bad station data ignored!) because the effects we see today, may be result of changes from many decades or centuries ago, about which we know nothing, or have only weak evidence!
In simple terms, our data ‘sample’ is so darned small in terms of earths age and climate as to be almost useless.
“You reported the change as +/- 0.3 C. Then did the average using Kelvins. ”
20% longer distance is 20% longer distance whether measured in miles or centimeters. That’s one of the benefits of using percentages… units don’t really matter. The comparison is X to X*1.2 and the units remain the same so they “cancel out.”
In reply to Steven Mosher says:
February 8, 2013 at 11:30 pm
Steve, I think you are referring to time scales much longer than 200 years back for the larger variation (e.g., 100 k year glacial to interglacial variation). The likely cause of the larger change over these longer time periods is slow variation in Earth’s tilt to the Sun. The large land area and seas in the high North latitudes accumulate and retain more ice when summer tilt is larger, so reflection from ice increases albedo independent of clouds. This would lead to a glacial period, and global cooling due to decreased total insolation. When the tilt decreases, much of the land and some of the sea ice melts and insolation increases, resulting in increased average temperature. These processes occurs over much longer time periods than Willis was referring to.
New paper published in PNAS this week which goes through the natural variation cycles and the global warming trends going back to HadCET starting in 1659. Invokes the AMO and contains lots of interesting explanation.
http://depts.washington.edu/amath/research/articles/Tung/journals/Tung_and_Zhou_2013_PNAS.pdf
Willis,
If you wanted to write a groundbreaking paper you should put some thought into what could cause a lag in overall temperature correction.
Your first article in the series examined things on a strictly local level to balance that out. Ok, good. Lets say that part of that balancing act shuffles heat from one area to another area, but in aggregate leaves a small rise in temperature at the new location that doesn’t get cancelled out. Eventually the accumulation on the system overall triggers a different system to wipe out the accumulation. Maybe it’s as simple as the various jet streams switching more heat over the oceans, increasing evaporation->cloud cover->higher albedo->lower temperatures until the jet streams switch back once the temp swings low enough.
Would explain the rise, then current leveling off of temperatures that we’re experiencing. Explain that to scientific satisfaction, and you’ve got a book tour. 🙂
I think this might be the best summary ever of “knowing what we don’t know” about global climate. The historic evidence of “self-regulation” is what brought me to question AGW theory when the theory first became fashionable; that and the fact that it seemed unlikely a quarter-inch tail could be wagging a 100-yard-long dog. If a warming sun, horrific episodes of volcanic eruptions, catastrophic meteor strikes and etc. have not budged the “thermostat”, what chance have mankind’s puny efforts?
Interesting ideas, Willis, thank you. Average surface temperature does oscillate over a wider range on the glacial/interglacial timescale, but on that scale too there seem to be controls which stop the system overshooting at either end.
Willis, go back and look at your posts on the Argo float temperatures. You showed that the ocean limits it’s temperature to approximately 30 degrees C. This is only one of many mechanisms that serve as a thermostat. The Oceans are one big chemical factory storing energy in chemical compounds.
*NB* I know you don’t mind the short wait Gail but for the benefit of others….
>>>>>>>>>>>>>>>>>>>>>>>>>>>
I just keep a copy and wait a half hour.
The links are a lot easier to put in in the first place than having to defend the position later with the links and make the narrative that much harder to follow.
>>>>>>>>>>>>>>>>>>>>>>>>>>>>
lgl says: @ February 9, 2013 at 5:09 am
Change that to ‘volcano cycle’ http://virakkraft.com/sealevel-VEI-4.jpg
The correlation with solar totally breaks around 1920.
>>>>>>>>>>>>>>>>>>>>>>>>
Yes I know, (I was trying to keep it short and focused, not one of my traits)
News release about above paper:
There is a heck of a lot of variables all interlinking. Volcanoes can emit sulfur. I can’t find a specific paper but this shows sulfur is important to the phytoplankton that emit dimethylsulfide (DMS) and change clouds and albedo.
This article did not include a single mathematical equation. But it did have a nice picture of a group of small fish making the shape of a big fish.
The overall point Willis is making is of course correct, that nonlinear/nonequilibrium pattern dynamics play a role in weather and climate. It is useful to explain this in qualitative terms. And any scientist denying nonlinear phanomena in climate is akin to flat earether. I dont think any serious ones do
However there is a well established field of physical / mathematical study of nonlinear/nonequlilbrium pattern systems, including oscillatory systems. This is in a way frustrating – it is easy in a few seconds with a few clicks of the mouse to turn up many advanced studies of oscillatory pattern systems whose methods and conclusions probably have some important light to shed on the big climate questions. But no-one is doing this. The nonlinear expertise is staying cooped up in fields like chemical, electrical and process engineering and a few others, but not being applied to climate science. For instance, the use of a Melnikov function to tease out the emergent tidal oscillation from multiple interacting tidal forcings in a coastal inlet by Doelman et al 2002 Probably provides the method needed to correctly analyse alternation between glacial and interglacial periods under Milankovich forcings. Climate scientist meanwhile continue operate in a sterile linear paradigm.
Generally what role do nonlinear pattern phenomena play in the climate debate? The role it does not play is to try to argue that chaos / nonlinearity abrogates thermodynamics. In this sense Steve Mosher is right and Willis wrong. If you boil a kettle, plenty of nonlinear pattern phenomena happen in the kettle. Hexagonal cells spontaneously appear as instability develops between the heated lower layer and cooler upper layers. However does the outbreak of chaos allow the kettle to eject all the incoming electrical heat into the surrounding kitchen and stubbornly refuse to boil? No – the kettle boils. Its just that the water does not heat in a spatiotemperally uniform way.
Instead, what nonlinear pattern phenomena should provide is destruction of one of the most stupid arguments in climate science, which is “Oh look – global temperatures are rising. We think CO2 is responsible. Can you think of anything else that might be causing this rise? No? Nor can I! I cant think of anything else either! Well then its all settled – CO2 is warming the planet! [donate here]”
This is of course the real reason why climate science is holding out against acceptance of nonlinear pattern phenomena and chaos-related dynamics. Once one does, the question of the idiotic “null hypothesis” of stasis disappears like dark-ages animistic superstition. It is obvious from the open, dissipative and non-equilibrium nature of the atmosphere-ocean system, combined with periodic forcings from moon, sun and orbital cycles, that oscillation is going to be the norm, not the exception. Richard Lindzen put it best, “a climate in stasis or equilibrium would be like something dead…. “to believe that the end-19th century represented climate perfection is not a sign of intelligence”.
The mean global temperature of the atmosphere is not an “emergent” phenomenon, but simply a designed one. No one has yet demonstrated to my professional scientific satisfaction that there has even been any real global (as opposed to regional) warming over the period of modern temperature records; it is entirely unclear that climate scientists are even properly measuring the true global mean surface temperature, that they may not after all have been merely identifying multidecadal ocean temperature oscillations as “global mean surface temperature”.
“Emergent phenomena” is just a false euphemism for a very real design of the world (as is every other design-denying term that has been invented by defenders of the undirected evolution paradigm, to avoid admitting the rather obvious designs scientists and laymen alike can observe just about any day, if their eyes and minds are open to recognizing them–look, for example, at the flowers, and their characteristic so-called “co-evolution” with animals and plants, a fundamental characteristic entirely counter to the expectations of, and thus disproving, undirected evolution). The next paradigm, as only my research has uncovered, is a rebirth of appreciation for the world design, as most recently redone by the “gods” of ancient worldwide myths, in a wholesale re-formation of the Earth’s surface (designed to communicate their deeds to any future mankind capable of seeing and interpreting it), only 10,000 to 20,000 years ago.
What you’re calling “slow drift” may very likely be nothing (and everything!) more than a long period oscillation. We haven’t yet acquired the capacity to integrate the impact of planetary scale oscillatory events in chaotic systems, except by models, all of which are currently naive. A question in my mind, when discussing the atmosphere, is not the role trace gases play (and I rank O2 as a trace gas in this context), but to what extent does the huge volume of atmospheric nitrogen represent as a thermostabilizer? Yes, it is biochemically active and plays well in some redox reactions, but it is, on a large scale, somewhat inert. We may be chasing mosquitos with our emphasis on components whose effects are largely localized, and missing some of the bigger determiners.
I would think that Gail Combs make a critically important point. Any attempts at describing climate without including effect of the energy storage in the ocean is not going to have any validity.
“Slow Drift in Thermoregulated Emergent Systems”
Your thunderstorm governor is of a digital nature. So a long term drift of the AVERAGE corresponds to pulse width modulation.
Which makes claims of impending doom all the more laughable; yes the average will go up or down, yet the values between which the short term temperature switches are entirely unaffected.
This of course also goes for impending doom through cooling short of all out glaciation.
Regarding the potential effect of an oil film on the ocean, here’s another possibility along the same lines. I.e., a contaminant that hasn’t been considered. The poster below has posted other comments like this one over the years.
Another area is plant respiration. I’ve been in the middle of a field when the sun came out. I could feel the air become super humid within minutes and the air also got warmer.
lgl says:
February 9, 2013 at 5:09 am
Gail,
It turns out that one can use the Earth’s oceans as one giant calorimeter to measure the amount of heat Earth absorbs and reemits every solar cycle
Change that to ‘volcano cycle’ http://virakkraft.com/sealevel-VEI-4.jpg
The correlation with solar totally breaks around 1920.
==========
Looks interesting. Do have a link to something more readable than that garbled photo-collage mess of a graph, preferably with data sources?
I was looking at just this issue last week when I found indications of a circa 9y cycle in temperatures of the various ocean basins. It appears that the these cycles are about the same size as the potentially solar related signal and the phase crisis that happens around 1920-1930 is when the two are out of phase.
Auto-correlation of N and S. Atlantic SST (ICOADS, not Hadley massaged data):
http://oi50.tinypic.com/29kv291.jpg
Ten cycles from present (2005) to 90 years ago , clear 9y cycle. Reduced magnitude at 40 , 80, 120y is likely interference with other periodic repetitions.
The temp record in 20’s has peaks about every 4 or 5y , this would be due to the two being out of phase rather than in sync. They were in sycn in 80s and 90s , hence the large decadal scale variations.
If you have a link to the source of the VE3+ data , I’d like to have a look.
Stephen Skinner says:
February 9, 2013 at 4:40 am
“Remember that at the current temperature, the system variably rejects about a quarter of the available incoming solar energy through reflections off of clouds.”
…..
Is it only clouds?…..
>>>>>>>>>>>>>>>>>>>
NO, remember Ozone and O2 react with incoming UV and EUV the high energy wavelengths from the sun.
Changes in Ozone and Stratospheric Temperature graph
Ozone is formed when intensive ultra-violet radiation from the Sun breaks down O2 into two oxygen atoms. These highly reactive oxygen atoms can then react with more O2 to form O3 (‘intensive ultra-violet radiation’ = EUV )
Willis to Mosher: Mostly you just come in, squat, take a dump on the floor, and leave without cleaning it up.
That was the most hilarious and accurate comment I’ve seen on this forum.
The study of emergent systems is new to me. The concept is fascinating. Thank you for sharing your insight Willis.
I am starting to think that we should all chip in and endow a chair of climate science or some such here at WUWT so that Willis might be free to give us say 1/2 his time (I don’t believe a guy like
Willis will ever do anything full time, too many interests).
Dave
Kev-in-Uk says:
February 9, 2013 at 5:25 am
Willis Eschenbach says:
February 9, 2013 at 1:33 am
I agree that Mosh has been a bit obtuse there – but he has a valid point and I would respectively add that the total thermal inertia in the system (land,oceans, etc) is much greater than in the atmospheric surface ‘air’ temperatures! The diurnal temperature variation noted in a normal day affects only the top few millimetres of land and sea and of course the convected heat into the lower atmosphere ‘air’. I am sure you realise that the thermal inertia (or latent heat content, if you prefer) of the oceans and land, buildings, etc – is what ‘smooths’ out both the diurnal temp variation and reduces the effect of other cyclic changes (ENSO, AMO, etc)…..
>>>>>>>>>>>>>>>>>>>>>>>>>
Thermal inertia in the system:
For caves in Indiana around Bloomington the temperature is an even 52.5F, for Texas ~72F and if I remember correctly for Vermont ~45F (BRRRrrrr) You can cave in Indiana using 2 pair of wool socks and plastic bread sleeves but in Vermont you had better have wet suit booties. Doesn’t matter what time of year it is the temperature once past the entrance is the same.
Not bad. Not bad at all. Decades of increasing land warmth is likely, in my opinion, the result of previous extended La Nina/neutral ENSO conditions allowing for extended periods of enhanced ocean warming and at deeper depths by clear sky conditions at the equatorial belt. This extra heat rides the currents and is belched out over a fairly long period of time. Our land sensors pick this up and cause consternation in folks who believe in vegetarian furkey for Thanksgiving.
lgl linked to:
http://virakkraft.com/sealevel-VEI-4.jpg
On one of the time axes, note the spacing of minor tick marks between major ticks:
3 minor ticks / major tick: 1960-1980
4 minor ticks / major tick: 1900-1920, 1940-1960, & 1980-2000
5 minor ticks / major tick: 1920-1940
Gail Combs: Did you notice this?
Can anyone here point to the source of the original (unmodified) graph?
As always you are doing god’s work but I want with respect to take issue. You state”so what aresome of thethings that might cause these slow century or millenia long drifts in temperature. Is it changes in the sun? I think the explanation lies elsewhere than the sun”.
The explanation lies in the fact that you can not “heat” water from above. You can “radiate” it but you can’t “heat” it.
Sometime ago I decided that the thing that was missing from my life experience was that I had never seen water heated from above, how does it work. I grabbed a heat gun and fired it at a bucket of water,not many people do this.
To my utter astonishment the rejection of the heat was total. The water remained stone cold. With further experimentation I discovered tha the only way to heat water from above was to float an object on the surface and apply the heat gun through the floating object (grill pan). The grill pan cancels the surface tension underneath it and allows the passage of heat into the water. There is one caveat that should be noted, a heat gun is not the absolute ideal for the experiment because it is fan forced heat and the fan forcing simulates weight and can “fool” the surface into letting heat through but it is very very minor.
The whole key to this climate argument is surface tension and that makes sense because we know surface tension exists and it was demonstrated to people my age 71 that it was strong enough to support the weight of a paper clip and heat has no weight.
The climate is a locked box involving the ocean and the sun’s radiation, everything else is peripheral. In short your idling SUV doesn’t count.
I discovered recently that the teaching of surface tension has changed. It is no longer taught as a confrontational force capable of supporting weight. pupils are encouraged to see how many blobs of water they can place on a coin, which leads me to believe that there are people in positions of authority who realise that if the public get a whiff of surface tension its all over.
So I want everybody to get a heat gun and fire it at a bucket of water. Don’t forget to say “go ahead make my day” rgds
To me, Willis’ post evokes the Gaia Hypothesis where the Earth as a whole, has the ability to maintain homeostasis. With the greatest of respect, however, I think ultimately, the Sun is the ultimate arbiter of the Earth’s climate. The Sun, orbital perturbations, and axial precession, in my opinion, drive the climate train. In any case, I think that manmade CO2, is like a fly on an elephant’s ass when it comes to climate change/global warming, or whatever they call it nowadays.
Greg
Here’s one more garbled photo-collage mess of a graph. You are right about the 9 yrs (or 8,9) http://virakkraft.com/moon-volcano-temp.png
My VEI-data is a simple count of eruptions each year from this: http://www.volcano.si.edu/world/largeeruptions.cfm
Note it is not stratospheric aerosol data.
WILLIS DE N3YSC R R ON MOSHER AR
Willis There is good empirical evidence of the relation between solar “activity” and temperature via cosmic rays – mainly clouds and albedo with some probable EUV effect thrown in-although I agree the exact mechanisms are not well understood. see for example Fig three in Steinhilber
http://www.pnas.org/content/early/2012/03/30/1118965109.full.pdf
which shows the clear correlation between cosmic ray intensity and the various Little Ice Age Minima.
See also Wang http://www.atmos-chem-phys.net/12/9581/2012/acp-12-9581-2012.pdf
which deals with the late 20th century warming.
The basic control on millenial,centennial and decadal climate trends is the variation in the solar magnetic field strength – which itself relates to torques on the sun generated mainly by the Jupiter – Saturn resonance beats . The major trends are of course the Milankovitch cycles.which are modulated by the higher frequency solar cycles.The main picture is now quite clear – the devil is in the details. CO2 levels follow temperatures and have only minor effect on climate with a climate sensitivity of about 1 degree. Lower than the lowest Model derived range.
We all know whats done it. CO2. There thats my research for the day, week, year, keep those checks rolling in. Dont have to think, why it may, could give me a headache. Hold on, theres another research grant, right . Gosh this climate science certainly is easy. Now to plot this on a spreadsheet. Wheres my “DUMMIES FOR EXCEL” ?. Under the wobbley science desk. Not to worry, Phil has one. Thankyou WIllis.
Pamela Gray says:
February 9, 2013 at 8:14 am
“Not bad. Not bad at all. Decades of increasing land warmth is likely, in my opinion, the result of previous extended La Nina/neutral ENSO conditions allowing for extended periods of enhanced ocean warming and at deeper depths by clear sky conditions at the equatorial belt. This extra heat rides the currents and is belched out over a fairly long period of time”
There are chemical reactions that remove heat from the ocean, store heat, and release heat. The calcium carbonate reaction removes heat, the hydration of the calcium carbonate stores heat and the reverse reaction releases heat.
A multitide of internal system variables seek to disturb the top of atmosphere radiative balance but are always met by a negative system response which moves back towards the thermal equilibrium set by mass gravity and energy input.
I would say that changes in top of atmosphere solar input can change the equilibrium surface temperature (or rather total system eneregy content) as can changes in total atmospheric mass and the strength of the gravitational field but even the effects of insolation are mitigated on our planet by the efficiency of the water cycle such that I have previously proposed that efficiency as a solution for the so called early faint sun paradox.
As to how the negative system response actually works I have been exploring that for several years and building up a narrative that seems to work.
This is my most recent effort:
http://climaterealists.com/index.php?id=10775
“The Ignoring Of Adiabatic Processes – Big Mistake ”
Which links back to tallbloke’s site for a lengthy discussion.
I am pleased that Willis is now moving towards ideas that I and others have been propounding for some time.
To summarise:
In the first instance there are changes other than in mass gravity and energy input that do seek to destabilise the system. Radiative characteristics being one such but there are many others.
Such forcing elements are part of the diabatic loop whereby incoming solar energy provokes a thermal response.
However that then has the potential to upset the TOA radiative balance and that cannot be permitted to continue for long if the atmosphere is to be retained in gaseous form.
So the outcome is that the TOA imbalance itself provokes a negative system response in the adiabatic loop thus:
i) Too much energy going out results in system cooling which rebalances energy in with energy out.
ii) Too much energy in results in system heating which rebalances energy out with energy in.
The mechanism whereby the potential imbalance is stabilised is the adiabatic loop swapping energy between PE and KE as necessary to keep the system temperature at a level which gives energy out equalling energy in no more and no less. Those changes in the proportions of KE and PE in the vertical column do alter the lapse rate because it is the amount of KE available at any given level which determines the temperature at that level,
That swapping is a result of a fixed amount of total energy (PE +KE) being changed from KE to PE or vice versa by contraction or expansion of the atmosphere as a whole or by expansion and contraction of layers within the atmosphere.
A higher atmosphere (or layer) converts more KE to PE for net cooling and a lower atmosphere (or layer) converts more PE to KE for a net warming.
In each case the sign of the change in the speed of the adiabatic loop being equal and opposite to the change in the diabatic loop.
Any attempt at destabilisation by in the diabatic loop is offset by a change in the adiabatic loop.
The most important fact for present purposes is that the entire atmospheric mass is involved so the effects of CO2 are insignificant because they have no discernible effect on total atmospheric mass.
Don’t forget the Venturi effect.
This was worth reading for that sentence alone.
I once did work on what today are called fractals. Back then, we called them “complex non-deterministic systems”. Maybe it’s because of this long-ago brush with fractal systems that I find Willis’ theory to be much more attractiive than the IPCC’s.
But what does Willis’ theory predict? First, following the scientific method, what would falsify Willis’s theory? And second, what observations would support the validity of theory?
Paul
Like I have written on the graph, no offset between 1930 and 1980. The larger eruptions at beginning and end of the century have a delayed response.
The original is found in at least two of Shavivs papers
http://www.sciencebits.com/files/articles/CalorimeterFinal.pdf
Interestingly, after I made him aware of the flaw he starts in 1920 in a later paper:
http://phys.huji.ac.il/~shaviv/articles/Nir_Shaviv_Chapter_Die_Kalte_Sonne.pdf
I think there is also a thermostat stopping it getting cold. The colder the maximum the less the difference between maximum and minimum. In England the difference between maximum and minimum averages about 8 degrees Celsius in the hottest month and averages about 5 degrees Celsius in the coldest months.
lgl says:
February 9, 2013 at 8:41 am
Greg
Here’s one more garbled photo-collage mess of a graph. You are right about the 9 yrs (or 8,9) http://virakkraft.com/moon-volcano-temp.png
My VEI-data is a simple count of eruptions each year from this: http://www.volcano.si.edu/world/largeeruptions.cfm
Note it is not stratospheric aerosol data.
=========
Thanks for the reply. There is the obvious possibility that this 9y cycle is lunar but I don’t want to prejudice investigation by jumping to that conclusion. I also suspect a possible link between such long term tidal forces and the triggering of volcanoes which is why I asked for your data source.
You will see in the plot you link here what I posted previously that not only the solar correlation breaks down at times but also the linkage you are suggesting here. It looks good in 1925 and 1985. For the rest of the time it can be seen lurking but is not dominant. Again I’d suggest it’s about 50% of the signal.
michael sweet says:
February 9, 2013 at 4:37 am
Willis,
How do you explain the ice ages using your hypothesis that the Earth naturally keeps temperatures steady? Why does the temperature change during ice ages? Perhaps the natural temperature is cold and the current warm era is a fluke?
======================================
When you consider that 90,000 years is substantially colder than our warm periods of about 11,000-16,000 years there is definitely a trigger we are missing.. Magnetism of our galaxy might give us the answer to this as we are nearer large systems galactic during all of these phases and cooler when we are farthest from them..
The slow drift upwards should result in a drift of “earlier” thunderstorms – i.e. for the temp to rise any appreciable amount from any cause, all thermo-regulatory systems should be fully deployed and begin to “slip behind” a bit. This is because, obviously, the latent heat of evaporation/condensation doesn’t change. I suppose wind speeds at the sea surface and some of the other parts of the “engine” could “fall behind” allowing some temp increase.
Your earth temp governor theory is compelling but you do have to deal with what conditions could allow a temp increase at all – it must have something to do with limitations on the efficiency of the engines responses.. If this is the case, then the theory is open to the criticism that the regulator could be swamped – as it surely would be in the extreme case, for example if (and when) the sun were to expand with age and burn us up. I would be tempted to look for an extraterrestrial affect. In the meantime, leaving the cause of the rise in temp aside, it would be very interesting if it were possible by ingenious experiment or theoretical physics to evaluate the affect of raising the temperature enough that it overwhelms the regulator as it presently manifests itself. Perhaps ther is a new over-arching emergent phenomenon waiting in line for the next level of heat assault.
This is all very interesting stuff. You had better get some of this published asap because you can be sure some hockey team clone is looking for an escape hatch.
Stephen Wilde says:
February 9, 2013 at 9:16 am
“The most important fact for present purposes is that the entire atmospheric mass is involved so the effects of CO2 are insignificant because they have no discernible effect on total atmospheric mass.”
==============================================
Here is the crux of the CWAG issue.. CO2 (man caused) is just .0003% of earths total atmospheric mass. Thus it is irrelevant as any sort of driver..
Physics and Math are unforgiving..
Paul Vaughan says:
February 9, 2013 at 8:27 am
lgl linked to:
http://virakkraft.com/sealevel-VEI-4.jpg
On one of the time axes, note the spacing of minor tick marks between major ticks:
3 minor ticks / major tick: 1960-1980
4 minor ticks / major tick: 1900-1920, 1940-1960, & 1980-2000
5 minor ticks / major tick: 1920-1940
Gail Combs: Did you notice this?
Can anyone here point to the source of the original (unmodified) graph?
>>>>>>>>>>>>>>>>>>>>>>>>>>>>>
The source data may be: Large Holocene Eruptions: …list includes known large-volume Holocene explosive eruptions with a Volcanic Explosivity Index (VEI) of 4 or larger.
lgl just for info , here is what I find to be the repetitive 9y pattern in North Atl SST:
http://oi46.tinypic.com/1p8a9t.jpg
It is surprisingly regular consisting of 107m plus it’s harmonic at 53.5m .
Auto-correlation indicates repetition but does not really give the form , so I was very surprised to find something this close to a harmonic oscillation. I was expecting something much more irregular.
Just a warning not to expect pure sines everywhere.
The strong harmonic should be helpful in understanding the cause. 107m = 8.92a which may be closer to the lunar apse cycle of 8.85 than the 9.3a cycle. For the moment I’m more interested in identification of any cyclic content than trying to attribute cause and mechanism.
It appears the question: “|What portion of the 20th century warming has caused by solar magnetic cycle changes as opposed to increases in atmospheric CO2?” will be settled by observations rather than IPCC general circulation models predictions.
There is in the paleo record a cyclic series of astonishing unexplained geological events and climate events (gradual cyclic climate change cycles and extraordinarily large and extraordinarily abrupt climate changes) that correlate with solar magnetic cycle changes.
As shown below based on changes to cosmogenic isotopes (not counts of sunspots) the solar magnetic cycle was at its highest level in 8000 years during the latter half of 20th century.
It appears we will have a front row seat to observe a solar event that will have profound implications for astrophysics and for climate science.
It is surreal that the media and the climategate scientists have spent the last 20 years pushing atmospheric CO2 increases and global warming as a crisis. All of the past interglacial periods ended abruptly.
http://www.sciencebits.com/files/pictures/climate/SolarActivityProxies.png
http://www.solen.info/solar/images/comparison_recent_cycles.png
http://www.solen.info/solar/polarfields/polar.html
http://cc.oulu.fi/~usoskin/personal/nature02995.pdf
Unusual activity of the Sun during recent decades compared to the previous 11,000 years
Direct observations of sunspot numbers are available for the past four centuries1,2, but longer time series are required, for example, for the identification of a possible solar influence on climate and for testing models of the solar dynamo. Here we report a reconstruction of the sunspot number covering the past 11,400 years, based on dendrochronologically dated radiocarbon concentrations. We combine physics-based models for each of the processes connecting the radiocarbon concentration with sunspot number. According to our reconstruction, the level of solar activity during the past 70 years is exceptional, and the previous period of equally high activity occurred more than 8,000 years ago. We find that during the past 11,400 years the Sun spent only of the order of 10% of the time at a similarly high level of magnetic activity and almost all of the earlier high-activity periods were shorter than the present episode. Although the rarity of the current episode of high average sunspot numbers may indicate that the Sun has contributed to the unusual climate change during the twentieth century, we point out that solar variability is unlikely to have been the dominant cause of the strong warming during the past three decades3.
http://hesperia.gsfc.nasa.gov/sspvse…ntergreen1.pdf
Quote:
In The Modern Era (Since 1954)
( 1 ) The galactic cosmic ray intensity near earth has been one of the lowest in the past 1150 years.
( 2 ) The frequency of occurrence of large solar particle events has been low compared to the long term average.
For A Period Similar To 1889 – 1901
( 3 ) The galactic cosmic ray intensity was higher compared to the modern era by factors of:
– 7.0 AT 100 MeV
– 3.5 AT 300 MeV
– 2.25 AT 1.0 GeV.
http://www.nature.com/nature/journal…/399437a0.html
Doubling Sun’s Coronal Magnetic Field in Last 100 years
The solar wind is an extended ionized gas of very high electrical conductivity, and therefore drags some magnetic flux out of the Sun to fill the heliosphere with a weak interplanetary magnetic field1,2. Magnetic reconnection—the merging of oppositely directed magnetic fields—between the interplanetary field and the Earth’s magnetic field allows energy from the solar wind to enter the near-Earth environment. The Sun’s properties, such as its luminosity, are related to its magnetic field, although the connections are still not well understood3,4. Moreover, changes in the heliospheric magnetic field have been linked with changes in total cloud cover over the Earth, which may influence global climate5. Here we show that measurements of the near-Earth interplanetary magnetic field reveal that the total magnetic flux leaving the Sun has risen by a factor of 1.4 since 1964: surrogate measurements of the interplanetary magnetic field indicate that the increase since 1901 has been by a factor of 2.3. This increase may be related to chaotic changes in the dynamo that generates the solar magnetic field. We do not yet know quantitatively how such changes will influence the global environment.
The Sun-Climate Connection
John A. Eddy
National Solar Observatory
Tucson, Arizona
The paleoclimatic data, covering the full span of the present interglacial epoch, are a record of the concentration of identifiable mineral tracers in layered sediments on the sea floor of the northern North Atlantic Ocean. The tracers originate on the land and are carried out to sea in drift ice. Their presence in seafloor samples at different locations in the surrounding ocean reflects the southward expansion of cooler, ice-bearing water: thus serving as indicators of changing climatic conditions at high Northern latitudes. The study demonstrates that the sub-polar North Atlantic Ocean has experienced nine distinctive expansions of cooler water in the past 11,000 years, occurring roughly every 1000 to 2000 years, with a mean spacing of about 1350 years.
http://www.essc.psu.edu/essc_web/seminars/spring2006/Mar1/Bond%20et%20al%202001.pdf
Persistent Solar Influence on the North Atlantic Climate During the Holocene
Surface winds and surface ocean hydrography in the subpolar North Altantic appear to have been influenced by variations in solar output (William: The mechanism by which the sun changes planetary temperature is not solar output, TSI, but rather changes to the solar magnetic cycle. As shown below based on changes to cosmogenic isotopes the solar magnetic cycle was at its highest level in 8000 years at during the latter half of 20th century.) The evidence comes from close correlation between inferred changes in production rates of the cosmogenic nuclides carbon-14 and beryllium-10 and centennial to millennial time scale changes in proxies of drift ice measured in deep-sea sediment cores. A solar forcing mechanism therefore may underlie at least the Holocene segment of the North Atlantic’s “1500-year” cycle. …
… A solar influence on climate of the magnitude and consistency implied by our evidence could not have been confined to the North Atlantic. Indeed, previous studies have tied increases in the C14 in tree rings, and hence reduced solar irradiance, to Holocene glacial advances in Scandinavia, expansions of the Holocene Polar Atmosphere circulation in Greenland; and abrupt cooling in the Netherlands about 2700 years ago…Well dated, high resolution measurements of O18 in stalagmite from Oman document five periods of reduced rainfall centered at times of strong solar minima at 6300, 7400, 8300, 9000, and 9500 years ago.”….
The following is a link to Palle’s earthshine paper that provides data to support a reduction in planetary albedo (due to less planetary cloud cover) 1994 to 2001, which Palle states is equivalent to a forcing of 7.5W/M^2, based on observations. The reduction in planetary cloud cover (as shown in Palle’s satellite paper) is at the specific latitudes and over the ocean as predicted by Tinsley. (The atmosphere over the ocean is ion poor as compared to the continents, as the continental crust is slightly radioactive. The solar wind bursts create a potential from ionosphere to earth’s surface at a specific latitudes.)
Earthshine paper.
http://solar.njit.edu/preprints/palle1266.pdf
“Our simulations suggest a surface average forcing at the top of the atmosphere, coming only from changes in the albedo from 1994/1995 to 1999/2001, of 2.7 +/-1.4 W/m2 (Palle et al., 2003), while observations give 7.5 +/-2.4 W/m2. The Intergovernmental Panel on Climate Change (IPCC, 1995) argues for a comparably sized 2.4 W/m2 increase in forcing, which is attributed to greenhouse gas forcing since 1850.”
http://nsidc.org/news/press/day_after/NRCabruptcc.pdf
Until the 1990s, the dominant view of climate change was that Earth’s climate system has changed gradually in response to both natural and human-induced processes. Evidence pieced together over the last few decades, however, shows that climate has changed much more rapidly—sometimes abruptly— in the past and therefore could do so again in the future.
http://www.esd.ornl.gov/projects/qen/transit.html
According to the marine records, the Eemian interglacial ended with a rapid cooling event about 110,000 years ago (e.g., Imbrie et al., 1984; Martinson et al., 1987), which also shows up in ice cores and pollen records from across Eurasia. From a relatively high resolution core in the North Atlantic. Adkins et al. (1997) suggested that the final cooling event took less than 400 years, and it might have been much more rapid….
…The event at 8200 ka is the most striking sudden cooling event during the Holocene (William: The Younger Dryas 12,900 yr BP cooling event is larger by a factor of three), giving widespread cool, dry conditions lasting perhaps 200 years before a rapid return to climates warmer and generally moister than the present. This event is clearly detectable in the Greenland ice cores, where the cooling seems to have been about half-way as severe as the Younger Dryas-to-Holocene difference (Alley et al., 1997; Mayewski et al., 1997). No detailed assessment of the speed of change involved seems to have been made within the literature (though it should be possible to make such assessments from the ice core record), but the short duration of these events at least suggests changes that took only a few decades or less to occur.
[Sorry for this being so long…]
Yes, Willis. Asking the right questions is the first step toward getting the right answers. Everyone here at WUWT is, in one way or another, aware that the wrong questions have been asked by those controlling the dialog on climate. And we others haven’t quite seen those right questions, either.
In simple systems it is easy to find the right questions. The more complex the system the more difficult it is to find those questions. And when questions are asked that have (seeming) non-answers or when they keep on not affecting the answers, it is time to ask, “Are we asking the right questions?”
The existing paradigm controls/dictates the questions. If the paradigm is wrong, the right questions will never get asked.
Thinking outside the box of a current paradigm that is getting us nowhere is the only way to break out of the box and get to where the right questions can be asked. It isn’t that all of a sudden we will see that the questions asked are better. When we are barely out of the box – the current paradigm – our questions are still being affected by our “in the box thinking.” When we are looking outside the box of the current paradigm we need to TRY to get way outside the paradigm, to ask, “What if _______ is the real case? What then?” Of course, in the full process anything inside or outside the paradigm still has to then be falsifiable and pass.
To ask such questions as “What would a sea spray droplet do?” or “What if the system is acting like an intelligence of its own?” IS a way of breaking out.
Good questions lead to answers – but that can happen only if we can recognize when the answers are worth a damn.
– – –
The Reductionist approach to science has worked for some time now, so we can’t really blame the climate guys for thinking that forcings. Reductionist, bottom-up, always looks for forcings, because in Reductionism the whole is always the sum of the parts. “When you do A, then B follows” thinking means that they are thinking that “If B, then there must be an A causing it.”
But can Reductionist thinking even work when addressing chaotic systems? When everything affects everything else, where is the bottom? What are the starting points? What are the pieces of which the whole is made, when A flows into B flows into C flows into D, . . . into A, and it all happens in blendings, not discrete steps? And which is the first?
As an engineer I know that even in the very discrete cause-and-effect world of machines the questions can be hard to find, and when working with the wrong question(s) the right answer is not going to show up.
So, yes, what should be happening is not a Reductionist approach (which is getting no one much of anywhere) but a Brainstorming Session, where all questions are on the table, where no judgments are made. New questions may not in themselves be the right questions, but they can LEAD to the right questions.
Look at all the areas in which questions have been asked – tree rings, ice cores, corals, SST, AMO, PDO, ENSO, Laurentian ice sheet melting, UHI, cosmic rays . . . on and on. Right questions are NOT that easy to come by.
Without the right questions, the right answers are impossible.
At this point, who knows what the right questions are? It is clear that continuing to ask the same ones and expecting them to inform us properly is insanity.
With such an enormous chaotic system, we are – so far – in over our heads. Finding the right paradigm which will dictate better questions is the way to go. Maybe we can’t find that better paradigm until some of the right questions fall out of the sky on us.
Go, Willis. Keep asking. If nothing else, you are brainstorming and you might lead someone else to ask the right first question.
Maybe you already have. Maybe the system itself acts like an intelligent, self-regulating being. If we rule that out, we may be ruling out ever understanding it. I’ve seen so many times where researchers say that we just don’t have the computing power, that the complexity is too much for our computers. Our computers, however, are built on the Reductionist principle. Maybe that in itself is the roadblock.
If the system is in itself intelligent (in a way we can’t fathom or accept now), by accepting that as a possibility, we might find that first right question that opens up the floodgates.
How do stem cells know what type cells to become? DNA is a Reductionist fundamental. But stem cells are directed by something to become one type of cell in one part of the body and another in another part of the body, and can be ANY type of cell. The directing of which to be – is that Reductionist? Does it come from protrusions on neighboring cells that trigger the stem cell? Or does the gestalt of the body act in a coordinated way, informing organs when to do what and stem cells to become whatever? In fact, what IS the thing we call the autonomic nervous system, or the subconscious, too? Are they intelligences, regulating and informing?
Is climate the same?
Are there intelligences existing that Reductionism doesn’t allow for, and which are beyond it?
Are these too metaphysical of questions to be asking? In a Reductionist world like science is now, certainly. But is Reductionism holding back science in this case? The scientists – deep in the Reductionist paradigm – may be the wrong ones to ask. Metaphysicians are not the ones to ask, either, because they don’t have their feet on the ground enough.
Willis, you are posting an entirely new start here. Let’s hope you are triggering a bit of a revolution. New sciences may be possible out of it, maybe new maths. You may be opening Pandora’s Box. But until it is opened, no sense can be made of chaos or chaotic systems. The science is inadequate at present. The math is, too. The modelling programs cannot be written without adequate math and paradigms. Some day the models WILL exist. But not till the underlying system intelligence is found – WAY outside the present (non-Pandora’s) box.
Steve Garcia
Alfred Alexander says:
February 9, 2013 at 2:59 am
Perish the thought, I have absolutely no desire to ban Steven. He’s one of the good guys, and a friend. He just drives me spare with his posting technique. It’s a shame because he is a really smart guy and his science-fu is generally strong.
But when he comes in, drops a one-liner and leaves, I want to tear my hair out … or more usually, tear his hair out.
In general, this site is light on banning. I think William Connelley is still banned, as is jae, but noboby gets banned for just being a jerk, you’ve got to get into pushing some serious abuse to get 86ed .
And Mosher has never done anything of that sort, in fact I’ve probably abused him (for his posting technique) more than the other way around.
Finally, like you, I’ve learned things from Steven.
So no, set your mind at ease, Mosh is not going anywhere, and I do hope he comes back here and explains his one-liner.
w.
@ lgl (February 9, 2013 at 10:03 am)
Thanks for the clarification. I also managed to find the following:
http://www.sciencebits.com/files/pictures/research/calorimeter/calorimeter2.gif
(from: http://www.sciencebits.com/calorimeter )
Why are some solar-terrestrial time series truncated at ~1926 even though they go back many decades further?
I illustrated a phase shift in solar-terrestrial resonance quite some time ago, but I didn’t emphasize this land-ocean longitudinal framework:
Chen, T.-C.; & Wu, K.-D. (1992). Semi-annual oscillation of the global divergent circulation. Tellus 44A, 357-365.
http://www.tellusa.net/index.php/tellusa/article/viewFile/14967/16781
Some help visualizing the longitudinal coordinates of aa & extra-aa:
http://www.openstreetmap.org/?minlon=60&minlat=-7&maxlon=240&maxlat=7&box=yes
Many years ago, in a book by James Gleick, (Chaos, Making a New Science) I was introduced to Chaos in the scientific term. One of the key points made was that Chaos was self regulating. If it wasn’t, we would never have evolved or survived as a human race. Since then I have observed
Chaos at work in all aspects of life and in my own profession, medicine. Willis is a favorite of mine and this post is yet another example of Chaos at work. (Ashbaugh, DG Chaos in Health Care, Pharos of AOA Medical Society, 56(Winter)17-21, 1993)
Greg Goodman says:
February 9, 2013 at 1:57 am (Edit)
Well, it may be an incorrect memory from an earlier time … I had based it on accounts I have read of the war, which mostly said that (in Europe, at least) the winters were long and hard … and on the (now probably discredited) drop in SSTs. Hang on …
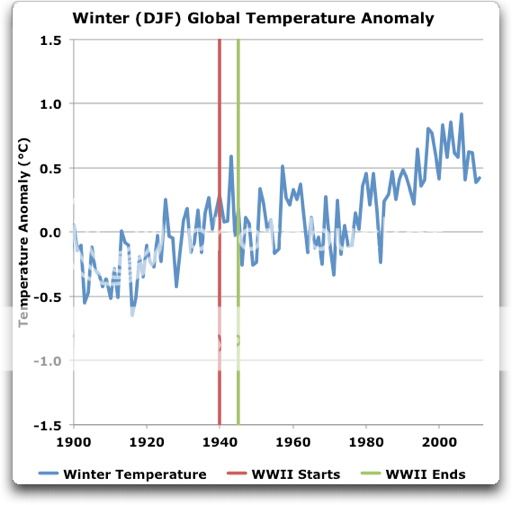
…
…
Well, bust my buttons, that’s another urban legend that’s dead … the WWII period was not uncommonly cold.
Color me wrong … but at least that improves the odds that the “oil-on-the-water” theory is correct.
w.
For anyone wondering about many of the concepts of the unpredictability and self-regulating nature of weather should study chaos theory. The book “Chaos, The Making of a New Science” by James Gleick, is a nicely done introduction. Many of the things that people call “random” are, in fact, not random at all, but artifacts of chaotic system behavior. One of the most interesting aspects of chaotic systems is self-regulation, and the way that bifurcation occurs at increasing internal feedback energy. Another aspect is that chaotic systems are impossibly difficult to understand in detail; individual component mechanisms (first principle physics) are real, but the result is very often counterintuitive; in short, the system is non-linear to high degree.
I find compelling Willis’ ideas here for one of the inner mechanisms of the heat engine that makes the climate system work. One may not agree, but hey, at least here is some logical thinking based on scientific first principles. That beats politics and zealotry every time. Well done, Willis.
Let’s see, degrees K, degrees C: same unit size, but different scales. Heat engines must be analysed using absolute temperature; so earth’s temperature analysed in deg. K is correct. But it is clear that the relevant regulation mechanism depends strongly on properties of water in transition from solid to liquid to vapor phases, and since the boundary system pressure is more or less never greater than one atmosphere, the regulating phenomenon occur nicely in the middling deg C range.
The real interesting thing to work with here isn’t actually temperature, but heat. Temperature is the result of heat, but various substances have different capacities for heat at given temperature. Substances at phase change can involve enormous quantities of heat with little temperature change. The heat content of water changes massively between different phases. The transition from solid to vapor phases of water substance involves huge amounts of energy, much larger than simply changing a given mass one degree within a given phase. So part of the self-regulating nature of the earth is tied up simply with the thermal properties of water in the evaporation and condensation cycle, and at colder temperature the heat of fusion. Given the changes in albedo due to the formation of clouds, the fact that 2/3 of the earth’s surface is convered by water, and the operating system pressure, the idea that the earth’s average temperature is self-regulating to high precision should not be too surprising. That it is self-regulating should be obvious.
The premise is that the earth’s average temperature is controlled by the feedback of cloud formation more than anything else, and that this feedback is strong because of the properties of water. The variance of albedo is the regulator, since that determines the actual energy absorbed by the earth’s mass that results in a given average temperature. This view means that things that intrinsically affect the way clouds form (either directly or indirectly) change the operating setpoint of the feedback mechanism, and that is what changes the average temperature. Where the variance in input energy is small, it must follow that the variance in albedo is small. With small variance, time spectral analysis of the system is difficult because the entire system is chaotic; there are few periodicies beyond the daily and seasonal cycles and the remainders are not very stable. There are too many variables and influences to get good linear cause-effect analysis that lead to the necessity or ability to do anything about it.
The earth’s climate system is apparently at a chaotic system feedback energy that at least two stable bifurcation states exist. One is the ice age level, and the other is the present pleasant interglacial. No one really knows what causes the transition between these states (and I am not interested in running the experiment!), but the fact that relative temperature stability exists in both states can be explained by the same mechanism, which is the variance in albedo to small changes in equilibrium. In the ice age state the ice covering the surface of the earth increases the average albedo without clouds; so it makes some sense that the average stable temperature is lower. How the earth goes from one climate state to another is the really big question. I think our present obsession with climate change is mainly political.
That, and 25 cents American will buy you a cup of coffee where I work.
-BillR
oldfossil says:
February 9, 2013 at 3:35 am
Please, oldfossil, please continue to give my posts a miss, your presence doesn’t move the conversation in any direction but down. Mosh and I are friends, and his posting style drives me nuts. So I bug him about it, and he gives me grief in return.
Why the hell should you care how I relate to my friends? And more to the point, what on earth makes you think that I care in the slightest if some random anonymous internet popup without the balls to sign his name to his words approves of my actions? …
So I beg you … read my posts all you want, but don’t comment. It just makes you look really, really foolish, and I doubt that you are that clueless … but it sure make you look that way.
w.
Joe Born says:
February 9, 2013 at 5:00 am
Joe, as always good to hear from you … but dang, if folks can’t handle the idea of sand dunes and thunderstorms and dolphins as emergent phenomena, perhaps “hysteresis in ferromagnetic-core solenoids” or “bimodality in tunnel diodes” might not be the best alternative example for them … just sayin’ …
w.
Willis — when you published the first part of this series (emergent phenomena) I did wonder (sitting on ‘planes and in airports with little else to do) about the article you wrote explaining ENSO – for which I thank you, it had never been clear to me exactly how/why that worked – if it were not a temporary (in geological terms) phenomena.
It is only because of the current arrangement of the continents that it works like it does, funneling warm water off to the pole to radiate away the excess heat. What happens when if/when a gap opens where Central America currently is, for instance, and a lot of that water lows out into the Atlantic?
If your thesis is correct, and I suspect it may be, then one might expect some step-change in temperature to occur until some new phenomenon emerges to stabilize temperaturs at a new “normal”.
These sorts of changes must have happened in the past. It might be interesting to try to find evidence of predominant emergent phenomena in other stable states that have occurred in the past.
feet2thefire says:
February 9, 2013 at 11:01 am
[Sorry for this being so long…]
…
How do stem cells know what type cells to become? DNA is a Reductionist fundamental. But stem cells are directed by something to become one type of cell in one part of the body and another in another part of the body, and can be ANY type of cell. The directing of which to be – is that Reductionist? Does it come from protrusions on neighboring cells that trigger the stem cell? Or does the gestalt of the body act in a coordinated way, informing organs when to do what and stem cells to become whatever? In fact, what IS the thing we call the autonomic nervous system, or the subconscious, too? Are they intelligences, regulating and informing?
John Gribben in his book “Deep Simplicity”, in the chapter “Earthquakes, Extinctions and Emergence” talks about Kauffman’s work on chaotic networks. You get a special sort of emergence from such networks, called “limit cycles”. Kauffman made a chaotic network of 30,000 nodes, programed a simple algorithm of interaction between nodes, and looked at all the pathways / configurations that arose. In “theory” there should be almost infinite possibilities. But in practice the “solutions” condensed to only a quite small number of states – the limit cycle. With 30,000 nodes, in Kauffman’s experiment, he got a limit cycle of 256 states.
Why is this signficant? There are about 30,000 genes in the human genome. There are about 256 cell types in the human body.
Kev-in-Uk says:
February 9, 2013 at 5:25 am
Great. Since you haven’t said what Steven’s “valid point” is, perhaps you could start there … he just waved his hand and said the magic word “inertia”. Perhaps you can deduce his point from that. I cannot, and your claiming that waving your hands and saying “inertia” is a “valid point” doesn’t help.
The naked claim of “inertia” goes nowhere, because there is no mechanism involved to bring the planet back on course. It’s like watching a Google driverless car going down the road and claiming that what keeps it on the centerline is “inertia”. Yes, cars and planets have lots of inertia, thermal and otherwise … and no, inertia is not enough to keep either one on the centerline of the road …
So I’m gonna wait until either you or Mosh explain to me the mechanism by which “thermal inertia” can e.g. bring the planet back to the same temperature after a meteor strike. At that point, we can agree that you and Steven have a valid point.
Here’s the thing. Steven is making two different claims:
1. The temperature is a linear function of the forcing.
2. The temperature can’t move up or down much, because “inertia” keeps it within a tenth of a percent over a century.
He (and perhaps you) need to take your pick, he can’t assert both.
Thanks for your reply,
w.
Greg Goodman says:
February 9, 2013 at 2:21 am
Damn, have a look at this too:
http://oi49.tinypic.com/xbfqtw.jpg
Again, I had concluded that the marked drop in cyclone energy during the war was that many non land-falling storms simply did not get noticed because of much reduced shipping patterns in the Atlantic.
Is that your oil too ?!
Willis, did you miss the ACE plots, that looks like a totally independent verification of your idea.
Close up , less filtering : http://oi47.tinypic.com/vg769i.jpg
BTW in Europe we tend to think of WWII starting in Sept 1939 not Dec 1941 😉
At least if you are looking for oil spills I think the german U-boats were in action before the US Navy.
Willis:
Short term oscillations/cycles, then longer term, then longer term.
Let’s not leave out consideration that the slow drift may in itself be a manifestation of even longer term oscillations/cycles. Within the Holocene we’ve had the Heinrich events, and within the Pleistocene were the Dansgaard-Oeschger events, fairly regular (in their scale approximately equal to PDOs and ENSOs in regularity). Are these all, then, thermostats that reverse some warming or cooling past certain boundaries and on different time scales, based not on time but on temperatures?
There is nothing that dictates the PDO and AMO are the longest cycles.
There is no agreed upon cause of the Dansgaard-Oeschger events and Heinrich events. The Laurentian Ice Sheet is believed to have playerd a part in the Younger-Dryas onset, but it seems impossible (to me) that the LIS was the cause of all the Heinrich events. It is possible the LIS at 13kya or so was an effect, not a cause. The cause may well have been simply the Heinrich thermostat kicking in again.
As to the drift, if longer term thermostat cycles exist, why wouldn’t they have what looks like drift? Drift or shift, if we look at it proportionally, it might be all a matter of time scale.
Steve Garcia
Willis, that DFJ data looks like it’s got the Folland’s folly post-war data rigging. Here is Atlantic maritime air temps from ICOADS v2.5
http://oi47.tinypic.com/hwj19d.jpg
Don’t know how well that fits you hypothesis but there looks to be warming of T-air fitting the period of probable oil spills in N. Atlantic.
harrydhuffman (@harrydhuffman) says:
February 9, 2013 at 6:20 am
The mean global temperature of the atmosphere is not an “emergent” phenomenon, but simply a designed one. No one has yet demonstrated to my professional scientific satisfaction that there has even been any real global (as opposed to regional) warming over the period of modern temperature records; it is entirely unclear that climate scientists are even properly measuring the true global mean surface temperature, that they may not after all have been merely identifying multidecadal ocean temperature oscillations as “global mean surface temperature”.
“Emergent phenomena” is just a false euphemism for a very real design of the world (as is every other design-denying term that has been invented by defenders of the undirected evolution paradigm, to avoid admitting the rather obvious designs scientists and laymen alike can observe just about any day, if their eyes and minds are open to recognizing them–look, for example, at the flowers, and their characteristic so-called “co-evolution” with animals and plants, a fundamental characteristic entirely counter to the expectations of, and thus disproving, undirected evolution). The next paradigm, as only my research has uncovered, is a rebirth of appreciation for the world design, as most recently redone by the “gods” of ancient worldwide myths, in a wholesale re-formation of the Earth’s surface (designed to communicate their deeds to any future mankind capable of seeing and interpreting it), only 10,000 to 20,000 years ago.
—————————–
Hi Harry,
What on earth are you talking about?
I could follow the first paragraph, although I’m not sure I agree. Whether or not scientists are ‘measuring’ the global mean surface temperature properly – I’d quibble here that there is no way to measure the global mean, but rather to compute it from measurements. If multidecadal ocean temperature oscillations strongly affect surface temperatures (which I personally think is pretty reasonable), then I don’t see what the distinction between this and ‘true’ global mean surface temp is about.
But paragraph number two leaves my head spinning. You’re packing an awful lot in there. No such thing as ’emergent phenomena’ because the world is designed. Undirected evolution is similarly false (presumably … what? There is a directed design to evolution?). A statement about flowers so called ‘co-evolution’ with animals and plants which leaves me mystified; what specifically are you talking about and how does this prove anything?
You’re gotten up to full speed in bewildering me by the last line. The next paradigm? As in ‘method of thinking about something’ paradigm I guess? …is a rebirth of appreciation for the world design, as most recently redone by the “gods” of the ancient worldwide myth…
…wait what?!? Are you saying the gods of ancient worldwide myth redid an appreciation of world design? Finally, WHAT is ‘in a wholesale re-formation of the Earth’s surface designed to communicate deeds to future mankind?’
I feel like I’m watching that Southpark episode with the lawyer using the ‘Chewbacca Defense’.
“It does NOT .. MAKE … sense.”
Help me out here.
Mark
Dr Pollack demonstrates in the above video his observations about the behavior of water. He sheds enormous new insight into the possibilities for energy flux pathways in our complex world (universe). I don’t claim to have answers but I’m pretty good at having questions. Dr. Pollack’s observations should at least challenge peoples understanding of what it is that they think they know. I urge all inquisitive minds to view the video (58 min).
I will attempt a thumbnail sketch of my thoughts. My chemistry prof in college 40 years ago referred to water as “Weird Water” or “Wacky Water”, “WW” for short, because it behaves in mysterious ways that were not understood.
As demonstrated by Dr. Pollack, it is indeed a marvelously complex medium. In the surface layer of water the molecules self organize into a zone with a liquid crystal structure. This zone excludes solutes. He calls it the Exclusion Zone or E Z water. Exposure to light (see 40:17 in film) causes this E Z to grow in thickness away from the surface, in other words the E Z is photo sensitive. The mind blower for me is that this E Z displays a measurable electrical charge and current flow. It is a liquid battery! A Water Battery! It is powered by photons. It is most absorbent in the IR range. It converts Electromagnetic Radiation into Electrostatic Charge. (I had to stop and duct tape my head back together!)
Now think again about lightning, that electrical phenomenon that we don’t really understand. At 38:30 in the film I think he explains the process. The E Z grows at the interface of water with air. A droplet will form a liquid crystal E Z, the molecules are constrained and can keep the protons mechanically separated from the negative charge, powered by IR. The cloud of droplets accumulate a charge until the kinetic motion of turbulence disrupts the crystals and the potential is discharged as lightning.
Now think again about oil on water as expounded upon by Willis. I speculate that perhaps the oil smooths the water allowing the E Z water to form. The E Z starts absorbing IR from the storm, converting it into Electrostatic charge and ‘grounding’ the storm if you will. These are questions not answers.
Now think of the E Z water forming under Ice and excluding ions. Talk about the potential for desalinization. (More duct tape.)
As to the implications for the CAGW debate, the energy balance calculations, and the ‘missing heat’: I may not know how the models are run or be conversant in the mathematics involved but I can spot unknown variables when I see them. In my opinion it is a Brave New World out there. Take a look at the slide at 44:02. He describes a new energy pathway: Sun > water> imparts energy for building order and separating charge.
Gotta go, more later perhaps.
-RG-
P.S We haven’t even gotten to photosynthesis yet!
P.P.S. More CO2 = more sugar!
I put a post on this site saying that I attempted to heat water from above and found that the water rejected the heat totally. The reason seems to be that surface tension blocks heat but how I don’t know. I did not realise that surface tension was far more complex than I thought. Your explanation makes sense. If surface tension blocks heat AGW is dead. What now.
Greg Goodman –
Nice graphs, but I would expect to see some variance during WWI, especially due to the unlimited submarine warfare decision of the German High Command in January 1917, not to mention the not-so-limited submarine warfare for most of the war prior. It wasn’t as long or as large – and it didn’t include the Pacific – but it seems it should at least show up somewhat if this premise is correct.
Also, the 1-year lag seems arbitrary, but it puts the two sets in phase pretty well, outside of my query above. Arbitrary is fine as a guess. Guesses are the first step in Richard Feynman’s scientific method – but such a guess would need an explanation/theory/mechanism. Got one for why it is one year? Why any lag at all?
Just askin’.
Steve Garcia
When the Milankovick cycles do their thing and the glaciers advance and retreat
I believe the proof shows forth that at the extremes,
at least, it is the sun.
For a long time I have used a mental model of the Earth’s atmosphere as a heat pipe with water working as working fluid. If a segment of the heat pipe near the cool end is taped with heat insulating tape (“green house” gas), the heat will be just dumped further down the pipe. If one studies the dynamics of heat pipes ( heat transport by mass transfer) a lot can be learned about the atmosphere/hydrosphere system. Here is a good explanation: http://www.ht.energy.lth.se/fileadmin/ht/Kurser/MVK160/2012/Per_Wallin.pdf
As for calming the waters. Fish oil flushed down the head every few minutes works well to keep the spindrift down, and helps somewhat with the smaller breaking seas.
f2f says: unlimited submarine warfare decision of the German High Command
“unlimited” here is merely a statement of intent, since it was obviously limited by by the number of submarines they had which was very limited in WWI
The one year lag was simply exploring the relationships in the data. It was the lag that seems to give the best correlation, though I did not determine that exactly. Since surface temps will need to rise quite a bit before there is enough energy to set up a major storm system there will necessarily be a considerable lag. Also since we are looking at 5 or 10 year variations of build up of both temperature and accumulated storm energy, I don’t think a year long lag is problematic.
In view of the sampling problems in both datasets , I’m actually amazed to see this level of correlation. It increases greatly the level of confidence I have that there is some genuine climatic signal to be found despite the data collection problems.
If Willis is correct and both the wartime rise in SST and air temps and apparently anomalous drip ACE can at least be accounted for by oil spillage that would be really interesting. Don’t know how that could be taken beyond the ‘interesting idea’ stage though.
Willis , thank you so much for your thought provoking searches for answers . Thank you Anthony and friends for the work you do to bring these discussions to light . The only regret I ever have about coming to this site is the time that it consumes . But I am more than rewarded in knowledge and often humor . Thank you all , posters and commenters alike .
@Willis said: “Thanks, Terry. An actual citation to such an actual correlation sunspots/grain prices would make your claim more than an anecdote.”
Having no first-hand knowledge, I rely on E.M. Smith Here are some summary pages discussing apparent periodicity, much of which is coincident with solar minimums.
http://chiefio.wordpress.com/?s=sun+weather
http://chiefio.wordpress.com/?s=planetary+angular+momentum
The sun’s role in your model is limited to providing the heat to drive the model. I was thinking of longer term variation. The drought/famine historic indicator is not perfect, but it does survive in the historic record where the instrument record is missing.
Regards,
Terry
@William Howard Astley February 9, 2013 at 10:58 am: –
A bit O/T, perhaps:
Your third link had an interesting feature, the alignment of solar max with the solar polar field strength. The solar max generally comes during the weakest portion of the solar polar field strength.
When comparing that to the well-known “butterfly pattern” of the sunspots, that indicates that the polar field strength is at its weakest when the sunspots are peaking. That should be a clue to what is going on inside the sun and what really causes the sunspots. Right now there is a hypothesis, maybe even a consensus, but it seems to me to be pretty speculative still.
I have to ask if the equatorial field strength is being measured or is even measured at all. If the greater overall field strength – like the butterfly pattern – cycles to the poles and then back to the equator (or nearly to each), it would be useful. Since the butterfly pattern starts at higher latitudes (early in the sunspot cycle) and then proceeds equator-wards with time, it does seem to be some sort of under-the-surface (possibly rotating) dynamo with one segment of the dynamo of great strength and that this greater “pole” of the “rotor” sweeps toward the equator and causes sunspots.as it sweeps through the mid-latitudes. That the sunspots rarely arise at the equator, it adds to my mental picture of a rotor, as the rotor would be subducting (going deeper) as it nears the equator. As the greater field force aims more toward the poles, it would show up on the chart as high levels – exactly when the sunspots are not showing up.
Someone has undoubtedly seen this link to the butterfly pattern, but it was nice seeing it myself. Even if I am wrong, it’s been a nice mental exercise.
Steve Garcia
Philip Peake says:
February 9, 2013 at 12:13 pm
Thanks, Phillip. Indeed, the slow changes in the location of the plates has had huge influence on the planet, including the closing of the Panama seaway (which may have set into motion the ice ages), and the fact that we have land at one pole and water at the other.
The climate system is constantly evolving to maximize heat flow to the poles plus turbulence. So it is not possible to guess which way that frog would jump if e.g. the Panama Seaway opened up again … but you can be sure that a) the frog would indeed jump, and b) the new jump will land on a place that tends to maximize heat flow plus turbulence given the physical conditions … and that may end us up warmer, colder, or oscillating between the two.
w.
phlogiston says:
February 9, 2013 at 12:17 pm
See the work of Nobel Laureate Christiane Nüsslein-Volhard
https://en.wikipedia.org/wiki/N%C3%BCsslein-Volhard
William C Rostron says:
February 9, 2013 at 11:55 am
Bill, thanks for your interesting thoughts. I would like to expand on your statement above, however, by pointing out that albedo control is only part of what regulates the energy absorbed by the earth’s mass.
The other part of the regulation is the active heat removal from the surface by such emergent phenomena as thunderstorms, dust devils, tornadoes, El Ninos, hurricanes, and the PDO and similar emergent long term quasi-cyclical phenomena.. These prevent the Earth’s mass from absorbing heat by steadily removing it to the upper levels of the atmosphere and to the poles and thence to space.
Best regards,
w.
otsar says:
February 9, 2013 at 1:56 pm
Not clear on that one … I know how a heat pipe works, and I’d say a thunderstorm considered from the surface to where the water first condenses could be considered a gravity-assisted wickless analogue of a heat pipe, with vapor flowing upwards and liquid flowing downwards … but I don’t think that’s what you are describing.
I do love the ocean, there’s always more to learn no matter how much time I’ve spent at sea. Nice trick, thanks,
w.
ferdberple says @ February 8, 2013 at 9:17 pm
This is pretty much Lovelock’s Gaia Hypothesis, which I don’t buy as “life” is not a coherent entity.
Also, do not forget that there have been occasional massive swings in “global temperature”. I think it is more important to explain those great variations, rather than the general stability.
DirkH
Feb 9, 2:55 pm
Christiane Nusslein-Volhard is without doubt a truly great geneticist, her association with the astonishing homeobox genes alone will ensure her immortality.
The 2013 split in the polar vortex seems to support your reasoning. The 2013 split in the polar vortex
Many thanks for this. I’m seriously impressed. Over the last decade, thinking about climate has been constrained by the way grants and publications affect careers. There aren’t many researchers willing to broaden their speculations like you’ve done above. The usual suspects will no doubt roll their eyes and get stuck into polishing their next predictions of doom and gloom. So be it. Anyone who’s genuinely curious about how climate works, though, will be intrigued by your suggestions. And it’ll only take a few to start building a theory around your speculation. Seriously, this sort of thinking is very much appreciated. It gives us hope.
Gail Combs says:
February 9, 2013 at 7:52 am
that’s kinda the thermal inertia point – that only the near surface millimetres and lower atmosphere suffer significant temperature changes and these temperatures (or more accurately their energy levels) are replenished by the sun in the daytime, and heat content of the land and oceans during the night (or at anytime the air temp drops below the level of the underlying strata). Hence, caves remain at amazingly stable temperatures. Ditto for the deep oceans but of course in oceans we have much more variaton due to subsea currents etc – but in terms of the ocean heat content/capacity – if you could average the temperature (much like we cannot average the surface air temps!) it would likely remain very static.
Willis Eschenbach says:
February 9, 2013 at 12:25 pm
>>The naked claim of “inertia” goes nowhere, because there is no mechanism involved to bring the planet back on course<<
You astounded me here but I think it is because we are at crossed lines?
I didn't think I was hand waving and I didn't think it would need further explanation. Of course there is a mechanism for the thermal inertia to bring the temperatures back on course – it's called heat transfer via conduction and in fluids/gases, it's called convection? Seriously, what else did you think it could be? A meteor strike (lets call it a medium sized one) will generate any
number of local changes to the climate system at that point – but lets concentrate solely on temperature – and assume that a few megatons or so of 'energy' is chucked up into the air and ignore all other effects (such as albedo changes, etc). Obviously this warms the air, which then transfers this energy to adjacent air, sea, land, etc, when the dust settles, this also transfers some 'heat' back to the ground/sea, etc. Now, I don't know the actual total thermal content or
capacity of the oceans for example – but I'd guess it is incredibly large and would take an awful lot of energy to heat it up (or cool it down) significantly? – hence, it acts (in the case of a meteor strike or other sudden energy input) as a 'sink', thereby spreading the energy out over its vast resources over some period of time. Why is that not a mechanism?
Anyone who has left the bathwater in for a long time knows how long it takes to cool – or, if they are as old as me, and had to top up a cool bath from a kettle – how many kettles are required to bring the heat back up. Now consider the oceans as a bloody big bath!
I assume you are familiar with night storage heaters, particularly the ones with fan assisted air circulation passing over heated bricks? You might just like to think of the Earths surface as a bloody big storage heater, and the Climate (as we know it) is the air moving around over the bricks. if the circulating air is hotter than the bricks, it will warm the bricks – if it's cooler it will cool the bricks – yes? Now, bolt a tank of water next to the bricks and you have a model 'ocean' – which the circulating air can pass over too!
you also said:
Here’s the thing. Steven is making two different claims:
1. The temperature is a linear function of the forcing.
2. The temperature can’t move up or down much, because “inertia” keeps it within a tenth of a percent over a century.
I can't speak for Moshers claims but I do think you are conflating measured air
temperatures with the massive thermal inertia of the planet (?) which can affect those air temperatures. I do not agree with the supposition that temperature has a linear relationship to
forcing – at least not in the concept of the massive thermal mass/inertia I am discussing here which can only really change over millenial timescales. What we are measuring (in terms of air temps) is the moving layer above the 'real' surface which comprises the sea and land. So, sure, a forcing change, eg from the sun, could/does cause a rise in that air temperature if and because
a: the forcing change is significant enough to cause a measurable change
and b: because the air mass being heated (or cooled) is relatively small (compared to the thermal mass of the oceans/land)
hence a temp/forcing relationship may well be expected to be linear to a small thermal mass i.e. the air (if all other factors are fairly static)
However that forcing change is minor compared to the total heat content of the land and sea, and would need to be sustained for an awful long time for it to be subsequently transferred to the sea/land surface and thence to the 'depths'. This, of course is the reason we have massive diurnal variation, but limited 'net' variation in average temperature – which I presume is what the second claim is considering?
Stephen Skinner says:
February 9, 2013 at 4:40 am
Is it only clouds? The highest heat ever recorded was about 57C, which I expect would have been under a blue sky with the sun overhead.
The highest surface temperatures on Earth occur in the monsoonal zones (and the very hottest in below sea level depressions in these zones).
Perhaps once a year, here in Perth we get a similar phenomena and those are always our hottest days (over 40C). What happens is the monsoon rains reach the interior north east of here, then we get winds from the north east. Normally these winds are hot and dry, but after the interior rains the winds are hot and humid. Temperatures are 3C to 5C hotter than a dry NE wind day, and the nights even hotter. This BTW, convinces me the water vapour GHE is real and substantial.
The interesting part is that on these hot humid days we normally have horizon to horizon blue skies all day. Substantial convection must be occuring, and the missing component for those towering cumulonimbus clouds is humidity above the ground. There is not enough of it to form clouds.
In monsoon zones they talk about the ‘build up’ to the monsoon and what they are referring to is the build up of humidity drawn from the humid tropics necessary to form clouds and then precipitation. Were these zones to get hotter it would just draw in more humid tropical air faster, and the monsoon arrive earlier.
So, to add to Willis’s analysis. Not only is there local scale thermoregulation from thunderstorms, there is regional scale thermoregulation in the monsoon process.
Anyone who is bothered by Willis’ emphasis on “emergent phenomena” can ignore it. Willis’ first rate description of how clouds and thunderstorms form and how such phenomena affect temperature is chock full of descriptions of natural regularities sometimes explicitly described and sometimes implicitly described. These natural regularities, along with many others, are what will make up a mature climate science in a hundred years or so.
Climate scientists should move their funds from supercomputers to empirical research on the phenomena that Willis has described. Willis does not have the resources to undertake the systematic work of formulating hypotheses, deducing detailed consequences, testing them, revising them and repeating. However, he has the best ideas in climate science.
Willis wants to treat thunderstorms and related phenomena as control mechanisms. I have no problem with that. It is an idea that organizes the empirical work nicely. We should not delay the empirical work while we worry about the metaphysics of emergence and control mechanisms.
I have said for years that Mosher would not recognize an empirical hypothesis if it bit him. I am sure that he will prove me correct in his discussion of Willis’ work. Expect Mosher to draw down upon us all the wrath of Trenberthian “radiation only theory,” the supercomputer, and statistical trends that override the data that they are based on.
Willis,
I use the mental heat pipe model as a very simple model for the entire atmosphere/hydrosphere. The heat is deposited at the low latitudes and dumped at the high latitudes with losses in between. The height of the pipe is about 20 Km, with a length of 10K Km. The physical properties (enthalpy, phase changes, etc) of the major working fluid determines the stable point, and ability to regulate temperature. When the heat gradient builds up, the transport velocity increases and attempts to even out the heat distribution. The heat distribution affects the atmospheric column vertically and horizontally. Vertically the condensation of water vapor radiates some of the heat out to space. Horizontally the heat is transported to colder regions where additional mechanisms radiate the heat out to space. I also think of the atmosphere/hydrosphere as two loosely coupled heat pipes: the fast heat pipe being the atmosphere with low thermal/mass inertia and the slow one being the oceanic circulation with high thermal/mass inertia. The bottom line is that heat is deposited at low latitudes and radiated out to space at high latitudes with losses in between. The heat is transported by mass transfer, induced by gravity/density gradients, produced by the heat. Decreasing the ability of the system to radiate out to space (“green house gases”) will increase the transport velocity and move the area where heat is radiated out to space towards higher latitudes. The green house gases, of which water is the major one, are the equivalent of wrapping some thermal insulating tape on the heat pipe in the middle, in this model.
Willis,
An interesting sub-plot would be a more in depth analysis on fish schooling vs. shoaling and how the mechanisms work.
Shoaling fish swim around together.
It’s said that schooling fish swim together and also align themselves with the others’ orientation – but certain fish in the group that have less strong behaviour in that regard, and are the ones which lead change in group orientation. The obvious fun is had by equating less strong schooling behaviour with less intelligence – the stupidest fish is the leader.
You might appreciate Kevin Kelly’s concept of “distributed being.”
” There are two extreme ways to structure “moreness.” At one extreme, you can construct a system as a long string of sequential operations, such as we do in a meandering factory assembly line. The internal logic of a clock as it measures off time by a complicated parade of movements is the archetype of a sequential system. Most mechanical systems follow the clock.
At the other far extreme, we find many systems ordered as a patchwork of parallel operations, very much as in the neural network of a brain or in a colony of ants. Action in these systems proceeds in a messy cascade of interdependent events. Instead of the discrete ticks of cause and effect that run a clock, a thousand clock springs try to simultaneously run a parallel system. ”
and WUWT readers will enjoy title on this: “Hive Mind”
http://www.kk.org/outofcontrol/ch2-f.html
Willis said: ..“… Moving on, here’s an off-the-wall possibility for human induced change—oil on the global oceans. It only takes the thinnest, almost monomolecular layer of oil on water to change the surface tension, and we’ve added lots of it. This reduces evaporation in two ways. It reduces evaporation directly by reducing the amount of water in contact with the air..”
It is a remarkable thing that the “WW2 SST glitch” has been so readily written off as a “glitch”.
Most of the merchant shipping losses were in the Atlantic regions (maps of each sinking here):
http://www.secondworldwar.org.uk/merchantnavy.html Maps of 1942 losses here (amazing, worth a look, puts it in perspective)
US merchant shipping losses here in detail: http://www.usmm.org/shipsunkdamaged.html ” … the U.S. Merchant Marine suffered the highest rate of casualties of any service in World War II. Officially, a total of 1,554 ships were sunk due to war conditions…”
…more here… http://www.battleships-cruisers.co.uk/merchant_navy_losses.htm
Details of US Merchant ship losses here: http://www.usmm.org/shipsunkdamaged.html (an amazing number were sunk along the east coasts of the Americas).
Perhaps the greatest numbers of naval losses were in the Pacific? – Here are US losses: http://en.wikipedia.org/wiki/List_of_United_States_Navy_losses_in_World_War_II
More here… http://usspennsylvania.org/NavalLosses.htm
This is very incomplete, there are many other links, but my connection is too slow, more so than usual today…..
By the way, I did not realize how poorly treated these sailors were early in the war… terrible stuff:
It seems to me that we’re ignoring the elephant in the room, or in this case, the whale. We’re acting as though ocean processes remain unchanged when you drastically reduce populations of the biggest single creatures in the ocean.
Now it’s possible that taking whales largely out of the equation had no temperature-significant impact on the oceans, but I find that hard to believe. We’re talking creatures that
– dive to great depth, probably transporting some amounts of heat with them to lower levels, keeping the water at various levels of the ocean more mixed than it would otherwise be.
– spray large amounts of salt water and particulates into the air over the ocean when they spout.
– have a huge impact on plankton
– sequester (at least temporarily) huge amounts of carbon at the bottom of the ocean when they die and their carcasses sink
– provide food for the little-known ecosystems at the bottom of the ocean when they die.
There is bound to be some impact. Whether it’s significant or not, I don’t know, but it’s something that needs to get looked at.
Following up on that:
For that matter, what impact does overfishing in general have on ocean temperature-related process? Probably a lot, much of it subtle and twisty. There was an experiment back in the late 1980s where scientists introduced bass to some lakes but didn’t in others and discovered that the presence or absence of the bass caused CO2 emissions from the lakes to vary by about five percent. Apparently, the bass ate slightly smaller fish, which in turn ate even smaller fish that ate plankton feeders. As I recall it, bass equaled more small plankton-feeders, which meant less plankton and more CO2 emissions. Does something similar happen in over-fished oceans? It would be interesting to find out.
I did come across one person who argued that overfishing was a major factor in CO2 balance, and claimed that the cold World War II years were the result of a temporary recovery in fish stocks because of a drastic drop in fishing during the war years, but I wasn’t too impressed with the evidence offered. Nevertheless, it’s an avenue for research.
Then you have nitrogen runoff from farming, which can cause huge plankton blooms. What does that do to ocean processes?
It seems to me that industrial CO2 has become the scape-goat for a lot of other ecologically unsound practices that are bound to have some impact on how planetary systems work.
otsar says:
February 9, 2013 at 6:26 pm
Thanks, otsar. I beg to differ. A heat pipe works by condensation in one place and evaporation in another, with the working fluid that is moving the heat circulating between hot and cold. This only describes the very bottom part of the thunderstorm. Above that, it’s a very different animal.
I don’t like “models” without as exact a correspondence as I can find. For the upper part of a thunderstorm, you are talking something that moves a lot of heat, but in the manner of a chimney, without significant evaporation or condensation (basically, it’s all frozen).
And that is a chimney, not a heat pipe.
w.
Re the inertia issue:
Always worth casting an eye down the list of specific heat capacity of various substances; in that regard there is nothing else quite like water on this planet, in its huge heat capacity, its fairly high density, its sheer quantity, and its ‘pooling’ in huge concise masses. Not to mention its other quirks.
http://en.wikipedia.org/wiki/Heat_capacity
See “Table of specific heat capacities at 25 °C (298 K) …”
A very thought provoking article. I would say, though, that after the great oceanic heat sink, followed by the effects of Terra Firma, clouds/greenhouse gases enjoy an important tertiary thermostatic effect and with their abundant water content, a prompter acting regulatory one.
I work with finely engineered heat/pressure systems, and extrapolating from them to the earth’s atmospheric system, I am gaining an appreciation for the thermal/pressure gradients between the polar regions and the equator. When the earth is at aphelion, at its maximum point of precession, and its orbital eccentricity takes it furthest from the sun, there will be considerably less solar insolation in the polar latitudes causing larger thermal/pressure gradients between the poles and the equator, thus causing greatly enhanced moisture advection from the equator toward the polar regions, and that coupled with the diminished temperatures at higher latitudes, an increase in ice accumulation.
Really liked the article as I do many on this site it reinforces my reasons why I play golf!
In reply to feet2thefire and to Leif Svalgaard
feet2thefire says:
February 9, 2013 at 2:44 pm
@William Howard Astley February 9, 2013 at 10:58 am: –
Your third link had an interesting feature, the alignment of solar max with the solar polar field strength. The solar max generally comes during the weakest portion of the solar polar field strength…
William:
I need to be more specific, less cryptic.
As solar cycle 24 develops there will be observational evidence to validate or reject the hypothesis stated below. I am presenting an outline of the hypothesis as I believe there will be observational evidence to support it. If there is no observation evidence to support this hypothesis, there will be nothing more to discuss.
Based on the paleo record and the current solar observations it appears, if I understand the mechanisms and what is currently happening to the sun, we are going to experience a Heinrich event.
If you look at my above comment there is a link to a series of papers which notes there is a cyclic 1500 year climate change that correlates with cosmogenic isotope changes and there is a 6000 to 8000 year abrupt climate change (Heinrich event) that also correlates with solar magnetic cycle changes. I have also provided links in this forum to papers that note there are archeomagnetic field changes (earth’s geomagnetic field abruptly changes in orientation by 10 to 15 degrees that correlate with the cyclic gradual climate changes and there are geomagnetic excursions (geomagnetic field intensity drops by a factor of 3 to 5) that correlate with glacial/interglacial termination.) I have roughly a couple of hundred papers concerning the mechanism by which it hypothesized that a restart to the solar magnetic cycle after the solar magnetic cycle has been interrupted causes the cyclic Heinrich event on the earth. The orbital configuration of the earth when the solar magnetic cycle restart occurs determines/modulates how the solar cycle restart affects the geomagnetic field. It is the geomagnetic field change that causes the abrupt climate change and the long term climate change.
Leif Svalgaard mentioned the self dynamo mechanism and stated that it is not possible for the self dynamo mechanism if it is interrupted to restart. That comment is correct.
I noted however that solar magnetic field and earth’s magnetic field are not created by a self dynamo mechanism.
Svalgaard asked me to elaborate. This is an outline for a general forum which is concerned with climate change, not astrophysics. I can present a detailed nuanced logical argument to support the assertion using astrophysical observations and solar observations. There are groups of astrophysics specialists that are working on a theory line to explain sets of astrophysical anomalous observations that leads to this same mechanism. The mechanism is fundamental to the properties and evolution of spiral galaxies and large scale cosmological structure. It has been found that spiral galaxy properties are not random, that they are tightly controlled by a single parameter. It has been found that spiral galaxy evolve in a controlled manner with time. It has been found that quasar maximum and minimum luminosity vary in a controlled manner with redshift which is not physically possible with the standard quasar model, and so on.
An electric current will be induced in a rotating conductive disc if the conductive disc passes through a magnetic field. That is a dynamo. A self exciting dynamo is a theoretical entity. It does not exist in reality. A self exciting dynamo is hypothesized to create its own magnetic field. (i.e. The self exciting dynamo is assumed to have an initial magnetic field at the time the object forms. That initial magnetic field is hypothesized to be sustained by convection motion of the conductive fluid. Experimentally and theoretically that is physically impossible, within a few million years (earth) or with a 100 million years (sun) the self dynamo magnetic field drops to zero.
Let’s set up a mind experiment to try to understand a self generating dynamo. Imagine a boiling pot of salt water on the stove; now place a very strong permanent magnetic into the boiling pot of water. There will be an electric current generated in the boiling water which will resist the conductive motion of the salt water and that will resist the magnetic field of the strong permanent magnetic. Remove the permanent magnetic. The electric field in the boil water will decay to zero. The reason the magnetic field drops to zero is the current generated in the conductive salt water opposes the motion of the fluid and opposes the induced magnetic field and there is energy dissipated in conductive fluid to the resistance of the fluid to the electrical current flow. Maxwell’s equations resist changes. There is a counter emf generated.
This specific experiment has been done with liquid sodium in a lab with a rotating sphere to replicate the convection movement in the earth and the rotation of the earth. When the permanent magnetic/external electromagnetic was removed the field in the experiment decayed to zero.
The theoretical computer simulations of the earth’s magnetic field also decay to zero, if the simulation is run to simulate millions of years.
The geomagnetic field and solar magnetic field are not generated by self exciting dynamos. Cyclic solar changes create a charge in balance in the sun which creates the solar magnetic field and which creates the geomagnetic field.
Massive objects when they collapse create a counter acting force which arrests the collapse. The object that forms when a super nova collapses or any other massive object collapses is an active object. There are a series of published papers that discuss quasar observational anomalies that support this assertion.
An observation that would support the above assertion is the luminosity and the spectrum of comet Ison. First pass comet based on historical observations before the space age and modern telescopes are rumored to be much brighter than physically possible if the comet luminosity has caused by the solar wind striking the comet gas.
http://www.space.com/19656-comet-ison-nasa-spacecraft-photos.html
Comet ISON has been the focus of much anticipation among scientists and stargazers because of its potential to put on a spectacular display in late November, when it makes its closest approach to the sun. Some forecasts predict the comet could shine brighter than the full moon. As of mid-January, the comet’s tail was more than 40,000 miles (64,400 km).
A NASA spacecraft has captured its first photos of comet ISON, an icy wanderer that some scientists say could dazzle as a “comet of the century” when it swings through the inner solar system later this year.
William: Gregory Ryskin hypothesis that the ocean currents are fundamental to the generation of the geomagnetic field is not correct. Ryskin and geomagnetic specialist analysis have however found geomagnetic field changes that physically impossible (too rapid) to have been created by convection current changes or any other change in the earth’s core. (The earth’s mantle is conductive and resists rapid field changes.)
http://www.iop.org/News/news_35352.html
The Earth’s magnetic field remains a charged mystery
400 years of discussion and we’re still not sure what creates the Earth’s magnetic field, and thus the magnetosphere, despite the importance of the latter as the only buffer between us and deadly solar wind of charged particles (made up of electrons and protons). New research raises question marks about the forces behind the magnetic field and the structure of Earth itself…. ….Professor Gregory Ryskin from the School of Engineering and Applied Science at Northwestern University in Illinois, US, has defied the long-standing convention by applying equations from magnetohydrodynamics to our oceans’ salt water (which conducts electricity) and found that the long-term changes (the secular variation) in the Earth’s main magnetic field are possibly induced by our oceans’ circulation.
With calculations thus confirming Ryskin’s suspicions, there were also time and space correlations – specific indications of the integral relationship between the oceans and our magnetospheric buffer. For example, researchers had recorded changes in the intensity of current circulation in the North Atlantic; Ryskin shows that these appear strongly correlated with sharp changes in the rate of geomagnetic secular variation (“geomagnetic jerks”).
Tim Smith, senior publisher of the New Journal of Physics, said, “This article is controversial and will no doubt cause vigorous debate, and possibly strong opposition, from some parts of the geomagnetism community. As the author acknowledges, the results by no means constitute a proof but they do suggest the need for further research into the possibility of a direct connection between ocean flow and the secular variation of the geomagnetic field.”
In the early 1920s, Einstein highlighted the large challenge that understanding our Magnetosphere poses. It was later suggested that the Earth’s magnetic field could be a result of the flow of electrically-conducting fluid deep inside the Earth acting as a dynamo.
In the second half of the twentieth century, the dynamo theory, describing the process through which a rotating, convecting, and electrically conducting fluid acts to maintain a magnetic field, was used to explain how hot iron in the outer core of the Earth creates a magnetosphere.
The journal paper also raises questions about the structure of our Earth’s core.
Familiar text book images that illustrate a flow of hot and highly electrically-conducting fluid at the core of the Earth are based on conjecture and could now be rendered invalid. As the flow of fluids at the Earth’s core cannot be measured or observed, theories about changes in the magnetosphere have been used, inversely, to infer the existence of such flow at the core of the Earth….. ….While Ryskin’s research looks only at long-term changes in the Earth’s magnetic field, he points out that, “If secular variation is caused by the ocean flow, the entire concept of the dynamo operating in the Earth’s core is called into question: there exists no other evidence of hydrodynamic flow in the core.”
http://geosci.uchicago.edu/~rtp1/BardPapers/responseCourtillotEPSL07.pdf
Also, we wish to recall that evidence of a correlation between archeomagnetic jerks and cooling events (in a region extending from the eastern North Atlantic to the Middle East) now covers a period of 5 millenia and involves 10 events (see f.i. Figure 1 of Gallet and Genevey, 2007). The climatic record uses a combination of results from Bond et al (2001), history of Swiss glaciers (Holzhauser et al, 2005) and historical accounts reviewed by Le Roy Ladurie (2004). Recent high-resolution paleomagnetic records (e.g. Snowball and Sandgren, 2004; St-Onge et al., 2003) and global geomagnetic field modeling (Korte and Constable, 2006) support the idea that part of the centennial-scale fluctuations in 14C production may have been influenced by previously unmodeled rapid dipole field variations. In any case, the relationship between climate, the Sun and the geomagnetic field could be more complex than previously imagined. And the previous points allow the possibility for some connection between the geomagnetic field and climate over these time scales.
Point 4: We first reiterate the fact that the “claims” made in our paper regarding correlations between cooling periods and archeomagnetic jerks were actually put forward by Gallet et al (2005, 2006). We do note that the causal relationship between cosmic ray flux and cloud cover suggested by Marsh and Svensmark (2000) would result in a correlation opposite to the one we find if the field geometry were axial and dipolar and this is precisely why we propose a mechanism of dipole tilt or non dipole geometry to interpret our observations. Gallet et al (2005) write: “ Another hypothesis is to assume that the incoming charged particles are deflected towards the poles, where the overall low humidity level due to cold temperatures limits cloud formation. If archeomagnetic jerks indeed correspond to periods of strongly inclined dipole, then the charged particles would interact with more humid air from lower latitude environments, leading to significantly larger cloud production and cooling.” And if this happens, there is no need to “overcome the more direct effect”, as (mis)understood by BD07 (who seem to understand that a growing axial dipole is superimposed on a tilted dipole, which is not the case).
http://eprints.whiterose.ac.uk/416/
Is the geodynamo process intrinsically unstable?
Recent palaeomagnetic studies suggest that excursions of the geomagnetic field, during which the intensity drops suddenly by a factor of 5 to 10 and the local direction changes dramatically, are more common than previously expected. The `normal’ state of the geomagnetic field, dominated by an axial dipole, seems to be interrupted every 30 to 100 kyr; it may not therefore be as stable as we thought.
Recent studies suggest that the Earth’s magnetic field has fallen dramatically in magnitude and changed direction repeatedly since the last reversal 700 kyr ago (Langereis et al. 1997; Lund et al. 1998). These important results paint a rather different picture of the long-term behaviour of the field from the conventional one of a steady dipole reversing at random intervals: instead, the field appears to spend up to 20 per cent of its time in a weak, non-dipole state (Lund et al. 1998).
you may not have the answers, but I think you are beginning to pose the right questions. Dont stop this train of thought.
By the way my understanding of Svensmark et al is that it has little to do with the sun. Cosmic rays of sufficient energy to cause cloud nucleation are not much affected by the solar wind. They are more about galactic events.
hence his linkage between global climate change an passage through more or less populated parts of the galaxy.
markx says:
February 9, 2013 at 8:31 pm
…..US merchant shipping losses here in detail: http://www.usmm.org/shipsunkdamaged.html ” … the U.S. Merchant Marine suffered the highest rate of casualties of any service in World War II. Officially, a total of 1,554 ships were sunk due to war conditions…”
>>>>>>>>>>>>>>>>>>>>>>>>>>>>>>>>>
OT:
The irony is the U.S. Merchant Marine was commandeered by the US military to carry war time supplies. My Father-in-law, a captain in the U.S. Merchant Marine carried not only arms, munitions but also soldiers and his ship was armed. The ships were organized in convoys and were ordered to stay in position which made them easy to pick off. When attacked my Father-in-law noticed they were torpedoing every other ship and he was targeted. He survived by breaking position.
So as you pointed out the U.S. Merchant Marine was very much in the war. Finally in 2011 after most of them were long dead they were FINALLY granted war veteran status and benefits.
Willis points out the process of the heat engine pumping heat towards the poles. This would explain why there has been more warming at the polar regions, especially the Arctic and consequent loss of ice cover at the the latter.
However, this brings up the subject of another negative feedback, that is not yet recognised by mainstream. Indeed, they are still _assuming_ there will be a positive feedback leading to a ‘tipping point’, despite the lack of observable proof that this is happening in, in fact, evidence to the contrary.
http://oi46.tinypic.com/r7uets.jpg
This plot shows rate of change of ice cover in Arctic, ie zero represents stability, neither gain nor loss. Not catastrophic collapse, nor recovery of earlier levels of ice cover but stability, equilibrium.
It should be noted that this uses ALL available data, not just one day per year in September.
If we look at ALL the data and apply a 365 day filter to remove the huge annual variation, we get something that tell us more about energy budget and rate of change than getting exited about one day per year and ignoring 364 out of each 365 daily data points.
Here we can see the “accelerating loss of ice” that had everyone rightly concerned. It lasted roughly from 1997 to 2007.
We also see North Atlantic temperature taken from the NOAA AMO record. I should emphasis that this is the real SST, not the detrended AMO. They provide AMO and what they took out, I had to add it back in. We see recent Atlantic sea temperature rose over the same period and now seems to have stopped rising. (The “pause” of global warming, no doubt.)
Despite SST remaining warmer, ice extent seems to have settled back to oscillate around zero change.
Now it’s a bit early to draw any firm conclusions or make predictions but this evidence suggests that the greater expanse of exposed water, which will radiate more IR and allow much higher evaporation has the net effect of a negative feedback , not a positive one.
There will be a contrary effect where water will also absorb more solar energy but this is more complex than just albedo (reflectivity). For most of the 6 months that the regions gets more day than night the incoming radiation will be at a very low angle. What is overlooked in applying a simplistic albedo argument is that a lot of this radiation will be reflected as though it hit a mirror.
So hand-waving arguments can lead to either conclusion. How we decide which effect is dominant is to look at observational data.
That is what we have here. All from conventional archives.
http://oi46.tinypic.com/r7uets.jpg
Barry R says: February 9, 2013 at 8:49 pm
(….Re the physical impact of whales….)
An interesting thought, but to put the physical effects of the whale population into perspective, as a comparison if you gathered the 7 billion people on earth together for an important meeting, allocating 1 square meter per person, the crowd would fit in a square of 84 Km x 84 Km.
We could all fit into an area of the size of the main island of Hawaii.
If we each person takes up about 1 cubic meter (ie, a cubic meter of water weighs 100 kg) … then consider those 7 billion cubic meters piles into a cube, we have a cube standing about 1.9 km x 1.9 km x 1.9 km… ie 7 km3.
Now considering the volume of the world’s oceans is about 1.35 billion km3… all those people represent a volume of 0.00000052% of that of the world’s oceans … (truly a drop in the ocean!)
Having said that, the role of whales in the whole whales/krill/plankton/ocean interaction may be a much more important story.
William Astley says: February 9, 2013 at 9:41 pm
The Earth’s magnetic field remains a charged mystery…
Familiar text book images that illustrate a flow of hot and highly electrically-conducting fluid at the core of the Earth are based on conjecture and could now be rendered invalid. As the flow of fluids at the Earth’s core cannot be measured or observed, theories about changes in the magnetosphere have been used, inversely, to infer the existence of such flow at the core of the Earth….. ….While Ryskin’s research looks only at long-term changes in the Earth’s magnetic field, he points out that, “If secular variation is caused by the ocean flow, the entire concept of the dynamo operating in the Earth’s core is called into question: there exists no other evidence of hydrodynamic flow in the core.”
An intriguing thought … I could never picture how a core of molten iron circulating at different speeds could create a magnetic field.
But perhaps there is an interaction.
Both the oceans and the iron core vary in the speed at which they circulate.
If the oceans themselves create a charge, and the iron core creates a charge, and the mantle is an insulating layer, this may set up charge flows which can change over time.
I just had another look at the plot I did to look at maritime air temperature.
http://oi47.tinypic.com/hwj19d.jpg
One thing I totally missed by focusing on Willis’ ideas about oil on water during the WWII period was that this record basically shows the N. Atl is NO warmer at all than it was 130 years ago !
This data was selected for extra-tropical North Atlantic:
80W-15W 20N-55N
Hey Willis , how about a new game for you. After your spot the volacano idea, let’s play spot the oil spill: the following is rate of change of SST in a zone that suffered a major leak. Can anyone spot when it happened using Willis’ idea that oil prevents evaporative heat loss?
http://nomad3.ncep.noaa.gov/cgi-bin/pdisp_sst.sh?ctlfile=monoiv2.ctl&ptype=ts&var=dt_ssta&level=1&month=nov&year=2000&fmonth=jan&fyear=2013&lat0=12&lat1=30&lon0=-90&lon1=-75&plotsize=800×600&dir=
BTW here is the page that created the plot:
http://nomad3.ncep.noaa.gov/cgi-bin/pdisp_sst.sh?ctlfile=monoiv2.ctl&varlist=on&new_window=on&lite=&ptype=ts&dir=
Gail Combs says: (Repeating 9-year cycles in climate).
Here are 4 graphs. 2 are from the BOM HQ in Melbourne (with suspected UHI) and two are from Observatory Hill in Sydney (with suspected UHI). Both have long records. There was some discussion about summer heat waves, but they were not precisely defined, the difficulty being in how far above average the temperature had to go in order to be called a heat wave. The plots are of Tmax and they end at Dec 2012.
I created a working definition of a heat wave as a period of 5 days (6 consecutive daily Tmax readings from start to finish). Then I simply plotted the 15 or so hottest 5-day averages. Yep, that way you get quite a regularity with a separation of 9 years Unfortunately, for analytical purposes, I don’t think it means much. I could have chosen twice the number of stations and halved the cycle length. It is interesting, though, that the trend in 5-day temperatures is down over time, despite recent UHI potential..
http://www.geoffstuff.com/Heat%20Waves%20by%204.jpg
Did WW2 ship sinking contribute significant surface oil to affect surface exchange and sea temperatures? I think not.
Diatoms contain an oil droplet for bouyancy. In the aftermath of spring diatom blooms, natural oil slicks or sheens occur naturally at the sea surface from the diatom bloom die-off.
This natural phenomenon will dwarf the sinking of a few metal ships containing oil in a small part of the north Atlantic for 2-3 years.
So the WW2 U-boat and ocean cooling idea is interesting but unfortunately a FAIL.
Gail Combs Feb 9, 2013 at 4:40 am
“Remember Ozone and O2 react with incoming UV and EUV the high energy wavelengths from the sun”- –
I see you have a knowledge of the Sun’ reactions with the upper atmosphere. Have you had a chance to look the 6 days of Jan 10 to Jan 15 when the Sun went suddenly from a low state to a short very active state. The Sun had 53 C class flares and 4 M class flares in those 6 days. The output was almost an impulse function and it may be possible to track the resultant ionization in the Earth’s atmosphere. This is particularly interesting when you look at the Jan temperature readings taken by the satellites. Also when you look at the distribution of temperatures. Is it possible for upper atmosphere ionization to spread across the globe and penetrate the lower atmosphere and provide nuclei for cloud formation?
phlogiston says: February 10, 2013 at 5:17 am
“..Did WW2 ship sinking contribute significant surface oil to affect surface exchange and sea temperatures? I think not…”
Fair enough, I imagine it must have been the first thought on everybody’s mind upon seeing “the wartime SST glitch” and has probably been looked at pretty hard.
People do not understand thermostatically controlled systems … as proof they don’t even understand their own bodies temperature control system. Most people believe that if you drink cold water you will burn extra calories and lose weight, it just makes perfect sense, in fact there are calculations out there “proving” this and and various weight loss programs to go with this theory. But what seems to make perfect sense is dead wrong. What people don’t understand that their bodies are constantly rejecting heat, just like the Earth, and if you drink a slug of cold water your body will just throw heat into that heat sink slug and reject less elsewhere and pretty much maintain 98.6F. So no extra calories burnt and no weight loss. The only thing lost is money spent on the cold drink weight loss program. Same thing goes for drinking hot water, your body takes in some heat from that drink but will just reject more heat elsewhere, maintain 98.6F, and no weight gain. So as CO2 or any other forcing is like a warm drink, it makes perfect sense to most that the Earths temperature has to rise, but that is dead wrong, that extra heat is just rejected elsewhere, with little or no temperature gain on Earth.
phlogiston says:
February 10, 2013 at 5:17 am This natural phenomenon will dwarf the sinking of a few metal ships containing oil in a small part of the north Atlantic for 2-3 years. So the WW2 U-boat and ocean cooling idea is interesting but unfortunately a FAIL.
====
It will “dwarf” because it’s “natural”? Did you bother to read paper you linked to? They did not establish it was diatoms, they assumed it. They did not even establish it was chemically an oil nor whether it was living organic or fossil in origin. (Probably also largely diatoms ironically)
Despite this lack of rigour one of the three conclusions at the top of the paper was this:
2. Prominent slicks are confined largely to near shore areas where organic production is high.
So your comment is pretty much a FAIL, if you like to talk like that.
“sinking of a few metal ships” , A few ? THOUSANDS actually , with their crews. Among the ships sunk a prise kill would have been an oil tanker, since cutting of the essential supply of fuel to the allied war effort was one of the main aims of the U-boat campaign.
I agree that whether the amount of oil spilt would be enough to produce an effect needs backing up. But in view of how far just one drop of oil can spread on the surface of water, a ship load will go a long way. Also if you look at the kill zone of the german U_boats, off the european and africain coasts, persistent ocean circulation would tend to bring any spillage down into and across the tropical North Atlantic where hurricanes are born and the bulk of solar energy enters the system.
The potential for a link to SST does not seem so far fetched. As I also provided graphical evidence of, there was a very significant and anomalous drop ACE at that time which would also support Willis’ hypothesis.
Willis said:
“This means that the system is actively regulating the amount of incoming solar energy to maintain the temperature within bounds. It doesn’t disturb the control system that the solar forcing is constantly varying from a host of factors, from dust and volcanoes to 11 and 22 year solar cycles. The thermoregulation system is not based on how much energy there is available from the sun or from CO2. The resulting temperature is not based on the available forcing, we know there’s more than enough forcing available to fry us. It is set instead by the unchanging physics of wind and wave and pressure and most of all temperature that regulates when clouds form … so when the sun goes up a bit, the clouds go up a bit, and balance is maintained.”
I suggest that one should distinguish between forcing elements such as mass, gravity and energy input on the one hand and all other forcing elements on the other hand.
The first three elements will affect surface temperature and total system energy content although the water cycle does limit the system response to such forcings as per the relatively small changes since the early faint sun.
We can see that solar variations do have an effect via the transitions between ice ages and interglacials in response to the Milankovitch cycles.
All other elements have a virtually zero effect on temperature and system energy content after a period of transition involving shifting air and ocean circulations.
I have previously set out in considerable detail here and elsewhere how the system achieves thermal stability in the face of constantly varying forcing elements.
Willis’s article is well written and accurate but not novel.
It is good that he now recognises pressure as a relevant factor. Not long ago he was abrasive towards those of us who saw a significant role for pressure.
It is good too that he is now looking at the water cycle as a whole rather than just tropical thunderstorm activity as per his original hypothesis.
I note that the pressure and water cycle aspects are now being noted more clearly by the so called Slayer group too.
Furthermore the potential for top down solar effects on the global air circulation is being better recognised at NASA as per a recent thread here.
It has long been my contention that the distribution of the permanent climate zones at any given moment is a result of the constant interaction between top down solar variations and bottom up oceanic variability and that the entire global circulation (including ocean cycles) is the adjustment mechanism smoothing out all attempts at thermal disruption.
It is the shifting of those permanent climate zones and the associated changes in global cloud cover that regulate the amount of solar energy able to enter the oceans to fuel the climate system.
It is atmospheric pressure gravity and top of atmosphere insolation (ignoring geothermal for the moment) that determines the amount of energy that the system can contain
Any other factors such as GHG quantities only have a redistributive effect with no long term influence on surface temperature or system energy content and in the case of our CO2 emssions the effect would be miniscule compared to natural solar and oceanic forcings as I have explained extensively elsewhere.
As regards the oil on water effect, Steve Goddard has a chart of NH temps from NASA 3/1/1975. It shows a steep drop in temperature from 1938 to 1945 of ~.5°C. here:
http://stevengoddard.wordpress.com/2013/02/10/nasa-disappears-the-cooling-trend/
Stephen Wilde says:
February 10, 2013 at 9:44 am
Yeah, I see articles on slow drift in thermoregulated emergent systems all the time …
w.
“Yeah, I see articles on slow drift in thermoregulated emergent systems all the time …”
It is novel turn of phrase but is that enough ?
Stephen Wilde says:
February 10, 2013 at 9:44 am
Now that contains about as many misconceptions as possible.
I have no truck with those who claim that pressure (gravity) by itself causes the lower part of the atmosphere to be warmer than the upper part. This is the Jelbring hypothesis, and it is garbage as both Dr. Brown and I explained in detail. It was my pointing out that his hypothesis violates the Second Law of Thermodynamics that got me banned from Tallbloke’s site …
Other than that, however, pressure is indeed a relevant factor, as I have recognized all along.
Other than being completely wrong both in part and in the whole, though, there wasn’t much incorrect in your statement.
w.
phlogiston says:
February 10, 2013 at 5:17 am
Ahh, well done that man. I had thought the same thing regarding natural oil seeps, but your idea about natural oils is much more global and larger.
Good call,
w.
“I have no truck with those who claim that pressure (gravity) by itself causes the lower part of the atmosphere to be warmer than the upper part. This is the Jelbring hypothesis,”
My position is and was that it is pressure plus energy input (insolation) but you didn’t seem to have much truck with that at one time.
Anyway, it is good that the issue seems now to be resolved.
Willis, I meant to add that I trust your memory and my own more than the temperature chart you posted to debunk the urban legend of the brutal winters during WWII. And I trust what we thought the past temperatures were by observation over thirty years ago more than what is sold as same time period temperatures today.
I had missed this from phlogiston below:
It was more than 4,000 vessels. (over 4 years, that’s about 3 per day)
And we should remember with respect the more than 100 thousand men who died in those ships.
phlogiston says: February 10, 2013 at 5:17 am
“….will dwarf the sinking of a few metal ships containing oil in a small part of the north Atlantic for 2-3 years…”
And a small part of the North Atlantic? Maps of January 1942 to May 1943 sinkings show some of the extent: http://www.secondworldwar.org.uk/merchantnavy.html
Atlantic Shipping Losses WWII: The Battle of the Atlantic:
3,500 merchant vessels, 175 warships and 783 submarines
Total 4,458 vessels.
Deaths (This, we should not forget)
Allied: 36,200 sailors and 36,000 merchant seamen
German: 30,000 sailors
Willis Eschenbach says:
February 10, 2013 at 10:04 am
Stephen Wilde says:
February 10, 2013 at 10:19 am (Edit)
It’ll do until you provide citations to what in the patent world is termed “prior art”, people discussing the topic using that paradigm … it might be out there, but it certainly hasn’t been prominent.
w.
I wish I’d gotten to this thread sooner. Unfortunately, it was posted just while I was dealing with an issue that could not be ignored.
I generally agree with the thesis. But what I find curiously absent is a well known variation in tidal mixing. Tides do more to mix cold deep layers of the ocean into warm surface layers than do the winds. They change the depth of the oceans too.
Not just on daily or monthly cycles, but on cycles up to 1800 years, 5000 years, and 23,000 years. Why? Because the orbit of the moon and earth slowly drift. The alignments of moon, sun, and earth surface features such as continents and particular oceans also changes. These cause direct movement of water and mixing that lines up with those changes of weather cycles you are calling “drift”.
So I would assert that the thermostat is still working, but the tides stir the pot in ways that change the mass and temperature of water under those clouds and it takes time to adjust (and in some cases, the changed water flow simply can not be fully adjusted out locally).
This isn’t just some idea I’ve cooked up. Better folks than me looked at it and found it. I just discovered their work and collected it into some postings for easier reference. In particular, for longer cycles, this one:
http://www.pnas.org/content/97/8/3814.full
that pretty much lays it all out. Including how much tidal mixing matters and the amount of tidal mixing at any one time for thousands of years (forward and backwards). That mixing matches many known temperature shifts. I have regularly quoted one of the graphs from it in various matches to cycles (or “drifts”…) and shown how it matches up.
http://chiefio.wordpress.com/2013/01/24/why-weather-has-a-60-year-lunar-beat/
And looked at the various lunar cycles of orbit and how they influence things:
http://chiefio.wordpress.com/2013/01/04/lunar-cycles-more-than-one/
There is even good evidence (from several cited papers) that a shift of the Gulf Stream descending point is important to very long cycles and peaks / dips in both glacial and non-glacial regimes. Shifts that could easily be caused by massive flows of water from one ocean basin to another as the moon shifts from pulling water to the N. Hemisphere to pulling it South.
http://chiefio.wordpress.com/2012/12/15/d-o-ride-my-see-saw-mr-bond/
So leading to things like D.O. events, Bond Events, the Arctic / Polar Seesaw and more.
FWIW, I think one of the ‘key bits’ is the restriction at Drake Passage. More Southern Ocean water rushing around the pole will send more at Drake Passage and run right into a restriction. That will peal off a bunch of cold water that gets shot up the spine of South America and turn out into that “tongue of cold” we saw a few years back as the PDO started to shift. So a lunar tidal “pull” of more water into, say, the Atlantic, would cause a lot of Pacific Water to be whacking into Drake Passage “for a while” and sending a cold shiver out to the central Pacific as a result.
http://chiefio.wordpress.com/2010/12/22/drakes-passage/
Thanks to variation in rain leading to variation in fire conditions, it looks like the “Lunar Cycles” even influence things like fire rates on land:
http://chiefio.wordpress.com/2013/01/22/australia-bushfires-a-lunar-cycle/
(Speaking of aerosols changing weather…)
So while I find the entire thesis of the article quite credible, it looks to me like there is a known water / tides based metronome beat that needs to underlay the thermostat, and that needs to have the “random” drift as a residual after allowing for the known “pot stirring”…
“It’ll do until you provide citations to what in the patent world is termed “prior art”, people discussing the topic using that paradigm ”
Willis said:
“Under my paradigm, on the other hand, natural thermoregulatory systems constrain the temperature to vary within a narrow range”
I said:
“Thus does the atmospheric circulation reconfigure itself to remove the imbalance by adjusting the energy flows through different sections of the atmosphere both vertically and horizontally.”
from here:
http://climaterealists.com/index.php?id=10723
and:
“virtually all climate variability is a result of internal system variability and additionally the system not only sets up a large amount of variability internally but also provides mechanisms to limit and then reduce that internal variability. It must be so or we would not still have liquid oceans. The current models neither recognise the presence of that internal system variability nor the processes that ultimately stabilise it.”
from here:
http://wattsupwiththat.com/2010/04/06/a-new-and-effective-climate-model/
and:
“AGW is thus falsified because the air cannot warm the oceans and the air circulation systems always adjust to bring surface air temperatures back towards sea surface temperatures.
Climate models do not reflect this obvious truth and the ideas of Tyndall et al whilst correct if taking the air in isolation cannot affect the global equilibrium temperature set by the constantly varying interplay of sun air and oceans.”
from here:
http://climaterealists.com/index.php?id=3735
There is a lot more but you will get the picture.
Willis said:
“The boiling water system simply moves energy through it at a faster rate, it doesn’t run any hotter”
I said:
“An appropriate analogy is a pan of boiling water. However much the power input increases the boiling point remains at 100C. The speed of boiling however does change in response to the level of power input. The boiling point only changes if the density of the air above and thus the pressure on the water surface changes. In the case of the Earth’s atmosphere a change in solar input is met with a change in evaporation rates and thus the speed of the whole hydrological cycle keeping the overall temperature stable despite a change in solar power input.”
from here:
http://wattsupwiththat.com/2010/04/06/a-new-and-effective-climate-model/
@Willis
Sir, I don’t have a great deal of free time available, being one of the self employed type people on the industrial world – whereby, if I don’t work, my family doesn’t eat. Therefore, it is with a slight degree of annoyance that I note you have not replied to my repsonse (as requested by yourself). Now, as one mariner to another, I will accept that other pressing things can take preference, e.g. dealing with a man overboard or a shredded mainsail in a rough squall, etc is usually rather a more immediate and pressing requirement of ones time…..
I note however, you have made other responses….
My request is simple – if I (or indeed yourself) have barked up the wrong tree, please let me know by responding to my earlier response to your good self.
I was slightly puzzled by your request for a mechanism and made a reasonable (IMHO) effort to reply – I think, in all honesty, that a response is at least respectfully owed…..
regards
Kev
Kev-in-Uk says:
February 10, 2013 at 1:11 pm
Kev, you are a good guy, but clearly, you mistake me for someone who cares if you are annoyed.
And now you want me to go look through every damn post on this thread and find first my question, which I don’t recall, and then track down whatever you thinks passes for your answer?
Get real. If you have a question and and answer that important, then QUOTE OR LINK TO both the question or the answer. I don’t give a damn if your family doesn’t eat, I have a day job myself, you get no sympathy from me. I’m not going to spend one minute trying to find your damn answer.
All of us have calls on our time. Restate the question and answer, and I might take a shot at it. However, I think you misunderstand my position. I currently have four active threads going, involving a total of perhaps 500 comments. I try to read them all, but there is no way I can answer them all.
So I am constantly doing blog triage: long answer, short answer, no answer. I almost gave this post no answer, and like with all posts it’s a judgement call.
But if you want to have a discussion, you have to make your answers and your ideas accessible and interesting and the like. And if I go past it, so what? Possibly I didn’t grasp the subtlety of your arguments.
The way to handle that is not to get annoyed. I’ve ignored better men than you, it’s no mark of distinction, it’s not personal or a judgement on your character or worth, nothing to get annoyed about. Just put up a post that clearly identifies, through quotations and/or links, what I said and what you said in return, and ask for a response. If on re-reading your words you can see how to improve them, do so.
w.
I note that Marc has trouble with the idea that a degree C is the same as a Kelvin for all practical purposes when talking about how much something changed. To say “It changed 2 C” or “It changed 2 K” are the same thing. Willis just “gets it” and Marc doesn’t.
Percent change is always done in absolutes, so K, or you get bogus results. It was Standard Operating Procedure in chem class to do all the measuring and calcs in C but swap to K for thermo issues. And for exactly the same reasons.
@Alec Rawls:
Don’t forget, too, that the UV shift was accompanied by a general ‘shortening’ of the air column. It is the same amount of air, but “squashed down” compared to the exited high UV state. This means that a whole lot of mountain tops are now, adiabatically, “higher” and so, colder. More snow will stay longer, glaciers will grow again, etc. etc.
IMHO, just that UV modulated atmospheric height change is a “game changer” and explains a lot about how the sun can modulate and “average temperature”. Now if GHCN had not been busy pruning all the thermometers out of “high cold places” we might actually see something interesting in the temperature record too…
The TSI stayed close to constant, so that UV energy moved into IR. This, IMHO, being promptly absorbed in the sea surface / spume is why we had a hot peak in 1998 (then thing adjusted…). So for decades energy was deposited relatively deeply in the oceans via UV, now it’s not, and rapidly gets booted to space by thunderstorms. Net effect, we were storing heat in a slow system of deeper water, now it’s slowly cooling instead. Now we have that heat in the rapid response rapid rejection IR / evaporation / convection / condensation cycle. So we will cool.
(if some of this is already covered in comments, please forgive me. I’m late to the show and working though the long list…)
@Greg Goodman:
9 years is 1/2 of a Saros lunar cycle. Do not forget to look at lunar / tidal interactions with your solar cycles. The two are not always in phase. Similarly, the circumpolar wave runs about 9 years:
http://www-das.uwyo.edu/~geerts/cwx/notes/chap11/ant_wave.html
If you do not allow for the 18 year tides cycle you will miss a lot.
@Gail Combs:
In the North East of California (well, sort of east) there is a volcanic field with caves. After you descend about 100 feet (guess) you reach the ice floor. It is perpetually filled with ice (though the ancient lava tube runs much further. Even in summer when it’s “100 F in the shade and there is now shade”. You can go from roasting in a dark volcanic solar oven rock field, to ice skating in a modest stroll down the trail… Yes, the “average annual temperature” there is below freezing. So any water that enters, stays frozen at the “average 0 C” point…
@BillH:
There are two “triggers” for glacials to form. First, the Gulf Stream descending point moves more south, leaving more heat in The Gulf of Mexico and Florida and less in Norway and the Arctic. Ice starts to pile up.
Second, this leads to a glacial once insolation north of 65 N is below about 416 W/ m^2 (as precession, obliquity, etc. change in our orbit). In times like now, where we are about 428 W we don’t quite ice up. ( It has to get above this level to melt out of a glacial) but it is also not enough to remove ice if it forms. We re now in the meta-stable stage between stable “interglacial” at the start of the Holocene and stable “glacial” soon to come. There is no longer a tipping point to hotter possible as insolation 65N is too low. There is a tipping point to colder. It will inevitably happen at 416 W/m^2, but could happen sooner with any externally driven cold plunge starting an ice cycle. ( Meteor impact winter, volcano induced ‘years without a summer’, etc.)
Once the ice says at the North Pole through summer, an albedo feedback begins that causes more cold way north and plenty of warm oceans in the lower latitudes (remember that Gulf Stream switch?) so even more snow accumulates. The tropical ‘thunderstorm thermostat’ works, but only in a tropical / temperature regime; not in the Arctic / Polar one. It prevents rise above 30 C but is helpless below 0 C as it is liquid / vapor water driven; not solid water…
Details on Holocene W/m^2 and implications of or present state here:
http://chiefio.wordpress.com/2012/12/29/annoying-lead-time-graph/
We are 12 W / m^2 or less away from guaranteed hard frozen glacial, with an instability that means we can have century scale events drive us to frozen anyway ( L.I.A. for example) and no guarantee of recovery to warm. Oh, and insolation 65 N is continuing to decrease as our planet wobbles in a predetermined way…
Taking a tea break, back in a bit…
@Willis
I accept you are busy and also that you are correct in your attitude – but I will respond in equal measure. I am not actually annoyed. I personally don’t give a wet slap as to your motive(s). I enjoy your output/input here at WUWT, but your perceived brashness does you no credit when delivered in such a fashion! (though, from a personal perspective I genuinely understand and accept that). Be that as it may – that is your personal choice of expression and I actually do respect that choice.
I have no intention of repeating my response, or bothering to link to it for EXACTLY the same reasons you cite.
I would like to believe that in a crisis situation on the High Seas, you might be someone to rely upon – but from your attitude/reply, I am more reticent, which is a shame, but I also accept that appearances can be deceptive…..(I perhaps am wrong to trust in others, which is not a scientific derivation, but is indeed a human ‘belief’)
I remain, as always, open minded and honest – as per a true scientist, but clearly, there is little point in further attempted discussion here…..I don’t mind bloody mindedness, in fact I find that an admirable quality (in a scientific sense) – but obviously when two bloody minds collide………jeez, I’d hate to be amongst the crew on ‘your’ ship!
Suffice to say that your interest in ’emergent phenomena’ is of curiousity value – but, when you consider the big picture, I suspect that it is actually of no conseqence in the big scheme of things and hence I feel further elaboration pointless.
with genuine respect and regards (not necessarily diminished, but perhaps slightly demurred……..?)
Kev
Kev-in-Uk says:
February 10, 2013 at 2:49 pm
Kev, rather than just blow you off before, instead I said I’d be happy to answer your question if you’d just link to it. I told you I didn’t want to root around and find it, only to have you say I’d found the wrong one or something. I don’t play that mug’s game, been there, don’t do that any more.
If a man has a question, I expect him to ask it loud and clear, quote it, point to it, link to it, make it evident, make it transparent, easy for me and everyone else to see it.
You reply that have no intention of doing that.
Your choice, not mine.
Buh-bye …
w.
Love the article and the emphasis, Willis. First came across the concept of emergence in the eponymous book by Steven Johnson a decade ago (http://www.amazon.com/Emergence-Connected-Brains-Cities-Software/dp/0684868768) and you have done the real scientists here a service by drawing out its relevance to climate.
E.M.Smith says:
I wish I’d gotten to this thread sooner. Unfortunately, it was posted just while I was dealing with an issue that could not be ignored.
========
Thanks for all those links, could save some time. I’m currently trawling through ICOADS basin by basin 8.85 years and it’s harmonics keep coming up again and again. I’m already getting indications that what is called the circumpolar wave is a global phenomenon.
I’m going to check back the the Hadley processed data later, but with the work I’ve already done on that I think they have fairly roundly screwed any cyclic signals that may be present.
There also seems to be something very close to 10 years in N.Atlantic and clear signs of resonant patterns. I think the circa 60y repetitions are such a resonance. I’m hoping to be able to quantify that.
This should help to clarify whether there is anything related to SSN, I was expecting removing the 9y cycle would make the solar signal pop out but it doesn’t seem to be working out that way. That’ll piss off Tallbloke and his crew if it turns out to be the case.
Now if all this is shifting large amounts of water in and out of the tropics and shifting the tropical convergence zone, that should have some modulating effect on Willis’ thunderstorms.
E.M. Smith, Feb10, 2013 at 2:27pm @BillH
“The tropical ‘thunderstorm thermostat’ works, but only in a tropical / temperature regime; not in the Arctic / Polar one. It prevents rise above 30 C –”
I have been looking at the 30 C limit in the Ocean and I believe it is caused by a chemical reaction. When the water temperature reaches 30C, carbon dioxide exceeds it critical point on its phase diagram and no longer behaves as a liquid in the water. It goes into it’s gas phase and bubbles to the surface. You can see this change of phase when you heat a container of water to near 30 degrees and gas bubbles form on the side of the container. When the carbon dioxide passes through a saturated solution of calcium hydroxide, the ocean is saturated with calcium hydroxide, calcium carbonate is formed. For each mole of calcium carbonate formed, approximately 1200 kilojoules of energy is taken from the ocean. This process removes sufficient heat that the ocean does not heat above 31C.
I would like to know the source of the “thunderstorm thermostat” theory and what data backs this theory.
@Kev-in-UK & Willis:
Perhaps the two of you could save the time you are wasting telling each other how busy both of you are and how it is just too much trouble to figure out what you are talking about to just put “kev-in-UK” in the search box and link the comment in question. Took me about 30 seconds to figure out it is likely this one:
http://wattsupwiththat.com/2013/02/08/slow-drift-in-thermoregulated-emergent-systems/#comment-1221280
Where the topic is heat storage in the oceans. I think the kev-in-UK question not addressed is one of these two:
Kev-in-UK then goes into an hypothetical of a meteor strike.
Point two is not easy to chop into smaller bits, so I’m just going to quote it entire:
Personally, I think that since most of the ocean is about 3 C and never changes, I think a large part of the mass is not involved in “inertia”. That it is only the top couple of hundred feet that matters (and then mostly via lunar / tidal mixing changing fast heat flux more than via absolute thermal ‘inertia’.
But you folks all seem uninterested in that clear, simple, and supported by published papers and observations cycle and would rather toss rocks at each other about how busy you are. So hopefully quoting this and linking it will save you enough time from complaining about having no time to take a minute to think about lunar ocean layer tidal mixing and heat flux…
(In other words, I have no dog in your fight but would like to help end it quickly so more interesting things could be looked over… that is, “my stuff” 😉
E.M.Smith says:
February 10, 2013 at 4:52 pm
Thanks, E.M. It may “likely” be that one … which means, of course, that it also may not be that one. Too many times I’ve done just what you said, found the “likely” one, only to be told that I was an idiot and that it wasn’t the right one, how could I make such a dumb mistake?
After a few times I wised up, I’ve given up playing that mug’s game. If a mans wants an answer to a question, it’s his job to tell me which question, not mine. Nor is it yours. In any case, he’s told me he won’t reveal the secret question, fine by me, he’s off my Xmas list, the world goes on …
w.
“For each mole of calcium carbonate formed, approximately 1200 kilojoules of energy is taken from the ocean. This process removes sufficient heat that the ocean does not heat above 31C.
I would like to know the source of the “thunderstorm thermostat” theory and what data backs this theory.”
John, you may need to think about how CO2 is out gassing and how much H2O is evaporating. I doubt anything will outstrip the amount of energy involved in the water cycle.
You might enjoy the later chapters of Kondepudi and Prigogine: “Modern Thermodynamics”. They conclude with simulations of nonlinear dissipative systems of a few dimensions, and show that even with constant input on a flat surface these can produce complex waves. Take this up to the high dimensionality of the climate system with its non-constant inputs, and it is clear that any simple of expectation of the course of the climate system (even a single summary such as global mean temperature) is inappropriate. There are many possibilities of how the measurements can be “drifting”.
The whole of this wartime record is pretty screwed in ICOADS shipping data and does not get better by the time Hadley have finished messing with it .
eg Atlantic SST shows up and down steps of about 0.4C , maritime air temp does about the same. S Pacific steps up by about 0.5 and does not come down again. N. Pacific is so shot full of holes it’s hard to draw any conclusion.
Hadley SST2 just removed 0.5C from everything in 1941. The scheme I call Folland’s folly. That fixes SP but puts a spurious drop into the other basins. Then in HadSST3 they correct the bump but so an not to loose face they come up with another scheme that means that the same thing happens : Folland’s folly was “right for the wrong reason”.
Seems to me there’s on hell of lot supposition and generally making things up to fit getting mistaken for science.
I’m pretty sure natural climate was not jumping around like that in unison with US Navy. So either the war did produce an effect like Willis suggested or Americains just have a different way of reading thermometers.
Some practice the method of “nearest degree” others always round up ??
Since the record is an intractable mess, further speculation about whether oil was a factor is probably not going to get very far.
The idea is interesting though and the plot I did for Deepwater Horizon blowout area seems to show a real physical effect is credible.
http://nomad3.ncep.noaa.gov/cgi-bin/pdisp_sst.sh?ctlfile=monoiv2.ctl&ptype=ts&var=dt_ssta&level=1&month=nov&year=2006&fmonth=jan&fyear=2013&lat0=12&lat1=30&lon0=-90&lon1=-75&plotsize=800×600&dir=
Now that was a massive amount of oil in a relatively short space of time but chemical dispersants were liberally sprayed over the whole area, so it was fairly short lived.
E. M. Smith Feb 10, 2013 at 4:52
“Personally, I think that since most of the ocean is about 3 C and never changes, I think a large part of the mass is not involved in “inertia”. That it is only the top couple of hundred feet that matters (and then mostly via lunar / tidal mixing changing fast heat flux more than via absolute thermal ‘inertia’.”
There is a reason that most of the deep ocean is at 4 C and it is chemical and not inertia. When ocean water was formed it, the sodium chloride disolved in the water absorbed 4 kilo joules of energy per mole of sodium chloride. This is called the heat of hydration and it bonds the water to the sodium chloride. Fresh water begins the process of freezing at 4 C and the water expands as tiny crystal structures are formed and pushes the water molecules apart. When salt water starts to freeze at 4 C, it cannot because of the sodium cloride. At 4 C the salt water begins to release the 4 kilo joules per mole of sodium chloride and it does not freeze until the all of the energy is released. This release of energy heats the ocean and keeps it at 4 C until the process of dehydration is completed. There is a good explanation of hydration at http://www.docbrown.info/page07/delta2H.htm
@Steve Garcia:
There’s a pretty good understanding of the likely cause of D.O. / Bond events in the links I put above. In particular that pnas paper
http://www.pik-potsdam.de/~stefan/Publications/Nature/rapid.pdf
covers D.O. events pretty well, while
http://www.ndsu.nodak.edu/pubweb/~ashworth/webpages/g440/Grimm_et_al_Lake_Tulane.pdf
finds evidence for Florida being anti-phase to Greenland (and other evidence that the Gulf Stream slows down every so often causing those cyclical excursions). If you really want to understand the cause of D.O., Heinrich, and Bond events, read those papers.
I look at those papers and more here:
http://chiefio.wordpress.com/2012/12/15/d-o-ride-my-see-saw-mr-bond/
and link to a couple of other useful bits / papers / graphs.
The pnas paper: http://www.pnas.org/content/97/8/3814.full
finds plenty of reason to think that the 1500-1800 year scale cycles are directly driven by lunar orbital mechanics and tides (and even a 5000 year cycle). One chart from that report has us at a minimum of tidal mixing at about 1998 and increasing since (so more deep cold water cooling things off) right as the ocean SST have gone a bit cold…
So we have a stable “thunderstorm thermostat” state at 30 C, but we can cool down from there with certain ocean changes. Short term, lunar tidal mixing of the cold ocean layer to the surface. Sporadically on a longer scale via a shift of where the Gulf Stream descends near Europe and how it distributes heat. IMHO, the “slow drift” of the thermostat is due to mass shifting of lots of ocean water from one ocean to another as the moon shifts from ‘way north’ to ‘way south’ during a 1200 to 1800 year Saros Series. Animation here:
The tropical thermostat has a hard lid to the upside, as water evaporation runs to very fast in hurricanes. To the downside, it slowly loses ability to control (as you can only go to zero storms and convection) eventually halting all together at 0 C frozen ice sheets. That lets us drop out of the present stable state and into an ice age glacial. It starts first at the poles, and spreads as far as that albedo / non-convective feedback can get toward the equator. Somewhere in the middle things are ‘above freezing’ and the thunderstorm thermostat kicks in again. So Brazil is full of plants that are not frost hardy as it never frosts them… Temperate zones cycle between summer thunderstorm limited heat, and winter “pretend it is an ice age” frozen without downside control (other than solar / geothermal longer term). So a “Canadian Express can drop Dallas 50 F in a few hours ( I’ve been in it) but once things are at 100F, you are not going much above that if there is any water in the air or on the surface.
In short, the thermoregulatory system is asymmetrical due to water phase temperatures.
@jim G:
It, technically, isn’t the sun in Milankovick. It is the shift of the orientation of the Earth. Changes in the circularity of the orbit, the tilt of the orbit (precession of the apsides), and change of the tilt of the Earth ( wobble and tilt both, really).
Only when the N. Pole is pointed AT the sun for the longest time (which, counter intuitively is when summer happens furthest from the sun, so lasts several days longer) and to the greatest degree (more tilt and more elliptical orbit so the seasonal difference is longer) do we go over the W/m^2 above 65N that melts the Arctic Ice cap and gives us an interglacial. As soon as the Arctic freezes and stays that way every year we are once again back into a glacial with no turning back. Yes, the folks who want multi-year arctic ice and no melting of the ice cap ever are demanding exactly the conditions that will put us into the next glacial. Our present 428 W/m^2 are not enough to melt the ice once it is all multi-year and we are ‘metastable’ so can “go cold and stay there”.
http://chiefio.wordpress.com/2012/12/29/annoying-lead-time-graph/
lays out the energy picture…
That we are metastable now, though, means that a 12 W change in the sun would put us hard frozen “right quick” and we would never recover to warm. As some folks have asserted a 7 W change during the recent warmer sun phase, and others have asserted similar single digit coolings possible when the sun goes quiet, we could have the sun kick us to ice. ( Leif asserts the sun is more stable than those other folks have claimed, and I greatly hope he is correct. To the extent he is right and it is a data artifact, we have more buffer from non-recoverable cold events as even volcanoes would have to deal with a ‘constant sun’ flux.)
@otsar:
I came to the same metaphor:
http://chiefio.wordpress.com/2011/07/11/spherical-heat-pipe-earth/
But I think that Willis has a better model in his ‘Thunderstorm Thermostat’ and that Stephen Wilde has a more elaborated mechanism for how it plays out toward the temperate zones, poles, and mass air flow shifts.
@terry Jackson:
Hershel first observed the connection, then Jevons studied a huge body of data from grain production around the old British Empire and pretty much showed a tie of grain prices to solar cycles. Since then we’ve dramatically changed farming methods and grain genetics, so to some extent we ‘broke the thermometer’ or rain gauge of grains. The original analysis still stands valid though as it used a more ‘uniform’ instrument 😉
http://www.google.com/books?id=4ckJAAAAIAAJ&lr=
I note in passing that our present financial crisis arrived with a drop in sunspots…
http://www.worldforextrader.com/sunspots-in-forex/
So there’s the references. Searching on their names and the titles will likely give better links. These were just the first I found.
@Willis:
There are vertical heat pipes that work via condensation, not with a wick. Not the usual kind, but they do exist. IIRC they are the kind used on the Trans Alaska Pipeline.
http://chiefio.wordpress.com/2011/07/11/spherical-heat-pipe-earth/ quotes the wiki:
There are even some that pulse and develop oscillations:
http://chiefio.wordpress.com/2011/08/17/pulsating-heat-pipes/
so I think it might well match some parts of the atmosphere/ storm cycle fairly well.
Oh, and heat pipes do have ongoing regular heat conduction even if the condensation regime is not working in one end / area. Even some ‘chimney’ effects if they are big enough in diameter to have vertical counter current vapor flows. (Though it is not the preferred / designed mode of operation.)
@Retired Engineer John:
The Thunderstorm Thermostat theory was originated by the author of this article, Willis.
There’s several articles here on WUWT that lay it out.
http://wattsupwiththat.com/?s=thunderstorm+thermostat
pulls them up.
Oh, and I’ve seen both 3 C and 4 C cited for the temp in the ocean depths.
@Donkeygod:
I think that funding aspect you pointed out is causing many “researchers” to scrupulously avoid any topic that might reach a valid conclusion…
Greg Goodman Feb 10,2013 at 5:42 pm
Greg, the CO2 outgasses because the water temperature reaches 30.3 C, the critical point on the CO2 phase diagram where CO2 can no longer remain a liquid in water. The reaction is very strong and does cool the entire ocean to 30-31 degrees. Go back to Willis’s post of Feb 12, 2012, “Argo and the Ocean Temperature Maximum”. The precision and repetition shown in the graphs could not be matched by any processes that could vary with winds, weather patterns, etc. Willis had this to say about the temperature limit at that time “I want to highlight something very important that is often overlooked in discussions of this thermostatic mechanism. It is regulated by temperature, and not by forcing. It is insensitive to excess incoming radiation, whether from CO2 or from the sun. During the part of the year when the incoming radiation would be enough to increase the temperature over ~ 30°, the temperature simply stops rising at 30°. It is no longer a function of the forcing.”Now Willis attributes the mechanism to thunderstorms; however thunderstorms have no mechanism that will start and keep them aligned to a 30 C temperature.
@E. M. Smith Feb 10, 2013 at 6:45pm
@Retired Engineer John
“Oh, and I’ve seen both 3C and 4C cited for the temp in the ocean depths.”
I hope you did not miss my point that this temperature is set by a chemical reaction.
Three cheers for someone recognizing that 0.3K / 300K => 0.1%…
Forgetting the definition of 0 is one of the great sins of our great scientists. If we stop suppressing 0, we will have a great chance of getting the discussion back on track…
Greg Goodman says:
February 10, 2013 at 8:46 am
phlogiston says:
February 10, 2013 at 5:17 am This natural phenomenon will dwarf the sinking of a few metal ships containing oil in a small part of the north Atlantic for 2-3 years. So the WW2 U-boat and ocean cooling idea is interesting but unfortunately a FAIL.
====
It will “dwarf” because it’s “natural”? Did you bother to read paper you linked to? They did not establish it was diatoms, they assumed it. They did not even establish it was chemically an oil nor whether it was living organic or fossil in origin. (Probably also largely diatoms ironically)
markx says:
February 10, 2013 at 11:13 am
…
Atlantic Shipping Losses WWII: The Battle of the Atlantic:
3,500 merchant vessels, 175 warships and 783 submarines
Total 4,458 vessels.
Deaths (This, we should not forget)
Allied: 36,200 sailors and 36,000 merchant seamen
German: 30,000 sailors
Willis Eschenbach says:
February 10, 2013 at 10:22 am
phlogiston says:
February 10, 2013 at 5:17 am
…
Ahh, well done that man. I had thought the same thing regarding natural oil seeps, but your idea about natural oils is much more global and larger.
Good call,
w.
First it was never my intention to disrespect the many who died on those Atlantic runs in the face of Uboat wolf-packs. Our debt to them will never go away. “At the going down of the sun and in the morning, we will remember them”.
I looked further on the net for papers about oil from diatoms but evidence seems pretty thin. It seems it does happen, but its hard to say how significant it is.
Its just that the world is a big place, and to back up a claim that WW2 shipping losses caused oil coverage on seawater on a globally significant scale (such as to affect surface mixing) – or even in the context of the Atlantic – would require some figures to back it up, and I’m skeptical that the numbers would be high enough. Wave action and bacterial degradation quickly go to work on oil slicks. This phenomenon has frequently disappointed environmental activists by causing surprisingly quick disappearence of even spectacular oil spills, especially in warm seas.
As for Willis’ reply – either its agreement, which is puzzling, or its sarcasm at a level way over my head, not quite sure which.
BTW I attended a scientific conference in LA a couple of years ago. Among the available conference hotels was the Queen Mary ship, so out of curiosity I booked it. On the ship,
of a similar class to Titanic, I learned that it had made the Atlantic run many times during the war carrying US troops to Normandy and supplies. It was too fast to be in much danger from the Uboats. None-the-less, I found myself deeply in awe and respect of the ship, its history and the men who had made those runs.
E.M.Smith says:
February 10, 2013 at 6:45 pm
@Steve Garcia:
There’s a pretty good understanding of the likely cause of D.O. / Bond events in the links I put above. In particular that pnas paper
http://www.pik-potsdam.de/~stefan/Publications/Nature/rapid.pdf
There is a big disconnect in the climate community and literature – if you look in google scholar for “bipolar seesaw” for instance you can quickly find many papers simulating global deep ocean circulation and showing global climate variation on century and millennial scales, driven by this “natural” ocean circulation (featuring inter-hemisphere “heat piracy” among other things i.e. ocean heat getting smuggled across the equator as it is a present in the Atlantic – see Bob Tisdale and the north equatorial and carribean currents). However, on the other side of the fence in atmospheric climate science we are told that nothing other than CO2 is capable of changing climate on even decadal scales. This disconnect in the scientific community is astonishing.
I have several times commented on the phenomenon you mentioned the many “abortive” mini-interglacials that punctuate all recent glacial periods. In Willis’ first post on emergent systems I used this analogy:
Look at the Vostok and Greenland ice cores. It is very clear that glacial and interglacial states are alternate attractors, for every true interlgacial over the last couple of million years there have been dozens of abortive jumps, like a cat jumping to a branch but its claws not quite holding. It tries many times and every so often – as slow wavelike swaying of the branch from an external forcing wind (Milankovich orbital cycles) brings it periodically slightly closer to the ground, the cat gets into the tree.
@Retired Engineer John:
I didn’t miss your point. I just don’t see any evidence to support it.
I know this is a wiki, so ‘thin soup’ at best, but it was quick to find an looks about right:
https://en.wikipedia.org/wiki/Abyssal_plain
roughly quoting a table:
So we have temperatures from -4 C to 4 C and points in between along with some “highly variable” down to a km. (and I doubt there is a point change from 4 C to -4 C at 3 km).
So I’m not seeing a lot of room for a chemical stabilized temperature here.
There is also the small problem that lots of the cold bottom water is created at the poles from cold air at the surface. Again, a physical not chemical source / driver.
So you may have a great theory, that accounts for everything and all; but I’m up to my eyeballs in other things right now and just not feeling like exploring it to figure out veracity. Then there is that spectrum of existing ocean temperatures that make it unlikely to be so controlled and there are the gigantic volcanic arcs on the sea bottom spewing out gigatons of hot water and chemicals and it just looks a heck of a lot more complicated to me.
So I just look at it and say ‘anything below about 200 meters is darned cold all the time’ period. So any ocean ‘inertia’ or ‘storage’ of heat has to be in that thin top layer, not below. And the ‘below’ just becomes a constant, so not very interesting as to why, as it isn’t going to be doing much to heat storage.
@Phlogiston:
The geologists seem to have the papers that have the more likely correct results and the ‘disconnect’ seems to me to largely be the “climate scientists” from reality…
@E.M.Smith says:
February 11, 2013 at 1:35 am
@Retired Engineer John:
“I didn’t miss your point. I just don’t see any evidence to support it.”
The chemistry is straight forward.
Greg Goodman says:
February 10, 2013 at 12:53 am
Greg, I’ve been pointing out the same thing for a while now. You might like this paper on albedo change due to Solar angle to the surface.
Also note all of the Arctic stations are at the edge of the various land masses, and not on the “ice”. Arctic station locations North of 66.5 Lat. So measurements will be much more effected by water temps than Ice stations.
During WWII, the number of station records dropped off, so fewer records means more variability in temp.
RMB, you have posted twice about “surface tension” affecting the ability of a body of water to absorb heat from above. Certainly water can absorb heat from above. It’s trivially easy to prove. Take two buckets of water. (Kiddie pools would be even better since you want relatively shallow containers.) Put them in your yard when the sun is highest – one in full sun, the other in full shade. Measure the starting temperature in each. Come back in a few hours and measure how much they have heated up. The one in full sun will be substantially warmer.
I don’t know why your infrared-gun experiment did not quickly show the same results but my first hypothesis would be that your gun is single-color – that is, it emits on a narrow spectrum – and that it happens to be a frequency that is poorly absorbed by liquid water. Surface tension has nothing to do with it.
Now, if you tried the same experiment with a hair-dryer, you’d get a completely different result. A hair dryer will hit the top of the water with a flow of warmed air and (if it’s built right) have a baffle to prevent direct radiation from the heater coils. To control for circulation, you will have to hit one bucket with the heater on and the other with just the fan. Because of the increase in air speed, you will increase the evaporation in both buckets so we will really be comparing how much less the heated bucket cools during the experiment. The water is not “resisting” the heat – it’s just that the added heat is being offset by evaporative cooling from the increased airflow. The interesting thing about this version of the experiment is that as the very topmost layer of the water is getting warmer, it will increase its rate of evaporation, which cools it back down! Let the system reach steady-state and the added heat will be balanced out by the additional cooling of evaporation. The result is that warmer air in contact with water will not increase the temperature measured in the container even though it is clearly transferring energy into the water. (The extra energy is going into evaporation which you can demonstrate by leaving both hair dryers running and see which bucket dries up first.)
Continuing the experiment, if you pour a tiny amount of oil in your two containers, now the warm air CAN heat the water because the layer of oil reduces the surface area of water available for evaporation in both the heated and control containers. Surface tension still has nothing to do with it, at least not until you get up to wind velocities that can generate the spray that Willis talked about above.
People naturally believe that you can heat water from above, so did I. A while back I came across Trenberth and his “missing heat” and I realised that I’d never seen water heated from above. I got curious and grabbed a source of heat, a paint stripping heat gun. It operates at 450degsC, fan forced. I fired the gun at the surface for 5mins then noticeing that nothing appeared to be happening, checked the water, it was stone cold. With further experimentation I found that the only way to get heat into water from above was to first float something like a baking dish on the surface which cancels the surface tension underneath it and then the water will heat. Exactly how this works I don’t know but there is a contribution from Richard G that may hold a clue. I believe that surface tension has been seriously underestimated and needs a lot more study. To sum up, you can “radiate” water but you can’t “heat” from above.
@Retired Engineer John:
Yes, the chemistry is straight forward. I’m not disputing that. (Heck, I’m not disputing any of it). It’s what I had in high school. I just don’t see any evidence that that process has any lasting effect. Bottom Water is “all over the board” on temps ( -4 to 4 C ) and chemistry (black smokers).
It just looks to be orthogonal to what is actually resulting. An interesting “side bar” on ocean chemistry. Basically, I just don’t see where it matters.
@Willis:
Perhaps the fact that we are slowly adding a couple of days to summer and removing a couple from winter in the Northern Hemisphere would have an impact:
https://chiefio.wordpress.com/2013/02/11/interesting-change-of-season-length/
http://individual.utoronto.ca/kalendis/solar/Season_Lengths_30K.png
RMB says: February 11, 2013 at 8:06 am
“….I put a post on this site saying that I attempted to heat water from above and found that the water rejected the heat totally….. ”
Sunlight certainly penetrates and warms water (I won’t comment on wavelengths involved) …. read up on Solar/saline Ponds … these ponds do also occur naturally, but in the case of artificial ponds most of the heat is absorbed in the black plastic base of the pond … but there is no doubt it is penetrating to that depth.
With the water convection reduced by the heavy layer of concentrated salt in the bottom, the base of the pond can actually reach boiling point. The upper layers of the pond, by the way, are about the concentration of sea water.
http://www.enersalt.com.au/Local%20Publish/html/solar_ponds.html
Checked out the enersalt site but i don’t think it has any relevance to what I’m saying.These ponds will accept radiation but I say that physical heat from the atmosphere willnot penetrate the surface of the water due surface tension. I tried heating water in a bucket with a heat gun and found to my astonishment that the water totally rejected the heat. This disobeys the second law of thermodynamics which as I understand it states that heat automatically flows from a heat source to a cooler surface. I found by further experiment that the only way to get heat into water from above was to float a baking dish on the surface which cancels the surface tension underneath y and then heat will flow into the water. I think we have seriously underestimated the power of surface tension and it needs a lot more study as to its ability to block heat. Get a bucket of water and a heat gun or even a hair dryer and try fo yourself. To sum up, youcannot heat a gas in the atmosphere and have the heat from that gas pass into the ocean. You cannot therefore store “excess” heat in the ocean and if you cannot do that AGW is dead.
re: RMB at 8:14 above. “450degsC, fan forced” invalidates your hypothesis. What you are seeing is not a “surface tension” effect but the increased evaporation caused by the increased flow of dry air that you created artificially. That is, the evaporative cooling is cancelling out the heat you’re adding. The addition of a floating baking dish to your experiment works only because the baking dish is dry. With no evaporative cooling from the upper surface of the dish, the dish heats and conduction then heats the water. You could accomplish the same thing with anything that blocks the evaporative cooling.
This will be tricky to set up with only home equipment but re-run your experiment with moisture-saturated air. If you can saturate the warm air above your body of water, there will be no evaporative cooling. At that point, you’ll see a clear flow of heat from the air above to your body of water below, just like you saw with the baking dish.
Despite the expression that “heat rises”, heat does not in fact obey gravity. (Well, okay, actually it does if you get to the extremes where General Relativity kicks in. But for human-scale events, heat is essentially massless and ignores gravity.) And again, surface tension has NOTHING to do with it.
I admire tenacity. If the water was staying cool due evaporation, to remove entirely the calorific value that I’m firing at the water, Iwould very quickly find myself sitting in a room full of steam. There is NO sign of steam whatsoever. Evaporation does NOT destroy my hypothesis in fact it doesn’t even put a dent in it.
The purpose of the baking dish is merely to simulate an upside down pot which it does very well. The difference between heat uptake between uncovered water and covered water is about 8 times 6degs and 48degs.
And you are right about heat it has no mass therefore no weight so how does it penetrate the surface tension that we know is there.
I say that you can heat co2 until you are blue in the face, the “excess” heat cannot enter and be stored in the ocean because of surface tension and therefore there is no such thing as anthropogenic global warming.
RMB, you are confusing absolute and relative humidity. By increasing the temperature and velocity of the air coming out of your heat gun, you are dramatically increasing the carrying capacity of the air. Think of it like stirring sugar into hot tea – more can go into solution _because_ the water is hotter and moving. Air evaporating into water works the same way. You will not see visible steam until you exceed the carrying capacity, that is, to go above 100% relative humidity. So, no, you would not expect to see steam in the scenario you described.
Second, I believe that you are dramatically overestimating the caloric content of heat that you’re adding to the air (air has little thermal mass so it doesn’t take much to increase the temperature) and dramatically underestimating the calories “consumed” by evaporation.
Let me try to propose a different thought experiment for you to dispel this idea of surface tension. Let’s maximize the influence of surface tension by going to an environment with no gravity – say the Space Station. Squirt a blob of very cold water (33F) into the middle of the room. Surface tension will cause the blob to form a sphere. The surrounding air is about 75F. Do you seriously content that, regardless of the starting temperature of the water or the temperature of the air in the room that the blob of water will never change temperature? Of course not. It will gradually heat up until it is within a few degrees of the temperature of the air. Like a bowl of terrestrial water, it will always be a few degrees colder because of the evaporation effects but it will still warm up.
Actually, that proposes a terrestrial experiment. Sink a bowl in styrofoam or other insulation to protect all but the top surface. Fill the bowl with ice water. By your theory, surface tension will perfectly insulate the top of the bowl and the ice will never melt. That obviously does not happen.
First the ice experiment. Ice is a solid and does not have surface tension therefore naturally it will absorb heat and melt. Once the ice has completely melted and only water remains, I say that you will no longer be able to heat the water through the surface.
Second the steam. Steam is simply condensed water and is not dependent in any way on relative humidity. The fact that there is no sign of steam is a dead giveaway that heat is not being absorbed by the water.
Thirdly the space experiment. very interesting but I don’t have access to a space ship. I only know that on this planet, I can’t get heat into water from above and until somebody comes up with a better theory I think surface tension blocks heat and AGW is complete nonsense.
Remember that the water at the surface of water is not the same as water in the main body and I just don’t think we know as much about this as we should.
Surface tension doesn’t really matter until you put on the table a hypothesis that the sun can heat a gas called co2 and the “excess” heat created can be stored in the ocean and build up. At that point the properties of surface tension become vital. cheers
Doing some alternative reading, I came across this quote by Alberto Miatello in his August 2012 paper “Refutation of the GHE theory on a Thermodynamic and Hydrostatic Basis”
“Indeed, the water cycle of the atmosphere could be described as a massive heat engine. And it follows that, if the lower troposphere, where all of the atmospheric warming is claimed to be occurring, according to the GHE supporters, were to warm and increase water evaporation, this heat engine would accelerate its activity and serve as a powerful negative feedback mechanism, keeping our climate rather constant and thus only sensitive to much larger factors, such as changes in solar input, ocean currents, and astronomical variables.”
This fully supports Willis’ view on the thermoregulatory property of thunderstorms.