Guest post by Dr. Leif Svalgaard
The official sunspot number is issued by SIDC in Brussels http://sidc.be/sunspot-data/ . The [relative] sunspot number was introduced by Rudolf Wolf http://en.wikipedia.org/wiki/Rudolf_Wolf in the middle of the 19th century. He called it the ‘relative’ number because it is rather like an index instead of the actual number of spots on the Sun. Spots occur in groups [which we today call ‘active regions’] and Wolf realized that the birth of a new group was a much more significant event than the emergence of just a single new spot within a group, so he designed his index, R, [for any given day] to be a weighted sum of the number of spots, S, and the number of groups, G, giving the groups a weight of 10: R = S + 10*G. The number of 10 was chosen because on average a group contains about 10 spots, and also because it is a convenient number to multiply by.

Later, Wolf introduced the so-called ‘k-factor’ to compensate for differences in the size of telescope, precise counting method, observer acuity, etc, in order to bring the relative sunspot number determined by another observer on to the same scale as Wolf’s: R = k (10*G + S), where k is 1 for Wolf himself using his ‘standard telescope’ [Figure 1a,b] and his rules [not counting the smallest spots] for counting spots. From the 1860s Wolf had to travel extensively and he used exclusively [for the rest of his life] a much smaller telescope [Figure 1c]. With a smaller telescope Wolf, obviously’ saw fewer spots [and groups!], so he used k = 1.5 to convert his counts to the scale of the standard telescope.
Wolf’s successor, Alfred Wolfer, thought [rightfully] that the rule of ‘not counting the smallest spots’ was too vague and advocated to count all spots and groups that could be seen. This, of course, made his count larger than Wolf’s, so based on overlapping counts during 1876-1893, determined that to place his [Wolfer’s] relative number on to the Wolf scale he should multiply by 0.6 [one could say that his k-factor was 0.6]. This conversion factor of 0.6 has been adopted by all [Zurich] observers ever since. Adopted, not measured, as Wolf is not around any more. SIDC adopts that same factor, thus striving to stay on the Zurich scale.
So far, so good. But at some point in the 1940s, the Zurich observers began to ‘weight’ sunspots according to size and complexity, such that large spots would not be counted just once [as Wolf and Wolfer did], but up to five times, i.e. given a weight of five. There is nothing wrong with that, if one then also adjusts the k-factor to reflect this new way of counting. The director of the Zurich observatory from 1945-1979, Max Waldmeier, may have thought [?] that the weighting was introduced a long time ago [he mentions ‘about 1882’] so that no change of k-factor would be needed. Waldmeier set up a station in Locarno in southern Switzerland [as the weather on the other side of the Alps is often complimentary to that in Zurich] to provide observations when it was cloudy in Zurich. The observers in Locarno [Sergio Cortesi began in 1957 and is still at it] were instructed to use the same weighting scale as Waldmeier in Zurich. Because SIDC to this day normalize all observations they collect from a network of 60-70 observers to the count from Locarno, the weighting scheme carries over unchanged to the modern sunspot number.
We know that Wolfer did not weight the spots [contrary to Waldmeier’s assertion], because Wolfer himself explicitly [in 1907] stated that each ‘spot is counted only once, regardless of size’, and also because Wolfer’s counts as late as in 1924 when compared to other observers’ simply show that single spots are counted only once no matter how large.
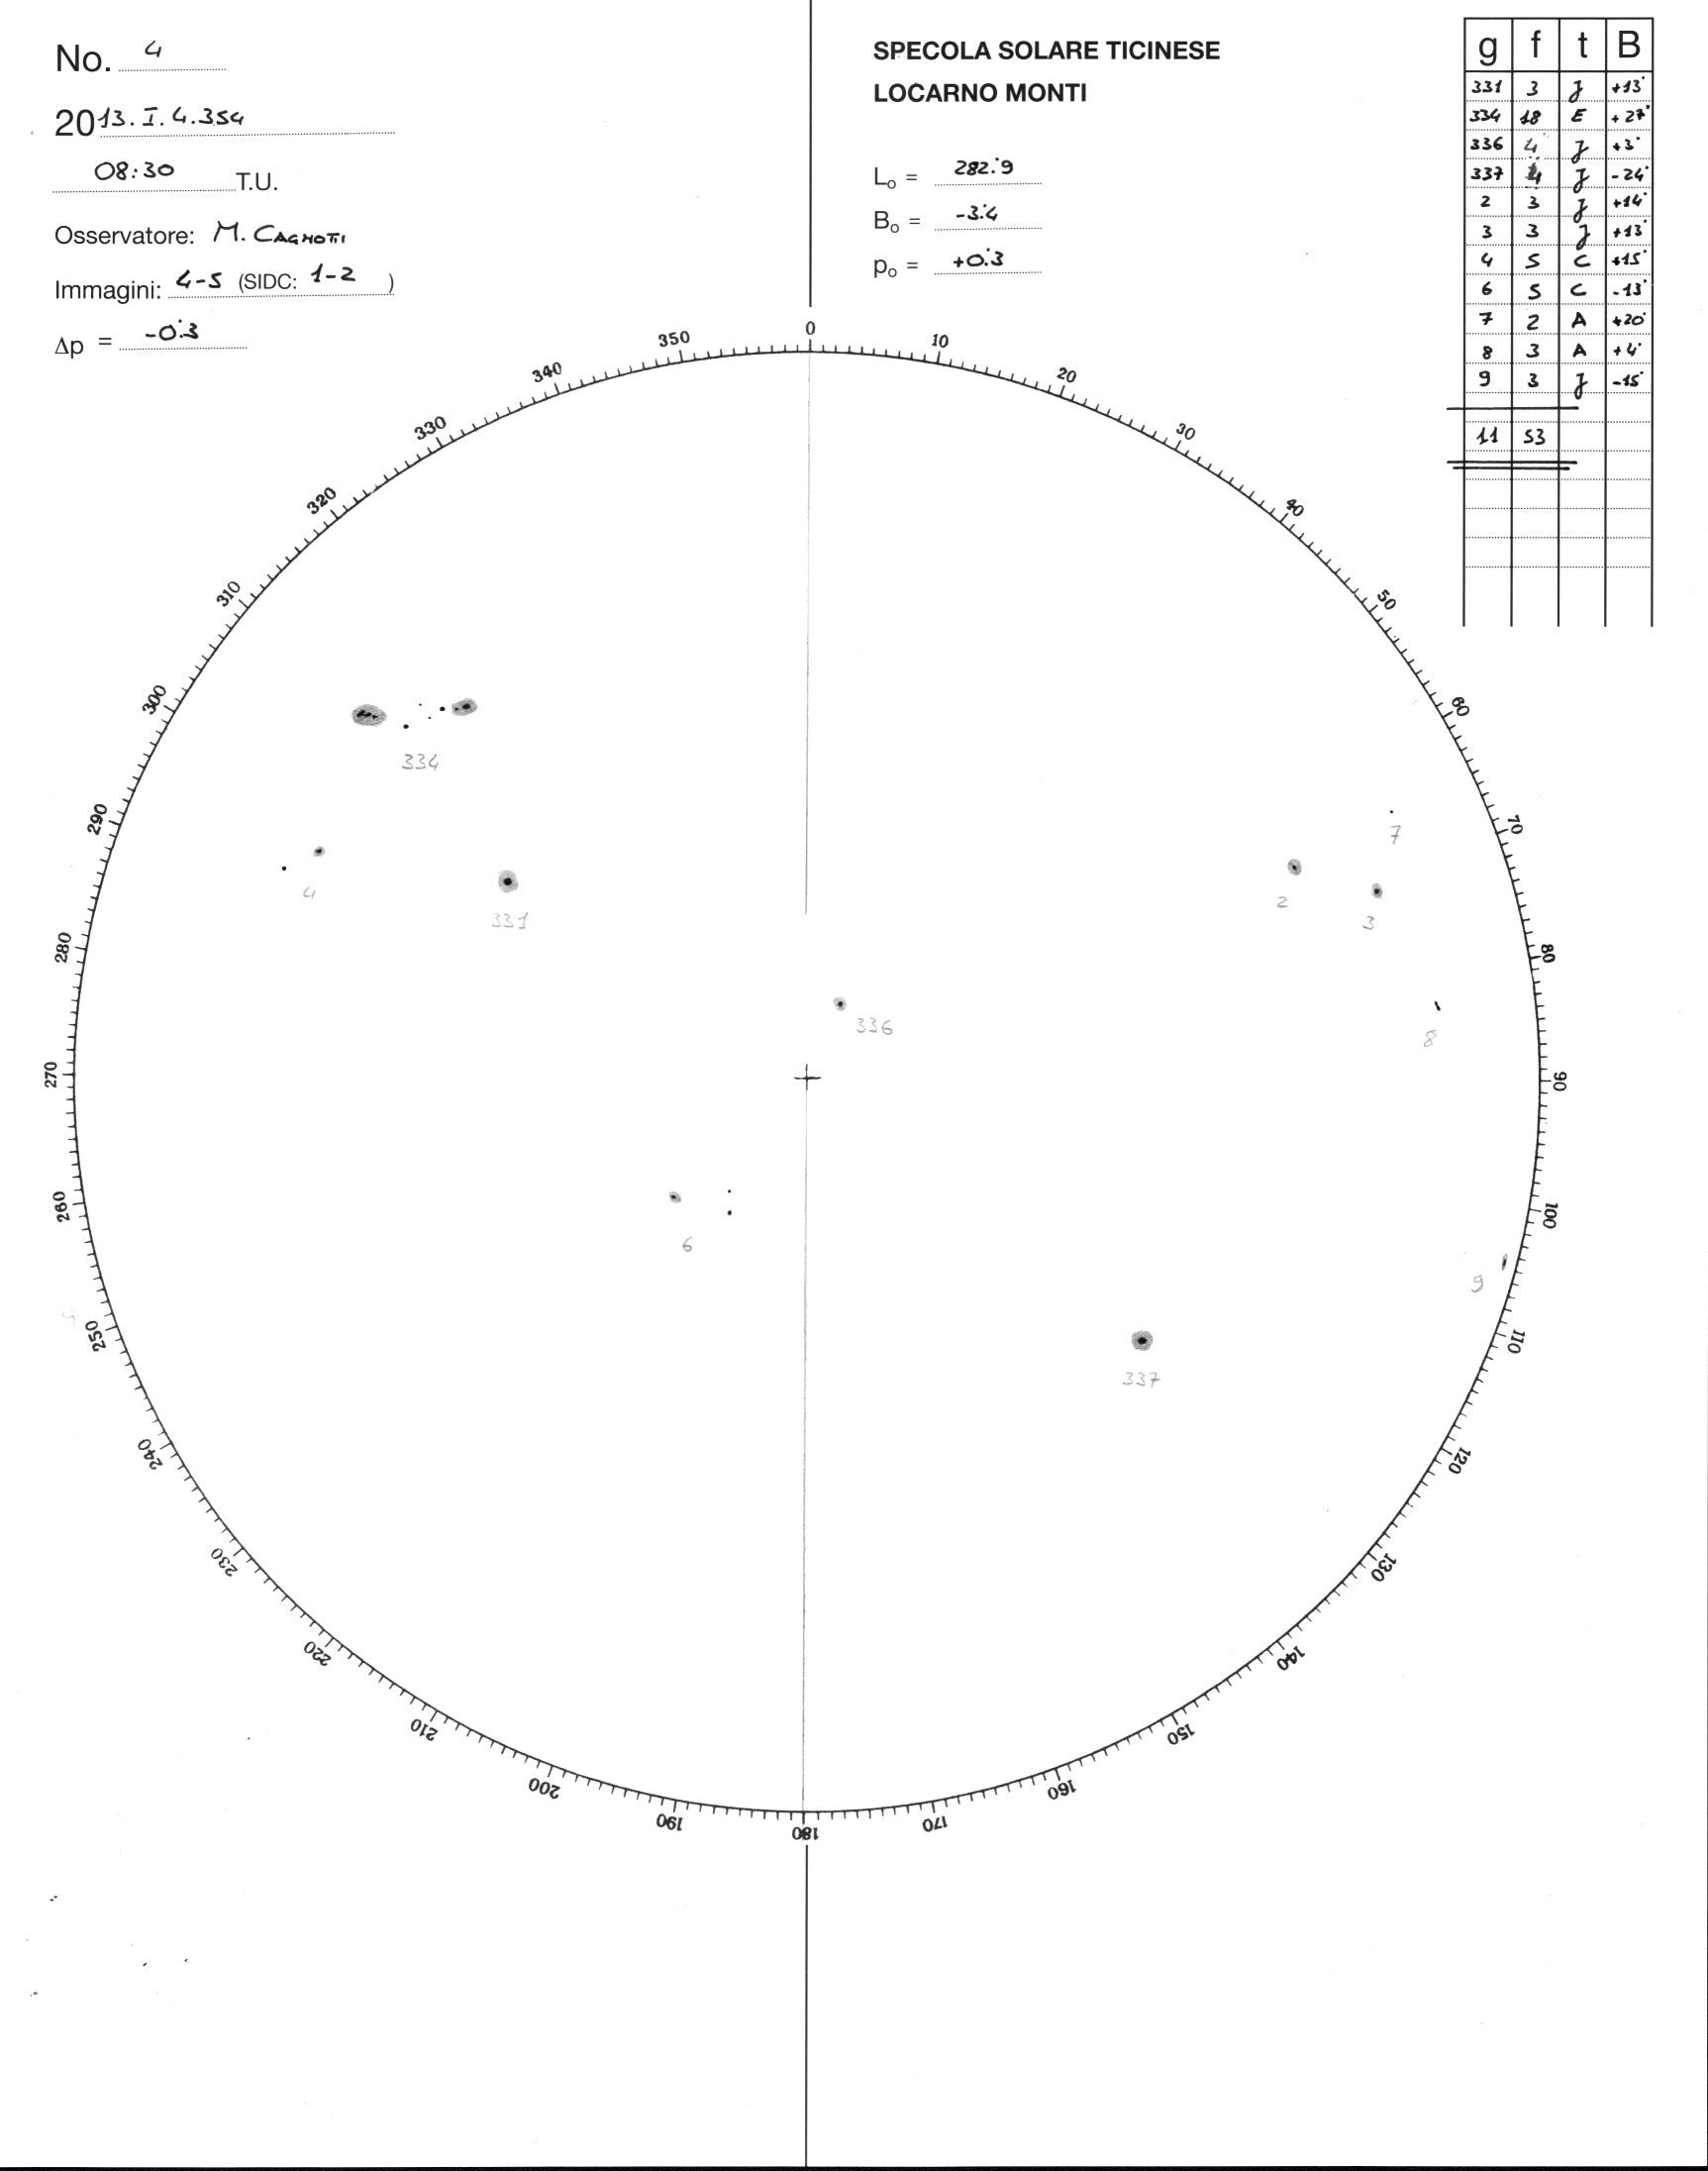
To get a feeling for how the weighting works, try to count the spots on the Locarno drawing for today http://www.specola.ch/drawings/2013/loc-d20130104.JPG and compare your counts with the values given for each numbered group in the little table at the upper right.
![loc-d20130104[1]](http://wattsupwiththat.files.wordpress.com/2013/01/loc-d201301041.jpg?resize=640%2C813)
(Note: I did this exercise, and found that my layman’s count was much lower than the “official” count, lending credence to Leif’s premise. Try it! – Anthony)
Marco Cagnotti’s [from Locarno] count is 11 groups and 53 ‘weighted’ spots. My count of the actual number of spots is 23. Try it for yourself. Your count may differ by about one from mine, but that does not change the fact that the weighted relative number 10*11+53=163 is about 23% larger than the ‘raw’, simple count of 10*11+23=133 that Wolfer and Wolf would have reported. For the whole of 2012 the ‘over count’ was 18%. So, it seems that the relative sunspot number suffered a 20% inflation because Waldmeier did not change his k-factor to compensate for the weighting.
Can we verify any of this? Well, one verification you can do yourself: just count the spots. But a better test is to ask the Locarno observers to report two numbers: the weighted count as usual and the unweighted count, where each spot is counted just once. Such a test has been [as is being] done. Figure 2 shows the effect of the weighting. Blue symbols show the official weighted count, and red symbols show Marco and my raw counts. The conclusion should be obvious.

The top panel of Figure 3 shows how well the sunspot number calculated from this formula matches that reporter by the Zurich observers.

Applying the same formula to data after 1945 gives us the lower panel. Under the assumption that the Sun did not know about Waldmeier we would expect the same relationship to hold, but in fact there is an abrupt change of the observed vs. the expected sunspot numbers between 1946 and 1947 of [you guessed it] 20%. Several other solar indicators give the same result. So there are several smoking guns.
What to do about this? One obvious thing would be to simply to remove the inflation [dividing the modern sunspot number by 1.20] and to stop weighting the spots. This turns out to be a bad idea, at least users of the sunspot numbers complain that they do not want to change the modern numbers as they are used in operational programs. The next-best thing is to adjust the old numbers before 1947 by multiplying them by 1.20. This is what we have decided to do [at least for now]. Who are ‘we’? You can see that here http://ssnworkshop.wikia.com/wiki/Home
There is a precedent for this [with the same ‘solution’]. In 1861 Wolf had published his first list of relative sunspot numbers, which he then updated every year after that. But about 1875 he realized that he had underestimated Schwabe’s counts [which formed the backbone of the list before Wolf’s own observations began in 1849]. Consequently, Wolf increased wholesale all the published sunspot numbers before 1849 by 25%. So we are in good company.
A somewhat disturbing [to many people] consequence of the correction of the official sunspot number is that there is now no evidence for a Modern Grand Maximum [‘the largest in 8000 years’ or some such].
NOTE: Figure 4 added 1/5/13 at Leif’s request

Thanks, Leif. And a Happy New Year to you!
An informing and interesting post, thank you Leif and Anthony!
I suspect that you mean “no evidence in the adjusted sunspot counts.” There are other lines of evidence, including beryllium-10 as a proxy (which is actually a proxy for galactic cosmic rays, themselves an implied proxy (as a reciprical) for solar wind which has been connected with sunspots.
While the connection to sunspots directly from this measure is tenuous, Be-10 is a more direct proxy for solar output in general, and this seems to correspond reasonably well to other measurements including the old-style sunspot measurements.
Independent of sunspots, the sun seems to vary over time, was high recently, and is dropping now — something you noted yourself on the last page of your report.
As you said: “Exciting times!”
===|==============/ Keith DeHavelle
Thanks, Dr. Leif, this is timely, as i wait the December SSN and its effect on the Smoothed Monthly Values. I’ve read a good bit of your papers site, and understood somewhat less. We live in interesting times.
Nice. At least the time series hasn’t been *deliberately* distorted, unlike some we could all mention.
PS: Either need a bigger screen or new glasses – only counted 17.
but would it be fair to say we are going into a minimum ??
As I understand it, Solar Maximum is defined when the Northern and Southern solar hemispheres’ magnetic fields reach a minimum and reverse polarity. They’re close but SC-24 maximum still approaches.
I was fine up to and including the 1+1 = 2 part… after that I kinda lost the thread and it got a little vague — maybe if I re-read… 😉
The graphic is in this file http://www.leif.org/research/AGU%20Fall%202012%20SH12A-07.ppt
Slide number 3
Thank you Dr. Svalgaard. I’m sure the pure minded are upset. As long as things are on the same relative base and no one is trying to calculate some absolute value, it makes little real difference. The danger, always present, is people will run off making assumptions that are not founded in facts but suppositions.
A worthwhile posting; should help to clear up some of the confusion seen on WUWT
“A somewhat disturbing [to many people] consequence of the correction of the official sunspot number is that there is now no evidence for a Modern Grand Maximum [‘the largest in 8000 years’ or some such].”
What does that mean?
Rather, what are the implications of that statement? (The consequences of not having had a Modern Grand Maximum.)
I am aware I may be showing some ignorance here; humor me, please.
But isn’t all of this a bit simplistic? It assumes that 10 is the appropriate correction factor at minimum and maximum, and in active and inactive solar cycles, and in cycles with a Livingston and Penn effect and those without. Why not just count the visible spots above a certain size and call it a day.
Why is it that every single data series has to be tampered with? How the hell can you expect to get a fair comparison of past events to current events if you “adjust” the record? Oh, wait …
Keith DeHavelle says:
January 4, 2013 at 3:07 pm
Be-10 is a more direct proxy for solar output in general
No, 10Be depends on the geomagnetic field [the biggest factor], climate [the next biggest], and finally solar activity.
fred says:
January 4, 2013 at 4:03 pm
Why not just count the visible spots above a certain size and call it a day.
That is what we suggest. That ‘certain size’ being zero.
markstoval says:
January 4, 2013 at 4:08 pm
Why is it that every single data series has to be tampered with?
Why is it that some people cannot follow a straightforward demonstration?
Great/interesting post.
@markstoval,
Except that in the case of the sunspot numbers you don’t have a continuous string of consistent observations. Observations in different time periods were done use different methods and the variance in this case is a process not a technology issue. It is therefore impossible to make a valid comparison between current and past observations without adjusting one or the other.
This can be a problem in the land surface temperature records as well, but it the case of temperature it is minor vs all the other problems.
why on earth would someone say-
“A somewhat disturbing [to many people] consequence of the correction of the official sunspot number is that there is now no evidence for a Modern Grand Maximum [‘the largest in 8000 years’ or some such].”
that makes no sense at all. first if you add both those charts together, you see no difference than the ‘uncorrected’ figures, it still peaks around 19 and 21 and 22 are higher than earlier years. ie it is still on the rise until the great crash of 23/24. its obvious even in the butterfly diagram-
http://en.wikipedia.org/wiki/File:Sunspot-bfly.gif
the beryllium proxy also backs up the recent high conditions.
Leif
In an earlier track you provided the decadal average sunspot numbers for the new derived sunspot numbers for the period 1830 to1940. Is there a source for the derived annual figures? Also to what extent have these new numbers been accepted by all of your colleagues?
Just to confirm explicitly what you are implying in your response: When you wrote “there is now no evidence for a Modern Grand Maximum” you are now correcting this to note that there is indeed some evidence for this solar maximum outside of sunspots.
It seems to me that you are overstating the case even so, with regard to sunspots. Using your corrected numbers, sunspot activity for the last half of the 20th century is visibly higher than the prior half, and 20C values higher than earlier centuries. That the sunspot activity might vary somewhat less than thought does not mean that it is not varying significantly, agreed?
The math isn’t hairy
And logic’s not scary
But here I would parry
The numbers still vary
The new count of spot
Might be less than thought
But if they’re more hot
Then what have you got?
===|==============/ Keith DeHavelle
Leif, as always, most informative. My thanks.
w.
Ach, Waldmeier… Perhaps, after Wolf and Wolfer, had they chosen a guy named “Wolfest” to the post we would have been spared this apotheticary accounting!
Yet on Figure 3, discarding the infamous blue curve and only using the virtuous red curve (Rc), we still end up with the top of 1935-1944 and 1955-1964 solar cycles spot count culminating over all others. Furthermore, all solar cycles post 1945, except the 1970 centered one -and so far cycle 24-, still exhibit more 100 counts than their pre-1945 ancestors.
Is this spurious or the reality?
When I started reading, I was afraid that I was going to discover yet another series that has been deliberately distorted. Fortunately, here, people still seems to be looking for the truth and not busy hiding it.
MattS says:
January 4, 2013 at 4:34 pm
It is therefore impossible to make a valid comparison between current and past observations without adjusting one or the other.
Wolf himself discovered [and actually used] how to make a valid comparison. Perhaps a topic for a future post, but here is the basic idea:
http://www.leif.org/research/Geomagnetic%20Calibration%20of%20Sunspot%20Numbers.pdf
mobihci says:
January 4, 2013 at 4:36 pm
it still peaks around 19 and 21 and 22 are higher than earlier years. ie it is still on the rise until the great crash of 23/24. its obvious even in the butterfly diagram-
Indeed some cycles are higher than others. The point is that there are high cycles in every century and no long-term trend the past 300 years.
herkimer says:
January 4, 2013 at 4:37 pm
derived annual figures? Also to what extent have these new numbers been accepted by all of your colleagues?
The simplest is to multiply all sunspot numbers [which you can ghet from SIDC] by 1.2 before 1947.
There is no doubt about the discontinuity arounbd 1946. And the remedy for it. There can be [and is] debate as to how good the numbers [even after correction] are for the early part of the series, e.g. before 1825. This issue is the topic for the next two workshops scheduled for later this year.
Keith DeHavelle says:
January 4, 2013 at 5:01 pm
Just to confirm explicitly what you are implying in your response: When you wrote “there is now no evidence for a Modern Grand Maximum” you are now correcting this to note that there is indeed some evidence for this solar maximum outside of sunspots.
No, that is not what I meant.
Using your corrected numbers, sunspot activity for the last half of the 20th century is visibly higher than the prior half, and 20C values higher than earlier centuries.
Indeed some cycles are bigger than others. The point is there are high cycles in every century. Some 20C cycles are high, but do not qualify as a ‘Grand Maximum’. Now, one can debate the semantics of ‘Grand Maximum’. What is usually meant can be seen in slides 4-7 of http://www.leif.org/research/The%20long-term%20variation%20of%20solar%20activity.pdf
Leif is a true scientist. He doesn’t make extravagant claims about things he doesn’t know. He makes conservative statements about things he is sure about. He openly states the limits of his knowledge, and if challenged can explain absolutely everything he does in as much detail as his audience can comprehend. He never appeals to authority or talks down to people. He doesn’t need to do that. He just knows more about sunspots than just about anyone else in the world. That what a scientist should be like and indeed what most scientists are like.
As Leif notes some here would find a grand solar maximum convenient as is would help to provide an alternative explanation for the late 20th century temperature increase. Nevertheless Leif can come here and argue with those who disagree with him and wipe the floor with anyone who chooses to challenge him on his subject, the sunspot record. This is what a scientist should be.
Could you imagine Mann trying to defend his hockey stick here? He’d get his head handed to him.
TomRude says:
January 4, 2013 at 5:07 pm
Is this spurious or the reality?
The red curve [upper right] on slide 7 of
http://www.leif.org/research/The%20long-term%20variation%20of%20solar%20activity.pdf
shows the series since 1700. The 20th century does not any longer qualify as a ‘Grand Maximum’
[at least I would not call it that, perhaps you would cling to the notion that it is?].
Big D in TX says:
January 4, 2013 at 4:02 pm
“A somewhat disturbing [to many people] consequence of the correction of the official sunspot number is that there is now no evidence for a Modern Grand Maximum [‘the largest in 8000 years’ or some such].”
What does that mean?
Rather, what are the implications of that statement? (The consequences of not having had a Modern Grand Maximum.)
I am aware I may be showing some ignorance here; humor me, please.
No need to worry ,Big D. That’s what a lot of us guys/gals come here for…..to learn. You can teach to ignorance ,stupidity is terminal.
And BTW…..had the same myself….you just beat me to it :):)
Since Wolf started his observation in the middle of the 19 century and that “At the Royal Greenwich Observatory photographs of the Sun have been taken ‘every’ day since 1874 until they stopped in 1975. From these photographs the RGO determined the area of all sunspots for every day”, we are only talking about 25 years of observation –roughly two solar cycles- at most that are litigious, i.e. without any other objective source of information such as photographs than Wolf’s. Would it be so difficult to recount the data once for all, introduce an uncertainty factor for the earliest two cycles observed by Wolf and, publish two reference datasets: the raw count and with today’s benefit of understanding solar physics and processes, offer an acceptable weighting for clusters versus spots if need be in a second dataset?
Also, in one comment, the author writes “Indeed some cycles are higher than others. The point is that there are high cycles in every century and no long-term trend the past 300 years”… Since sun spot counts was introduced by Wolf “in the middle of the 19th century”, it will only be 200 years of sun spot counting by 2050. What other dataset is used for the remaining 100 years of so of this trend, or absence of thereof?
IanH
‘Leif is a true scientist. He doesn’t make extravagant claims about things he doesn’t know. He makes conservative statements about things he is sure about. He openly states the limits of his knowledge, and if challenged can explain absolutely everything he does in as much detail as his audience can comprehend. He never appeals to authority or talks down to people. He doesn’t need to do that. He just knows more about sunspots than just about anyone else in the world. That what a scientist should be like and indeed what most scientists are like. ‘
+10 (on a scale of 1 to 10)
Why is it that every single data series has to be tampered with?
Perhaps it’s worth remembering that our host, Anthony Watts, is involved in a project that may “tamper” with a data series. His assessment of the changing standards of weather surface stations with time (I hope that’s a close description) might result in a re-examination and adjustment of the temperature record towards accuracy.
This is generally regarded around these parts as a good thing. Yet some dismiss Dr Svalgaard’s project as “sunspot fiddling”. Very unfair and not conducive to clear thinking.
If scientific records have become distorted for any reason, we need to know and should welcome any properly conducted studies that reveal and correct the distortions.
Thank you. As usual, very in formative..
This is what drives me crazy, start with an inexact system and proceed to twist it this way and that to suit whatever the current think wants it to be. I understand the desire to have a continuous record but in the many adjustments, one improper figure throws the whole thing off. Your system also assumes, that is a recipe for failure.
Considering that the Holocene has been underway for quite some time now I suspect that a 300 year record matters very little in the full scope of the suns life or cycles. Your “hasn’t changed in the last three hundred year” line.. is averaging?? Because if not you seem to be ignoring times when the sun has been active and inactive in our current times and recent past and if we have seen anything clearly, its that when the sun gets quieter for some reason it gets colder, and pretty darn quickly…. until you can explain this phenomenon keep at that drawing board because you are missing something EXTREMELY fundamental in the process.
@ Dr. Leif Svalgaard
Is there a place we can get raw sunspot data back to as close to 1600 as possible, numbers that you would consider “good”?
Please do not put words in my mouth. I was just asking and, just like Mobihci or Keith DeHavelle noticing the intensity of these 20C cycles, still stronger -according to properly accounted for sun spot counts- than 19C cycles. If not MGM why not Paramount for a naming?
BTW given these observed sun variations and the relatively short period of direct observation compared to let’s say the last glacial/interglacial time frame, what magnitude of variation would make you consider some direct control on Earth climate a possibility? In other words, for instance cycle 20 versus 21: top 140 spots versus top 80 spots, that is quite a serious variation – 43% in one cycle. Meteorologically the climatic shift of the 1970s is well documented -including in atmospheric pressure series all over the globe. Yet, we did not go to widespread glaciation, suggesting either buffering or a tamed role.
Great read!
Thanks
i have learned a supplemental lesson with respect to the exercise of counting sun spots on a white background above. Ensure the monitor is properly cleaned prior to counting 🙂
@John West, File 1520 at his http://www.leif.org/research/?
AAAAAAAAAAAAAAAARGH!
I figured I’d put a red dot with a felt marker on the screen over every sun spot so I don’t count any twice. I checked twice, I was SURE is was dry erase….
[Reply: Hopefully a /humor;> but if not: Try increasing strength of solvents starting with water, then soap and water, then rubbing alcohol, then acetone (nail polish remover), then ‘organic solvent’ (hexane, gasoline). Hopefully it is a glass monitor and has no anti-reflection coating. If a flat screen / plastic, be very cautious with any thing beyond soap and water and test a corner / edge area first. On a flat screen / LCD hardening the ink and flexing the surface can sometimes flake it off (ice cube – as used with gum in hair). Good luck. -ModE]
Ensure the monitor is properly cleaned prior to counting 🙂
OMG, I might have to go back and tamper with my data series. 😉
I have to second the notion that if they have photos, a ‘recalibration’ from the original material ought to be possible / done. ( IF they trashed the negatives then “Oh Well”…)
When I learned lab work, we had a notebook in which ALL data and work were recorded. It was forbidden (got you an automatic “F” Fail grade) to have ANY erasure. If something needed changing, you put a line through and annotated why the following replacement was to be used. Does no-one do that any more? Is there no record of “Original raw counts and sizes, then factors applied, then resultant ‘counts'” sitting in some lab book archive at the observatory?
Seems like a pretty simple and very effective protection against just this kind of “Aw Shoot” retrospective oopsy fixing…
( The more I experience the product of professional science, the more I appreciate what was taught to me in High School Science classes… by a retired Lt. Colonel from the Air Force W.W.II who was also a retired research chemist from U.S. Steel. Had rather, um, strict rules about things… rules that prevented an awful lot of ‘issues’…)
Sunspot count is only a proxy for what happened to the sun in the past and what is happening to the sun currently.
What is currently happening to the sun? (i.e. Say the last three or four cycles which are fully instrumented.)
Why are the solar cycle 24 sunspots getting smaller? Why the abrupt change in the solar magnetic cycle? What are the theoretical implications of no sunspots?
How would the solar magnetic cycle restart if there were no sunspots?
http://www.solen.info/solar/
Why is the solar large scalar polar field declining? How low can it go?
http://www.solen.info/solar/polarfields/polar.html
Are there any other anomalous solar observations?
@Justthinking
>…what are the implications of that statement?
> (The consequences of not having had a Modern Grand Maximum.)
The lack of solar grand maxima is not devastating to the functioning of the Universe. But it does devestate certain pet theories of climate scientists/buffs, which claim to prove/disprove AGW or similar stuff.
😐
I got 22. I was so hoping for 42 so we would all have the meaning of life but that is another story. Great history and lucid description of a very interesting problem. Thanks.
[Reply: Hopefully a /humor;> but if not: Try increasing strength of solvents starting with water,
>>>>>>>>>>>>>
Nah, I do some really dumb things sometimes…OK, really often. I’m a continuous stream of mishaps.
Isopropyl alcohol cleans permanent marker up lickety split I’ve discovered.
@ E. M. Smith
Yes, we still cross out, initial, and annotate except now it’s likely to be electronic, but not always (there’s still some archaic regulations that require actual notebooks).
Rubbing permanent marker ink with a dry erase marker will result in a wipe-off-clean blob on most surfaces.
“A somewhat disturbing [to many people] consequence of the correction of the official sunspot number is that there is now no evidence for a Modern Grand Maximum [‘the largest in 8000 years’ or some such].”
I knew as soon as I started reading this that this was going to be about the highest sunspot activity in the last 8000 years. Why? Because quite a few weaknesses in the science skeptics have been pointing out have been getting adjusted or modeled out by scientists later on.
I find it hard to believe that the science that worked against or weakened the case for AGW was wrong in all those cases.
TomRude says:
January 4, 2013 at 5:36 pm
Since Wolf started his observation in the middle of the 19 century and that “At the Royal Greenwich Observatory photographs of the Sun have been taken ‘every’ day since 1874 until they stopped in 1975. From these photographs the RGO determined the area of all sunspots for every day”, we are only talking about 25 years of observation
The RGO data is a 100 years and Wolf’s series is 160 years plus the data back to 1610, 400 years.
Since sun spot counts was introduced by Wolf “in the middle of the 19th century”,
Wolf invented his relative sunspot number around 1850, but dug up observations back to 1610 and constructed sunspot numbers back to about 1700. Wolf continued to 1893 and after that his successors have brought it up to the present day.
PJF says:
January 4, 2013 at 5:38 pm
This is generally regarded around these parts as a good thing. Yet some dismiss Dr Svalgaard’s project as “sunspot fiddling”. Very unfair and not conducive to clear thinking.
If scientific records have become distorted for any reason, we need to know and should welcome any properly conducted studies that reveal and correct the distortions.
Exactly, and that goes for any data set.
pkatt says:
January 4, 2013 at 5:47 pm
This is what drives me crazy
I don’t deal with crazy people. Come back when you have something substantial.
John West says:
January 4, 2013 at 5:48 pm
Is there a place we can get raw sunspot data back to as close to 1600 as possible, numbers that you would consider “good”?
No, not yet. But you can get a good approximation back to 1700 from SIDC’s website. Then multiply every number prior to the year 1947 by 1.2 and you’ll be close to what I think we will end up with.
TomRude says:
January 4, 2013 at 6:04 pm
BTW given these observed sun variations and the relatively short period of direct observation compared to let’s say the last glacial/interglacial time frame, what magnitude of variation would make you consider some direct control on Earth climate a possibility?
I think we have within the observed series about the full range the sun can do. There are other stars with much more violent cycles, but solar-type stars are rather sedate.
Doug Huffman says:
January 4, 2013 at 6:16 pm
I figured I’d put a red dot with a felt marker on the screen over every sun spot so I don’t count any twice.
just click on the image and you get a much bigger version.
E.M.Smith says:
January 4, 2013 at 6:38 pm
I have to second the notion that if they have photos, a ‘recalibration’ from the original material ought to be possible / done. ( IF they trashed the negatives then “Oh Well”…)
This is being done, but only gets us back to 1874. And the RGO photographs don’t have a constant ‘calibration’ themselves so don’t really help much. But were good enough to show the discontinuity in 1946.
then resultant ‘counts’” sitting in some lab book archive at the observatory?
It is sad to say, but it seems that Waldmeier destroyed or ‘disappeared’ all the archives from observatory. I have been there to check and the material is gone.
William says:
January 4, 2013 at 6:45 pm
Why are the solar cycle 24 sunspots getting smaller? Why the abrupt change in the solar magnetic cycle? What are the theoretical implications of no sunspots?
Many questions. We don’t know all the answers.
How would the solar magnetic cycle restart if there were no sunspots?
No sunspots does not mean the solar magnetic cycle has gone away. On the contrary, during the Maunder Minimum cosmic ray modulation was a strong as ever.
Why is the solar large scalar polar field declining? How low can it go?
It is declining becasue there are fewer spots to feed the field. Why there are fewer spots, we don’t know.
Are there any other anomalous solar observations?
Yes: http://www.leif.org/research/Disappearance-of-Visible-Spots.pdf
John Day says:
January 4, 2013 at 6:54 pm
The lack of solar grand maxima is not devastating to the functioning of the Universe. But it does devastate certain pet theories of climate scientists/buffs, which claim to prove/disprove AGW or similar stuff.
Yep.
EM Smith said:
Here here! I learned that working in Aerospace. Every change, including serializing parts had to be lined out but still legible and identified with our Inspector/Engineer ID. On documents relating to them, same thing with date and annotations for the edit; virtually everything documented. Oh, and absolutely NO RED INK. Red=scrap. Pencils? Pack your things.
Being under FAA jurisdiction we would get in very big trouble scribbling, erasing or deleting data even if for tests being done incorrectly needing redoing; unacceptable and actionable if violated.
When discovering how things were done in climate science it was appalling to say the least the sloppiness and lack of archiving data, including Mulligans.
davidmhoffer says:
January 4, 2013 at 6:32 pm
“AAAAAAAAAAAAAAAARGH!
I figured I’d put a red dot with a felt marker on the screen over every sun spot so I don’t count any twice. I checked twice, I was SURE is was dry erase….”
Next time use alt printscreen to copy the image into the clipboard. Use shift insert to copy into MS Paint or other paint program. Erase every spot you count with the eraser tool of the paint program.
That’s how I would do it at least. Avoid physical objects like felt markers when possible.
Have been Schwabe’s original counts been preserved, or are we in a position of just correcting Wolf’s corrections? In other words, can we always access the original uncorrected data?
Thank you for the detailed answers.
davidmhoffer says:
January 4, 2013 at 7:01 pm
Nah, I do some really dumb things sometimes…OK, really often. I’m a continuous stream of mishaps.
Isopropyl alcohol cleans permanent marker up lickety split I’ve discovered.
hear hear! I absolutely swear by IPA for all manner of uses. I keep a couple of gallons of it in my garage and have a number of spray bottles containing varying solutions under my kitchen sink which I will typically use for cleaning heat-sink compound from CPUs and ICs, cleaning motorcycle engine parts after refurbishment or repair, cleaning all manner of computer externals including keyboards and screens , cleaning the uPVC window frames on the conservatory and even to sanitise the various cuts i inevitably end up with by messing with such things.
I have similar fetish for orange oil, but for different uses.
From the 1860s Wolf had to travel extensively and he used exclusively [for the rest of his life] a much smaller telescope [Figure 1c]. With a smaller telescope Wolf, obviously’ saw fewer spots [and groups!], so he used k = 1.5 to convert his counts to the scale of the standard telescope.
Is there a record of how he derived this figure? It doesn’t seem directly related to the resolving power of the apertures involved, so I’m guessing there’s a compensation added for different image scales due to different magnifications. Just an academic enquiry, not a challenge to his or other results.
On figure 1, the telescope in section a is labelled “Wolfer”, yet the description states the telescope was Wolf’s. Did Wolfer inherit Wolf’s ‘scope along with his mantle? If a next generation leader of solar science is called Dr Svalgrad, outsiders may be yet more easily confused.
Wolf’s different apertures and his travel prompted a thought regarding atmospheric “seeing”. I’m an amateur (casual) astronomer, and I’ve noted big effects on visible solar detail due to varying atmospheric instability. At different times of the same day, and from one day to the next, the amount of discernable detail differs. This difference can be accentuated in larger apertures. In a steady atmosphere, my six inch ‘scope shows lots more detail than my three inch. But in an unsteady atmosphere the detail levels can be quite similarly low in both instruments. There will be seasonal variations (hot days vs cold days; sun high up vs low down), geographical variations, and weather / climate variations (a jet stream overhead can ruin observing for many months).
I understand the causes of these, but I’m curious as to whether Wolf and his peers had any systematic way of allowing for the effects on observation. His career predates the likes of the Pickering scale:
http://www.damianpeach.com/pickering.htm
(nice visual representation here – for the night sky)
or the Mt. Wilson Solar Seeing Scale:
http://obs.astro.ucla.edu/150_draw.html
The sun alters atmospheric steadiness short and long term, and the altered atmosphere impacts measurements of the sun. Maybe complicates things?
– I feel strangely compelled here to make a general safety comment about observing the sun. Do not observe the sun with any optical instrument, even low power binoculars, unless the proper protection has been applied – permanent, painful blindness may result.
lsvalgaard;
so he designed his index, R, [for any given day] to be a weighted sum of the number of spots, S, and the number of groups, G, giving the groups a weight of 10: R = S + 10*G. The number of 10 was chosen because on average a group contains about 10 spots, and also because it is a convenient number to multiply by.
>>>>>>>>>>>>>>>>
Uhm, hold on, I be a bit confused. Am I to understand that the entire system is predicated on an artificial math construct that started out as a judgment call?
davidmhoffer says:
January 4, 2013 at 6:32 pm
AAAAAAAAAAAAAAAARGH!
I figured I’d put a red dot with a felt marker on the screen over every sun spot so I don’t count any twice. I checked twice, I was SURE is was dry erase….
++++++++++++++++++++++++++++++++++++++++++++++++++++++++++++++++++++++++++
One tip I have seen for removing permanent marker from dry erase boards is to trace over it with a dry erase marker. The dry erase ink will dissolve the permanent ink. I have tried this and it does work. I would be willing to bet it would work as a method for removing permanent marker marks from any non-permeable surface.
after looking at the pdf with the earlier helsinki data, it does look fairly close to world temps eg-
http://wattsupwiththat.files.wordpress.com/2011/11/tbrown_figure6.png
1810 to 1870 was a fairly warm period.
Not sure what constitutes a grand maximum, but even with your reconstruction TSI and SSN have been on an uptrend. I added a trend line and some “average” lines, this recent burst of activity almost didn’t even go below the long term average. Each successive cluster of roughly 60yrs stays higher for longer. Even the lows of the 60yr clusters are successively higher. This will likely crash after the peak of this cycle (and the next), but it’s been an interesting non-maximum.
http://s852.beta.photobucket.com/user/etregembo/media/Leifs_TSI_SSN_zpsd657ab1f.png.html
DirkH says: (and others)
January 4, 2013 at 8:23 pm (replying to)
davidmhoffer says:
January 4, 2013 at 6:32 pm
Well, at least he didn’t use whiteout on his PC screen …. 8<)
Reblogged this on sainsfilteknologi and commented:
Sun Spot
DR says:
January 4, 2013 at 7:55 pm
Hear hear!
unfortunately, that will not bring back the missing archives.
Andrejs Vanags says:
January 4, 2013 at 8:29 pm
Have Schwabe’s original counts been preserved, or are we in a position of just correcting Wolf’s corrections? In other words, can we always access the original uncorrected data?
Schwabe’s original drawings still exist. They are being digitized as we speak, as part of the SSN workshop effort:
http://www.leif.org/research/SSN/Arlt.pdf
http://www.leif.org/research/SSN/Arlt2.pdf
http://www.leif.org/research/SSN/Arlt3.pdf
PJF says:
January 4, 2013 at 9:04 pm
“From the 1860s Wolf had to travel extensively and he used exclusively [for the rest of his life] a much smaller telescope [Figure 1c]. With a smaller telescope Wolf, obviously’ saw fewer spots [and groups!], so he used k = 1.5 to convert his counts to the scale of the standard telescope.”
Is there a record of how he derived this figure?
Yes, and the telescope still exists and we can verify that number [it is about right].
On figure 1, the telescope in section a is labelled “Wolfer”, yet the description states the telescope was Wolf’s. Did Wolfer inherit Wolf’s ‘scope along with his mantle?
Wolfer was Wolf’s assistant and took over the telescope in 1876. Today it is operated by Thomas Friedli [the other person in the photos]. http://www.rwg.ch/joomla/
I understand the causes of these, but I’m curious as to whether Wolf and his peers had any systematic way of allowing for the effects on observation.
Wolf was fully aware of all this. Actually seeing is less important in a small telescope.
I feel strangely compelled here to make a general safety comment about observing the sun. Do not observe the sun with any optical instrument, even low power binoculars, unless the proper protection has been applied – permanent, painful blindness may result.
Galileo went blind from looking at sunspots [at sunset where the intensity is down, but still…]
davidmhoffer says:
January 4, 2013 at 9:08 pm
Uhm, hold on, I be a bit confused. Am I to understand that the entire system is predicated on an artificial math construct that started out as a judgment call?
Yes, but also backed up by extensive observations, and time has proven that Wolf made the right choices. Lucky, perhaps. But it is always better to be lucky than merely to be right.
“Ian H says:
January 4, 2013 at 5:24 pm
Leif is a true scientist. He doesn’t make extravagant claims about things he doesn’t know. He makes conservative statements about things he is sure about. He openly states the limits of his knowledge, and if challenged can explain absolutely everything he does in as much detail as his audience can comprehend. He never appeals to authority or talks down to people. He doesn’t need to do that. He just knows more about sunspots than just about anyone else in the world. That what a scientist should be like and indeed what most scientists are like. ”
Try talking to Leif about the Electric Universe…….
davidmhoffer says:
January 4, 2013 at 9:08 pm
Uhm, hold on, I be a bit confused. Am I to understand that the entire system is predicated on an artificial math construct that started out as a judgment call?
Yes, but also backed up by extensive observations, and time has proven that Wolf made the right choices. Lucky, perhaps. But it is always better to be lucky than merely to be right.
>>>>>>>>>>>>>>>>>>>>
Uhm….what makes it right? You’re constantly explaining that various proxies don’t match the sunspot record. But if there was never a physical basis for defining the system in the first place, why would you expect them to match?
Steve B says:
January 4, 2013 at 9:44 pm
Try talking to Leif about the Electric Universe…….
That gets short shrift like all pseudo-science deserves. Sadly, some pseudo-science makes its way into WUWT, promoted or invented by misled or scientific illiterate people. Try this link for more on the E-U:
http://dealingwithcreationisminastronomy.blogspot.com/p/challenges-for-electric-universe.html
Thomas Friedli gave an illuminating presentation at the 2nd SSN workshop in Brussels in May, 2012: http://www.leif.org/research/SSN/Friedli.pdf well worth a read.
“A somewhat disturbing [to many people] consequence of the correction of the official sunspot number is that there is now no evidence for a Modern Grand Maximum [‘the largest in 8000 years’ or some such].”
============
Projection, upon the audience.
Nice.
I am surprised Greenwich had weather clear enough for someone to see the sun and take a picture ‘every day’. Few times a month perhaps in winter.
What does it mean, to you, that there was no Grand Maximum? What does this tell us, in the context of Climate on earth? AGW? TSI? Thx Leif… Does this mean you are conceding the electric universe idea then ….hahahahah!!!!
ps. When is your friend going to publish his findings on decay anomaly/Sun rotation theory?
Clearly, if there is no great trend in sunspot numbers over the past 300 years, then the correlations between global temperature and solar activity are not directly linked to sunspot number. It’s just a coincidence that they were low during the Maunder and Dalton minima. Equally, if the second half of the 20th century did NOT have 5 cycles of unusually high sunspot numbers, then you can’t correlate the warming of the past 30 years with them.
Rather than shilly shally about this, perhaps the debate could move on to the parameters which DO affect things, in particular which parameters caused the times of the Maunder and Dalton minima to be cooler and which parameters caused the abrupt warming in the last 19th- and 20th centuries (the former clearly wasn’t to do with carbon dioxide, was it?!)
Is it the solar wind modulations affecting entry of cosmic rays into the earth’s atmosphere? Is it the non-random mixing of oceans leading to altered sea surface temperatures?
It has been claimed that large planet-solar interactions can provide a possible explanation for centennial- and Gleissberg cycles. Has the physics of that been worked out yet or has it been comprehensively debunked as a theory??
Getting the sunspot number right is a matter of physics and exactitude.
But if sunspot numbers do NOT modulate climate in any meaningful way, then surely continued discussion of this part of solar physics is secondary to more pertinant discussions at this site??
Previous post:
please replace last with late in para 2….
After the correction of the historical SSN-Record with the factors from Leif http://www.leif.org/research/IAUS286-Mendoza-Svalgaard.pdf ( b4 1945 1.2; b4 1870 1,4) one can make a diagram with the accumulated sunspot anomaly since the start of every sunspot cycle and so you’ll get a nice comparison of every cycle in one view. The anomaly of one month is the difference between the actual SSN- value and the average of the monthly values cycle 1…23 after cyclestart: http://www.dh7fb.de/ssnano/image003.gif . We see: the cycle 24 is the weakest since SC7 , the last one of the Dalton-Minimum so far. I’ll update this figure every month.
lsvalgaard says:
The RGO data is a 100 years and Wolf’s series is 160 years plus the data back to 1610, 400 years.
By how many different combinations of instrumentations and index methodologies? And what were they?
Wolf invented his relative sunspot number around 1850, but dug up observations back to 1610 and constructed sunspot numbers back to about 1700.
Clearly, Wolf himself was not comfortable applying his invented index methodology to the information from prior to “about 1700”, so claiming 400 years is not legitimate.
WRT Wolf’s methodology and its derivatives, what is the criterion for the demarcation of a group?
But at some point in the 1940s, the Zurich observers began to ‘weight’ sunspots according to size and complexity, such that large spots would not be counted just once [as Wolf and Wolfer did], but up to five times, i.e. given a weight of five. There is nothing wrong with that, if one then also adjusts the k-factor to reflect this new way of counting.
I disagree. Not with the notion that it is OK to adopt a different index methodology – they are all equally arbitrary in the absence of an external objective for the proxy. Rather with the notion that a single k-factor is necessarily sufficent to translate from one such index to another. It is not.
You can’t back out multiple factors (different resolutions of raw count, discounting of some spots below X size, differential weighting of some other spots above X size or Y complexity, differential counting of spots that occur within a “group” as opposed to not) using a single multiplier. Unless you assume that the proportion of all sunspots in each of the various size, complexity, and proximity categories remains constant over time. An assumption like that explicitly denies the utility of those very factors – you’re back to just counting spots.
At any rate, rejiggering the data to conform to a particular invented index methodology (even if done with the mathematical rigor not contained in a single k-factor) cannot say anything whatsoever about the existance of a “Grand Solar Maximum”. At best, it just says that particular index methodology does not capture it, if it does exist.
All such indexes are invented and arbitrary. Choose another index methodology, and you can find that GSM, whether it exists or not. No problem doing that. The problem only arises when whatever index is chosen is taken to have some external meaning. At which point it becomes a model of a specifc physical process. No problem with that, so long as it is acknowledged as such, and treated appropriately. The rest is just counting dots on the head of a pin.
Out of curiousity, when you guys do sunspot area, what method do you use to account for spherical geometry?
Sorry, who cares about the “sunspot number”?
The number is anyway a poor proxy of the sun activity. Not only the “number” of spots counts, but also the area of each spot, and this can change the results drastically!
We have to measure the cosmic ray intensity that is a much directer proxy.
Okay. I’m lost. So which method of counting sunspots REALLY controls our climate?
In re screen cleaning; I thought IPA was dilute aqueous ethanol solution ~6% ABV – India Pale Ale.
Line-outs are the Rickover Navy way. Another valuable micro-managing tool are O and X; O in the procedure margin when the ‘O’rder is given, X’ed on completion, all logged.
Re Pseudo-science, it’s always worth having at the back of your mind things like this:
In his 1950 BBC radio series, The Nature of the Universe, Hoyle mockingly called this idea the ‘big bang,’ considering it preposterous.
“this idea” being Georges LeMaitre’s expanding universe. That’s not to say that a lot of stuff isn’t pseud-science. Shakespeare got it right with:-
“And therefore as a stranger give it welcome.
There are more things in heaven and earth, Horatio,
Than are dreamt of in your philosophy.”
Only history will show what was pseudo-science and what was true-science, perhaps that history won’t be written for a very,very long time. As it happens I’ve no wish to be contentious here.
An interesting and informative post – thank you, Leif, and a Happy New Year to you.
Whilst I wholly approve in principle of counting all spots above zero size, I wonder whether this won’t introduce its own problems as the Livingston and Penn effect progressively ‘fades’ the smallest spots into the background. What do you do then? Use other information (magnetic?) to identify the smallest and most ‘uncontrasty’ spots? Require a certain contrast ratio between putative spots and their surroundings? (Pray that the L&P effect is cyclical and moves back upwards before too long …?) Whatever you decide, one thing is certain – somebody will decide it’s “the wrong method”!
Amazing how many matters of detail there can be, even in something as superficially straightforward as counting sunspots.
lsvalgaard says:
January 4, 2013 at 5:22 pm
“Indeed some cycles are higher than others. The point is that there are high cycles in every century and no long-term trend the past 300 years.”
If that’s your point, as you say, where in your post did you discuss or demonstrate the lack of a trend for the last 300 years?
davidmhoffer says: January 4, 2013 at 6:32 pm. I figured I’d put a red dot with a felt marker on the screen over every sun spot so I don’t count any twice. I checked twice, I was SURE is was dry erase….
Version 1. Let me through the crowd, I’m a chemist. Be very wary using anything on your list above isopropyl alcohol (rubbing alcohol). Use a cloth made for the purpose, computer stores sell them. It it does not work, get a new monitor or go to 2.
Version 2. Let me through the crowd, I’m a skeptic. Get into the file storage section of your monitor program and create artificial values for each red spot, with an interpolation program to infill from surrounding pixels from each succesive image. The basics are in good quality digital cameras to overcome mosaicking and aliasing and pixel drop-outs.
This is the way that proper adjustment proceeds.
(Poorly)
The second SC24 peak may be on the way
http://sdo.gsfc.nasa.gov/assets/img/latest/latest_1024_4500.jpg
‘SIDC count’ for 5th Jan is SSN ~81
It seems to me the grandness in any modern maximum would lie in the not-so-grandness of all those grand minima, if centennially recurrent.
Even with the adjustments, the Maunder and Dalton minima still look like minima, 1959 looks like one heck of a peak, and the current lull still looks like a lull.
Actually, (if you can bypass the stuff about the influence of Neptune,) it seems the “Layman’s Count” has been making this adjustment for some time.
E.M.Smith says:
January 4, 2013 at 6:38 pm
I have to second the notion that if they have photos, a ‘recalibration’ from the original material ought to be possible / done. ( IF they trashed the negatives then “Oh Well”…)
When I learned lab work, we had a notebook in which ALL data and work were recorded. It was forbidden (got you an automatic “F” Fail grade) to have ANY erasure….
>>>>>>>>>>>>>>>>>>>>>>>>
That is what I learned too. Only in my case the FDA would come calling if you used a different method. Our notebooks all had to be signed and dated at the end of the day by us and witnessed by a second person too then placed in the archives when filled.
I sure hope they are keeping track of all the information. using ‘weighing factors’ makes me a bit nervous. Better to dump them into two pots and have a count for apples and another for bananas so you do not lose data that may have meaning down the road.
From what I can see, by trying to get ‘fancy’ with counting methods the data is now mucked up.
davidmhoffer says:
January 4, 2013 at 9:50 pm
Uhm….what makes it right? […] But if there was never a physical basis for defining the system in the first place, why would you expect them to match?
Because the sunspot number empirically turns out to be a good proxy for ‘solar activity’. And there is a physical basis: each spot carries a magnetic field, 100 spots carries 100 times as much field as the average spot, so the sunspot number is a good approximation to the total magnetic field. That said, there is an indication [the Livingston and Penn effect] that this physical relation may not always work. From the UV flux from the Sun, it seems that the L&P effect did not operate 1722-1995. What is happening since may be a repeat of what happened before [the Maunder Minimum].
u.k.(us) says:
January 4, 2013 at 10:10 pm
Projection, upon the audience. Nice.
Indeed, and correctly so.
johnnythelowery says:
January 4, 2013 at 10:17 pm
I am surprised Greenwich had weather clear enough for someone to see the sun and take a picture ‘every day’.
Supplemented by photographs taken at Kodaikanal in India and other places. That is why ‘every’ was in quotes.
What does it mean, to you, that there was no Grand Maximum? What does this tell us, in the context of Climate on earth? AGW? TSI?
It tells me that if people use the sunspot number [which they do] as a basis for reconstructing TSI and correlating with climate, that they will get things wrong [which they do].
Thx Leif… Does this mean you are conceding the electric universe idea then ….hahahahah!!!!
No, the E-U is nonsense.
When is your friend going to publish his findings on decay anomaly/Sun rotation theory?
If you mean Peter Sturrock, then I think he has published something on that.
Rhys Jaggar says:
January 4, 2013 at 10:36 pm
Is it the solar wind modulations affecting entry of cosmic rays into the earth’s atmosphere? Is it the non-random mixing of oceans leading to altered sea surface temperatures?
There is no good evidence that cosmic rays have anything to do with climate or weather.
It has been claimed that large planet-solar interactions can provide a possible explanation for centennial- and Gleissberg cycles. Has the physics of that been worked out yet or has it been comprehensively debunked as a theory??
There has been some attempts, but none are convincing as the forces involved are much too small. Since there are [many] other stars with large planets, one test of the hypothesis would be to see if those stars show magnetic activity synchronized with the revolution of their planets. None have been found.
JJ says:
January 5, 2013 at 12:11 am
By how many different combinations of instrumentations and index methodologies? And what were they?
There are more than 500 observers with all kinds of instruments and methods producing more than a million observations in total. So don’t expect a short comment to do justice to their effort.
Clearly, Wolf himself was not comfortable applying his invented index methodology to the information from prior to “about 1700″, so claiming 400 years is not legitimate.
Hoyt and Schatten and Eddy found more data from before 1700, so we do have observations back to 1610. ‘Legitimate’? We work with what we have.
WRT Wolf’s methodology and its derivatives, what is the criterion for the demarcation of a group?
Basically the proximity of the spots to each other, but also their evolution which clearly shows that the spots in a group are related. But, it is a legit problem because people could [and do] disagree about the details. The k-factor to a large extent compensates for that.
Rather with the notion that a single k-factor is necessarily sufficient to translate from one such index to another. It is not.
Experience shows that it is. If you plot one observer’s count vs. another one’s, you get a straight line going through the origin. The constant slope is the k-factor. This works.
You can’t back out multiple factors
See above.
At any rate, rejiggering the data to conform to a particular invented index methodology (even if done with the mathematical rigor not contained in a single k-factor) cannot say anything whatsoever about the existence of a “Grand Solar Maximum”.
Yet, the same data was used to define the Grand Maximum.
All such indexes are invented and arbitrary.
They are useful as they relate to the actual physics.
Out of curiosity, when you guys do sunspot area, what method do you use to account for spherical geometry?
There are two ways to deal with that: 1) correct for projection and report the actual area of the hemisphere, and 2) report the area of the observed [and foreshortened] area as a fraction of the visible solar disk. Both have a use. The 1st is related to what the Sun does, the 2nd to what the effect might be on the Earth. For a monthly or yearly average the difference does not matter as the areas by the two different methods are simply linearly related [experience shows].
alex says:
January 5, 2013 at 12:20 am
Sorry, who cares about the “sunspot number”? …
We have to measure the cosmic ray intensity that is a much directer proxy.
Apart from the fact that we do not have such reliable measurements before the 1950s.
Richard111 says:
January 5, 2013 at 12:51 am
Okay. I’m lost. So which method of counting sunspots REALLY controls our climate?
The sunspot cycle controls only a very small part of our climate, so the precise method is not so important.
SandyInLimousin says:
January 5, 2013 at 1:27 am
Only history will show what was pseudo-science and what was true-science
Well, most pseudo-science is nonsense on its face. And the examples you mentioned were never pseudo-science to begin with.
Steve C says:
January 5, 2013 at 1:45 am
I wonder whether this won’t introduce its own problems as the Livingston and Penn effect
The L&P effect is a whole new aspect and if real [which I think it is] will lead to better understanding of solar activity. E.g. of the process that compacts the magnetic field to make a visible spot.
Chris Schoneveld says:
January 5, 2013 at 2:12 am
If that’s your point, as you say, where in your post did you discuss or demonstrate the lack of a trend for the last 300 years?
Good point. I’ll add a graph of the data over that period.
Soren F says:
January 5, 2013 at 4:21 am
It seems to me the grandness in any modern maximum would lie in the not-so-grandness of all those grand minima, if centennially recurrent.
There is a certain semantic distinction here. Maxima recur, but only the ones that ‘tower’ over the other ones should be called ‘Grand’.
Caleb says:
January 5, 2013 at 5:03 am
Actually, (if you can bypass the stuff about the influence of Neptune,) it seems the “Layman’s Count” has been making this adjustment for some time.
The ‘Layman’s Count’ does not have a meaningful calibration and IMHO is simply junk [with the purpose of producing a count that supports the author’s ideas].
John West says:
January 4, 2013 at 7:31 pm
@ E. M. Smith
Yes, we still cross out, initial, and annotate except now it’s likely to be electronic, but not always (there’s still some archaic regulations that require actual notebooks).
>>>>>>>>>>>>>>>>>>>>>>>>>>>
Actual notebooks are required for a darn good reason.
1. You can not ‘fudge’ the data later especvially if they are signed data and wittnessed. The written notebook will also stand up in court in fights over patents or lawsuits.
2. Notebooks are PERMANENT especially if they are archival paper. Think of how many kids born around this time who will have NO Photographs of their childhood. My neighbors lost all their pictures when their computer burped and there went all the babyhood pictures.
3. Oak Ridge laboratory had their computer hacked in 2011. The Oak Ridge National Laboratory was forced to disconnect internet access for workers on Friday after the federal facility was hacked, and administrators discovered data being siphoned from a server. and China-Based Hacking of 760 Companies Shows Cyber Cold War
China and Russia want the technology and they want the patents but they do not want to pay royalties. U.S. intelligence report blamed Russia and China for hacking into private computer networks, likely seeking patent and technology information.
What rather amazes me is the detail and sophistication of the early observers using only primitive equipment.
So no recent Grand Maximum but instead a series of multi cycle maxima since the Maunder with a few dips along the way each of which seems to coincide with a cooling scenario give or take 60 years due to interference from the Pacific Multidecadal Oscillation.
And now a dip to Dalton and maybe Maunder levels.
And increasing numbers of observations and papers suggesting that something about solar variations does affect global air circulation patterns.
Add all that to paleo data based on various isotopes and the climate link still seems to be intact despite Leif’s work.
Maybe this is the place to ask this question. Today there are 12 sunspot groups, but the report notes that after a long time, there has finally been a 1.7 M class solar flare. Is it unusual to have so many sunspot groups, and so little in the way of solar flares?
E.M.Smith says: @ January 4, 2013 at 6:38 pm
I have to second the notion that if they have photos, a ‘recalibration’ from the original material ought to be possible / done. ( IF they trashed the negatives then “Oh Well”…)
This is being done, but only gets us back to 1874. And the RGO photographs don’t have a constant ‘calibration’ themselves so don’t really help much. But were good enough to show the discontinuity in 1946.
…………………………………………….
lsvalgaard replies: @ January 4, 2013 at 7:44 pm
It is sad to say, but it seems that Waldmeier destroyed or ‘disappeared’ all the archives from observatory. I have been there to check and the material is gone.
……………………………………………
Waldmeier was director until 1979 and was a professor until 1982. He had a stroke in 1985 and died in September of 2000.
Why is the issue of the missing observatory archives coming up now instead of in 1980? There was a five year window in which pointy little questions should have been asked. We are not in the medieval period dealing with secretive Alchemists are we?
The information on the internet on Waldmeier indicates he did have something of the character of a secretive Alchemist. The man may have been brilliant but he was a poor scientist and a worse director.
Chris Schoneveld says:
January 5, 2013 at 2:12 am
If that’s your point, as you say, where in your post did you discuss or demonstrate the lack of a trend for the last 300 years?
Good point. I have added a graph of the data over that period. The left panel of Figure 4 shows how the MGM has been portrayed by various people. The right panel shows the corrected Wolf sunspot number. As I have explained, there are maxima and minima, but none that towers over the rest like in the left panel.
Gail Combs says: January 5, 2013 at 5:52 am
…..computer burped and there went all the babyhood pictures.
I use a portable (pocket size) USB 500GB hard drive, where I back up all of my work and all the snaps from 4 digital cameras in use by rest of my family. Now I have to get another one. Selection of the more important photos are occasionally burned onto CDs.
Rhys Jagger says:
It has been claimed that large planet-solar interactions can provide a possible explanation for centennial- and Gleissberg cycles. Has the physics of that been worked out yet or has it been comprehensively debunked as a theory??
Dr. S replies:
There has been some attempts, but none are convincing as the forces involved are much too small. Since there are [many] other stars with large planets, one test of the hypothesis would be to see if those stars show magnetic activity synchronized with the revolution of their planets. None have been found.
http://libra.msra.cn/Publication/27702964/hot-jupiters-and-stellar-magnetic-activity
??
Jim Cripwell says:
January 5, 2013 at 6:28 am
Is it unusual to have so many sunspot groups, and so little in the way of solar flares?
The groups are simple, many of them with only one spot. Flares occur in complex groups with many interacting spots. The lack of complex groups without many small spots in them may be a symptom of the Livingston & Penn effect, that has to do with losing the small spots.
rstritmatter says:
January 5, 2013 at 6:54 am
“if those stars show magnetic activity synchronized with the revolution of their planets. None have been found”
http://libra.msra.cn/Publication/27702964/hot-jupiters-and-stellar-magnetic-activity
??
A distinction has to be made between planets so close to their star that they are within the ‘magnetosphere’ of the star as is the case with the stars in that paper and planets in the stellar wind further out [as the Sun’s planets]. In the case of planets within the magnetosphere, the planets cause ‘aurorae’ on the star. An analog is Jupiter’s moon Io that does the same. This is very distinct from the claim that the planets [by way of tides and the like] modulate the stellar cycles that originate deep within the stars [as sunspots do]. I should perhaps have been more specific about that. See slide 19 of http://www.leif.org/research/AGU%20Fall%202011%20SH34B-08.pdf
Gail Combs says:
January 5, 2013 at 6:37 am
Why is the issue of the missing observatory archives coming up now instead of in 1980? There was a five year window in which pointy little questions should have been asked. We are not in the medieval period dealing with secretive Alchemists are we?
I have asked the same question, and the answer was that ‘all material has been transferred to SIDC’. However, when you go look, there is nothing. I have not given up yet, but so far the search has come up blank. All data after 1937 [when Waldmeier became assistant observer] is missing.
The information on the internet on Waldmeier indicates he did have something of the character of a secretive Alchemist. The man may have been brilliant but he was a poor scientist and a worse director.
In many respects Waldmeier was a very good scientist, but as all humans had flaws. One was his secretiveness.
davidmhoffer says:
January 4, 2013 at 9:08 pm
….Uhm, hold on, I be a bit confused. Am I to understand that the entire system is predicated on an artificial math construct that started out as a judgment call?
>>>>>>>>>>>>>>>>>>>>>>>>
You might want to read Dr. David H. Hathaway’s paper The Solar Cycle
rstritmatter says:
January 5, 2013 at 6:54 am
“if those stars show magnetic activity synchronized with the revolution of their planets. None have been found” ??
Once the planet is outside the ‘magnetosphere’ there is no effect:
http://onlinelibrary.wiley.com/doi/10.1111/j.1365-2966.2010.16715.x/abstract
“HD 189733 is a K2 dwarf, orbited by a giant planet at 8.8 stellar radii. In order to study magnetospheric interactions between the star and the planet, we explore the large-scale magnetic field and activity of the host star…. The study of the stellar activity shows that it is modulated mainly by the stellar rotation (rather than by the orbital period or the beat period between the stellar rotation and the orbital periods). We report no clear evidence of magnetospheric interactions between the star and the planet.
lsvalgaard says:
January 4, 2013 at 9:38 pm
Yes, but also backed up by extensive observations, and time has proven that Wolf made the right choices. Lucky, perhaps. But it is always better to be lucky than merely to be right.
>>>>>>>>>>>>>>>>>>>>>>>
perhaps not just luck…
@lsvalgaard: Thanks for the additional graph, which makes your final point much clearer. Question, though: what is displayed in the left-hand graph? If sunspot numbers, why are yours so dramatically different in the first cycle or two? (Or is the bottom of the unlabeled Y-axis in the left-hand graph not zero?)
@ Dr. Leif Svalgaard
First, thank you for spending time with us.
Per your suggestion I dropped the sunspot numbers from SIDC into excel, X1.2 pre-1947, and plotted an running 11 yr average.
IF (your input requested) the sunspot numbers from say 1650 to 1700 that I’ve seen are close to “right” being next to if not nil, nada, zilch …..
Then a fourth order polynomial fit to the plot above shows a pattern quite in line with Alec Rawls hypothesis, in other words, a “Grand Maxima” is not required considering the 1600’s Grand Minima (if true).
In the added figure 4 can someone explain to me what is plotted in the graph on the left. Is it sunspot number (SSN) or some other measure of solar activity? It looks as though it is some other proxy for solar activity (?) but if it is SSN then why are the minima (which all are very close to zero in the plot on the right) not plotting close to zero on that on the left. They should since the correction k factors that Leif has outlined are linear multipliers.
Leif, Do you have a xls file of your latest reconstruction available?
I notice it is quite different from the TSI-SSN-Guess file from 6 months ago (WUWT posting), especially in the 1700-1800 region. Have there been other adjustments between then and now as well?
But, even if the MGM artefact is convincingly eliminated, one cannot deny the fact that from the Maunder minimum to 2012, there is a rising trend, with ups and downs the magnitude of which has been quite similar for about 300 years.
Conversely, after the LIA, there has been no major cataclysmic climate event and the record is only punctuated with minor climatic variations.
>…what are the implications of that statement?
> (The consequences of not having had a Modern Grand Maximum.)
The lack of solar grand maxima is not devastating to the functioning of the Universe. But it does devestate certain pet theories of climate scientists/buffs, which claim to prove/disprove AGW or similar stuff.
😐
John…thanks muchly……never thought of that….but as they say….do not attribute to stupidity what is done with malice(to paraphrase)
Nice article, though the k-factor reminds me of a technique I believe that many state sponsored climate scientists use:
y = ff*f(x) + RA(x)
where ff is the finagle factor and always equal to zero, RA is the Right Answer.
From my point of view the changes Lief has made improves the idea that the Sun is responsible for our warming. With a slightly above average, consistent solar contribution we should have seen a slow unremarkable warm-up from the depths of the LIA. That is exactly what we have seen with variation due to ocean oscillations. It also fits even better if you assume some of the recent temperature adjustments under state the historic temps.
Leif,
Richard111 says:
January 5, 2013 at 12:51 am
Okay. I’m lost. So which method of counting sunspots REALLY controls our climate?
“The sunspot cycle controls only a very small part of our climate, so the precise method is not so important.”
Very interesting post, however, there continue to be too many “unknowns, don’t know why’s, still working on’s, don’t all agree upon’s”, even according to your own comments above, to make such a conclusive statement regarding the effect of sunspots upon climate. Perhaps a “lead us to believe” type comment would be less dogmatic and more appropriate.
Regards,
Jim
Gail Combs says:
January 5, 2013 at 7:47 am
perhaps not just luck…
Also diligent work.
Wayne2 says:
January 5, 2013 at 8:04 am
Question, though: what is displayed in the left-hand graph? If sunspot numbers, why are yours so dramatically different in the first cycle or two? (Or is the bottom of the unlabeled Y-axis in the left-hand graph not zero?)
I intentionally left the graph unlabeled to provoke questions like yours. The left panel shows the so-called ‘open magnetic flux’ calculated from the sunspot number [and that from the Group Sunspot Number]. The calculation assumes that the magnetic field ‘rides’ on a background which is the cycle average of the sunspot number. More here: http://www.leif.org/research/The%20long-term%20variation%20of%20solar%20activity.pdf
John West says:
January 5, 2013 at 8:09 am
IF (your input requested) the sunspot numbers from say 1650 to 1700 that I’ve seen are close to “right” being next to if not nil, nada, zilch
We don’t really know what solar activity was before 1700. The lack of sunspots does not mean that activity disappeared. For example, the cosmic ray modulation during the MM was as strong, if not stronger, than today. If I and colleagues are right we may be headed into such a situation in the coming years where the magnetic field is present, but spots do not form. Perhaps TSI will be even higher without the dark spots to drag it down…
Paul Dennis says:
January 5, 2013 at 8:16 am
In the added figure 4 can someone explain to me what is plotted in the graph on the left.
See reply to Wayne2.
ed says:
January 5, 2013 at 8:24 am
Leif, Do you have a xls file of your latest reconstruction available?
Multiply all values before 1947 by 1.2
I notice it is quite different from the TSI-SSN-Guess file from 6 months ago (WUWT posting), especially in the 1700-1800 region.
The 1700-1800 values included the Group Sunspot Numbers. As part of the SSN workshop effort, we have learned more about what is wrong with the group sunspot number [I’ll make a separate post on that at some time] so I have reverted to stick with the official SIDC Wolf series [suitably corrected] for the time being.
TomRude says:
January 5, 2013 at 8:50 am
But, even if the MGM artefact is convincingly eliminated, one cannot deny the fact that from the Maunder minimum to 2012, there is a rising trend, with ups and downs the magnitude of which has been quite similar for about 300 years
Including the MM will invariably create a trend. Here are my thoughts about the MM http://www.leif.org/research/Another-Maunder-Minimum.pdf
[or the powerpoint presentation if you can open it: http://www.leif.org/research/Another-Maunder-Minimum.ppt ].
This is at this point pure speculation, but that is part of science too [if clearly labelled as such].
Soren F says:
January 5, 2013 at 4:21 am
It seems to me the grandness in any modern maximum would lie in the not-so-grandness of all those grand minima, if centennially recurrent.
There is a certain semantic distinction here. Maxima recur, but only the ones that ‘tower’ over the other ones should be called ‘Grand’.
Sorry if semantic, what I mean is just: if not in maxima, long-term variability would still plausibly seem to reside in the magnitude and frequency of grand minima.
Jim G says:
January 5, 2013 at 10:15 am
“The sunspot cycle controls only a very small part of our climate, so the precise method is not so important.”
Perhaps a “lead us to believe” type comment would be less dogmatic and more appropriate.
It should be obvious that everything I say is just my humble opinion. I have explained many times why I think so. But if you want some other thoughts on that here are some:
The minimal solar activity in 2008-2009 and its implications for long-term climate modeling
Schrijver, C. J.; Livingston, W. C.; Woods, T. N.; Mewaldt, R. A.
Geophysical Research Letters, Volume 38, Issue 6, CiteID L06701, 2011
“Variations in the total solar irradiance (TSI) associated with solar activity have been argued to influence the Earth’s climate system, in particular when solar activity deviates from the average for a substantial period. One such example is the 17th Century Maunder Minimum during which sunspot numbers were extremely low, as Earth experienced the Little Ice Age. Estimation of the TSI during that period has relied on extrapolations of correlations with sunspot numbers or even more indirectly with modulations of galactic cosmic rays. We argue that there is a minimum state of solar magnetic activity associated with a population of relatively small magnetic bipoles which persists even when sunspots are absent, and that consequently estimates of TSI for the Little Ice Age that are based on scalings with sunspot numbers are generally too low. The minimal solar activity, which measurements show to be frequently observable between active-region decay products regardless of the phase of the sunspot cycle, was approached globally after an unusually long lull in sunspot activity in 2008-2009. Therefore, the best estimate of magnetic activity, and presumably TSI, for the least-active Maunder Minimum phases appears to be provided by direct measurement in 2008-2009. The implied marginally significant decrease in TSI during the least active phases of the Maunder Minimum by 140 to 360 ppm relative to 1996 suggests that drivers other than TSI dominate Earth’s long-term climate change”
A New Look at Solar Irradiance Variation
Foukal, Peter
Solar Physics, Volume 279, Issue 2, pp.365-381, 2012
“We compare total solar irradiance (TSI) and ultraviolet ( F uv) irradiance variation reconstructed using Ca K facular areas since 1915, with previous values based on less direct proxies. Our annual means for 1925 – 1945 reach values 30 – 50 % higher than those presently used in IPCC climate studies. A high facula/sunspot area ratio in spot cycles 16 and 17 seems to be responsible. New evidence from solar photometry increases the likelihood of greater seventeenth century solar dimming than expected from the disappearance of magnetic active regions alone. But the large additional brightening in the early twentieth century claimed from some recent models requires complete disappearance of the magnetic network. The network is clearly visible in Ca K spectroheliograms obtained since the 1890s, so these models cannot be correct. Changes in photospheric effective temperature invoked in other models would be powerfully damped by the thermal inertia of the convection zone. Thus, there is presently no support for twentieth century irradiance variation besides that arising from active regions. The mid-twentieth century irradiance peak arising from these active regions extends 20 years beyond the early 1940s peak in global temperature. This failure of correlation, together with the low amplitude of TSI variation and the relatively weak effect of FUV driving on tropospheric temperature, limits the role of solar irradiance variation in twentieth century global warming.”
Soren F says:
January 5, 2013 at 10:48 am
Sorry if semantic, what I mean is just: if not in maxima, long-term variability would still plausibly seem to reside in the magnitude and frequency of grand minima.
Naturally. One problem is that we don’t know much about the Grand Minima, there not having been one for 300 years. The Maunder Minimum had few sunspots, but a strong cosmic ray modulation. What does that mean? We don’t know. If we get another Maunder type minimum in the coming years we’ll probably figure out how the interpret the data. Personally I do not consider the low sunspot numbers around 1800 and 1900 [or even now] to rank those periods as ‘Grand Minima’.
Leif,
In this TSI reconstruction of yours from 2007, can you explain why the TSI value was so low in 2007? I am concerned that adjustments are being made to the data which are unexplained (the reason for my previous question on why the difference during the 1700-1800 period). To me it seems there is some calibration error for the TSI from Sunspot calc you are using (from PMOD/ACRIM?).
http://s852.beta.photobucket.com/user/etregembo/media/LeifTSI2008LeifSomeRemoved.png.html?sort=3&o=13
Also, for TSI what is the formula you are using to calculate TSI from SSN (you say SSN is a proxy for solar activity), or is it from other data (GSN) or such?
You repeatedly state that there was high cosmic ray modulation present during the MM, which you imply means that solar activity was still active (I would assume so too, but at reduced levels), but are you really implying that the level of activity (and it’s associated TSI) were not lower than when sunspot count equals zero?
Seems to me that even though the sunspots disappear (L&P) that the level of activity can and likely did decrease during that period, though the SSN count can’t go below zero, so the SSN count isn’t always a good TSI proxy.
Also, is TSI roughly linear to sunspot count? Any formula would be appreciated.
“Including the MM will invariably create a trend.”
Indeed and that also applies to the CAGW science doesn’t it?
As for the MM, your presentation and subsequent comments are very interesting and indeed the speculative part is well highlighted. It is refreshing to see someone ready to say “we don’t know”.
Looking forward to more discoveries…
“I did this exercise, and found that my layman’s count was much lower than the “official” count, lending credence to Leif’s premise.”
On climate topics in general, when something (X) is used to imply something else (Y), the validity of X or not is often less important than the subtle chain of an implicit therefore between then. For instance, on a different topic, many people often essentially argue that CO2 has a non-zero effect on radiation, therefore (so-and-so specific prediction of Z degrees future temperature rise and effects) is valid, even though a critical aspect to examine is the subtle implicit therefore, including its quantitative specifics, because the former being so does not suffice for proving the latter.
This article states:
“The next-best thing is to adjust the old numbers before 1947 by multiplying them by 1.20. This is what we have decided to do [at least for now].”
Then it states and depicts:
“Figure 4. (Left) The idea of the Modern Grand Maximum, MGM. (Right) The corrected Wolf Sunspot Number does not support a MGM”
There is a subtle implicit therefore, implying that the argument for multiplying “the old numbers before 1947” by 1.20 is a proof for turning the plot in the left of figure 4 into the plot on its right.
Actually the version on the right changes the magnitude over much of the time period by vastly, vastly more than 20% compared to the version on the left. That may be highlighted by adding blue lines as in the following:
http://s13.postimage.org/ceocl0vsn/adjusted.gif
Svalgaard will reply saying the difference of more than 20% is from other matters, but ask yourself why the article was written in the way it was.
I don’t particularly like sunspot counts anyway, as opposed to other metrics. (For instance, one minimum dropping down to zero sunspots can differ from another with also zero sunspots at some time, such as how solar magnetic activity was not identical in the last minimum to the recent ones before it). But I couldn’t resist noting the above.
Personally I would have found a recount of the sun spots after 1947 with the old method the right way to proceed, instead of tampering with 250 years worth of data prior to 1947.
The new sunspots graph is a mixture of 2 different measurement types, the pre-1947 with old method multiplied with a constant, the post-1947 a weighted counting which may be closer to reality or not.
Using the same method would have ensured data is not adjusted but obtained with consistent measurement, even if the new method is an improved method.
If it is an improved method, the simple adjustment of the old data through multiplication by 1.2 does not give the same result, else where is the improvement? We are not comparing like with like.
Thank you for the informative post Dr Isvalgaard, I appreciate the explanation of observation matching problems as technology changed and your clear statement of the methods used to attempt to make these observations useful over time.
I understand you to be saying
,A; we have not observed enough variation in sunspot numbers over the period of observation, to make any meaningful correlation/causation claims with weather variations on earth.
And B; that many people are theorizing in advance of the available data when assuming a measurable increase in solar activity during part of the last century?
ed says:
January 5, 2013 at 11:34 am
To me it seems there is some calibration error for the TSI from Sunspot calc you are using (from PMOD/ACRIM?)
I plotted several reconstructions by others, and they did differ quite a lot [due to calibration problems]. I do not make a claim of detailed agreement with everybody. I’m interested in the long-term behavior.
You repeatedly state that there was high cosmic ray modulation present during the MM, which you imply means that solar activity was still active (I would assume so too, but at reduced levels), but are you really implying that the level of activity (and it’s associated TSI) were not lower than when sunspot count equals zero?
We don’t really know. The cosmic ray modulation was higher during the MM than now. From modern data we know that the CME rate does not fall to zero when the sunspot number does. And some people have speculated that when there are no dark spots to cause dips in TSI, that TSI would be higher during a Grand Minimum.
Seems to me that even though the sunspots disappear (L&P) that the level of activity can and likely did decrease during that period, though the SSN count can’t go below zero, so the SSN count isn’t always a good TSI proxy.
My take on this is that durieng normal times [e.g. 1700-1995] the SSN is a good proxy for TSI, cosmic rays, UV, the works…
But I think a Grand Minimum is qualitatively different, and the SSN is meaningless during such periods or at least a very poor proxy for anything.
Also, is TSI roughly linear to sunspot count? Any formula would be appreciated.
I think that during ‘normal times’ there is a rough linear relation: TSI = 1360.8 + 0.007 SSN
Note that this includes a 4.8 W/m2 re-calibration due to the change from PMOD to SORCE.
When the SSN no longer represents the magnetic flux the formula will not be valid. Note, that I’m predicting that this will happen, so lots of opportunity prove me wrong.
Lars P. says:
January 5, 2013 at 11:56 am
Personally I would have found a recount of the sun spots after 1947 with the old method the right way to proceed, instead of tampering with 250 years worth of data prior to 1947.
That is not possible, because we don’t have a time-machine with which we can go back and count again, and the original raw data has been ‘disappeared’.
The new sunspots graph is a mixture of 2 different measurement types, the pre-1947 with old method multiplied with a constant, the post-1947 a weighted counting which may be closer to reality or not.
comparison shows that the two different methods give the same result except for a constant factor [or almost constant factor – there is a small anomaly near zero as there are no relative sunspot numbers between 0 and 10]
If it is an improved method, the simple adjustment of the old data through multiplication by 1.2 does not give the same result, else where is the improvement? We are not comparing like with like.
We do get very nearly the same result. The comparison is the best that can be done, like it or not.
LSvalgaard wrote:
This surprises me. You make the suggestion that a solar irradiation would be “even higher without the dark spots to drag it down.”
Isn’t high sunspot activity is associated with a net increase of TSI? The sunspots with their surrounding faculae tend to crank up the Sun’s output rather than “drag it down,” right?
Also, you note a high level of cosmic ray modulation during the Maunder Minimum: “For example, the cosmic ray modulation during the MM was as strong, if not stronger, than today.”
Older papers noted that this modulation was very low; CR level was high (i.e., low CR modulation). For example:
From:
http://cc.oulu.fi/~usoskin/personal/2000JA000105.pdf
Where’s a good place to start to see where these ideas and observed data were overturned?
===|==============/ Keith DeHavelle
Leif thank you for the understandable post. One of the few that didn’t seem to attract any trolls. Interesting. Maybe real science scares them off.
Keith DeHavelle says:
January 5, 2013 at 12:36 pm
Isn’t high sunspot activity is associated with a net increase of TSI? The sunspots with their surrounding faculae tend to crank up the Sun’s output rather than “drag it down,” right?
Solar activity makes two contributions to TSI: S from dark sunspots. S is negative. And F from faculae. F is positive and about equal to twice S, so the net result is positive. If a Maunder Minimum means that there magnetic field is still there [to modulate cosmic rays] then F is still there, but S is gone.
Where’s a good place to start to see where these ideas and observed data were overturned?
many places, e.g. http://www.leif.org/EOS/2009GL038004-Berggren.pdf Figure 2d
“Periodicity in 10Be during the Maunder minimum reconfirms that the solar dynamo retains cyclic behavior even during grand solar minima”
Now, there is a lot of speculation about how to interpret the data and the old myths die slowly, so everything must be taken with the necessary grains of salt.
Leif,
Thank you for bringing this to WUWT. As always, the solar posts cause wonderfully dynamic commenting to occur.
Question for Leif about the length of time it took solar science to begin to focus more on identifying and then addressing rectification of the sun spot count inflation that started circa 1945. Why is the inflation seemly becoming important (workshopped) starting in the second decade of the 21st century? Do you consider ~65 yrs later as a normal timing to address the inflation?
Sidetrack Question for Leif => I am not being cynical (OK, maybe a little cynical) when I ask if a contributory factor in taking so long to address the ss inflation is the overemphasis by funding bodies on research myopically focusing on AGW by CO2 from fossil fuels? Has a bias toward AGW research funding caused reduced resources/ interest on solar research for things like ss inflation?
Happy New Year, Leif.
John
A general comment: my post addresses but a small corner of the whole problem with the limited goal of showing that the official sunspot number record must be corrected. Some researchers believe that the official sunspot number should not be used at all and prefer to use the group sunspot number which they believe is better [and which does vary in a way supporting many pet theories]. In another post I may explain why I don’t think this is correct. For now, just remember the limited goal of the present post.
Are there any plans to stop using the weighted count? Maybe another SIDC station could be the reference station?
Now I know how the sauce was made. It seems like I’ve seen it in dribs and drabs but this was the story from start to present. A highly educational post and discussion. Thank you Leif, Anthony, and commenters.
“At the Royal Greenwich Observatory photographs of the Sun have been taken ‘every’ day since 1874 until they stopped in 1975. “
The British Journal for the History of Science, Vol. 26, No. 2 (Jun., 1993), pp. 137-169
Images of the Sun: Warren De la Rue, George Biddell Airy and Celestial Photography
by Holly Rothermel
A breathtakingly interesting account, recommended for everyone interested in what constitutes “objectivity” in observations and the role played by interpretation.
Not the least important point in the paper, related to our current subject is the fact that regular photographs of the solar disks were started to be taken at the Kew Observatory in 1858 by a photoheliograph developed by De la Rue expressly for the purpose to observe sun spots.
Therefore, we have an almost continuous photographic record of the solar disk for the last 155 years. Or, at least I hope these photographs are archived properly and are available for research.
Then we have the usual questions. Is this dataset digitized? Is it available online? Is it available at all?
If it is, objectivity, as Rothermel notes, is still not ensured, but at least we would have different biases in standardizing resolution, contrast, frequency sensitivity, etc. of images found in the database before feeding them into an image processing algorithm (with its own biases, inserted by designers & coders). Availability of images alone is clearly insufficient for such an endeavor, we’d also need as much metadata as possible in a standardized, algorithmically parsable format.
John Whitman says:
January 5, 2013 at 1:05 pm
Question for Leif about the length of time it took solar science to begin to focus more on identifying and then addressing rectification of the sun spot count inflation that started circa 1945.
I discovered around 2007 that something was wrong http://www.leif.org/research/CAWSES%20-%20Sunspots.pdf
and worked more on it here http://www.leif.org/research/AGU%20Spring%202007%20SH54B-02.pdf
pinning it down to Waldmeier here http://www.leif.org/research/De%20maculis%20in%20Sole%20observatis.pdf
by 2008 it was clear that the Group Sunspot Number was in trouble http://www.leif.org/research/Napa%20Solar%20Cycle%2024.pdf
by 2011 it was clear what was going on http://www.leif.org/research/History%20and%20Calibration%20of%20Sunspot%20Numbers.pdf
and since then the SSN calibration has been a main interest of mine.
Why is the inflation seemly becoming important (workshopped) starting in the second decade of the 21st century? Do you consider ~65 yrs later as a normal timing to address the inflation?
We got those workshops started because the evidence was beginning to be compelling enough that the solar community woke up. I don’t know about the 65 years delay. Some things just take time: http://www.poemhunter.com/poem/t-t-t/
Sidetrack Question for Leif => I am not being cynical (OK, maybe a little cynical) when I ask if a contributory factor in taking so long to address the ss inflation is the overemphasis by funding bodies on research myopically focusing on AGW by CO2 from fossil fuels? Has a bias toward AGW research funding caused reduced resources/ interest on solar research for things like ss inflation?
No, quite the contrary: a main obstacle is the so-called ‘skeptics’ who need the sun to vary much more than it does. To wit: some comments here.
jcarels says:
January 5, 2013 at 1:17 pm
Are there any plans to stop using the weighted count? Maybe another SIDC station could be the reference station?
I think it is mandatory that SIDC continues as it has done [for some time at least]. NOAA, BTW does not weight, so we do have two parallel counts. Part of the goal of the workshops is to figure what to do about this.
Berényi Péter says:
January 5, 2013 at 1:43 pm
Then we have the usual questions. Is this dataset digitized? Is it available online? Is it available at all?
The paper report is [freely] available, not yet in digital form. Unfortunately the record does not overlap with RGO so the calibration is ‘free-floating’ and we can only calibrate by comparing to other records, e.g. the sunspot number 🙂
Dr Leif
Thanks for all of the time you have spent on this post and the comments.
This may be considered OT, but the second draft of AR5 said:
“Many empirical relationships have been reported between GCR or cosmogenic isotope archives and some aspects of the climate system (e.g., Bond et al., 2001; Dengel et al., 2009; Ram and Stolz, 1999). The forcing from changes in total solar irradiance alone does not seem to account for these observations, implying the existence of an amplifying mechanism such as the hypothesized GCR-cloud link. We focus here on observed relationships between GCR and aerosol and cloud properties.”
Do you have a comment?
The size of sun spots varies hugely and difficult to take into account, so I have never been a fan of sun spot number. A better method would be to change to % surface area of the sun.
Methodology of counting sunspots may be important to specialists. However you count them, though, weak Solar cycles remain weak, and years with the low sunspot count remain as such — and correlate, more or less, with the lower temperatures on Earth.
The relevant question, therefore, is not how to count sunspots but what is the mechanism that links various characteristics of Solar activity to the temperature changes on Earth.
Don B says:
January 5, 2013 at 3:28 pm
We focus here on observed relationships between GCR and aerosol and cloud properties.”
Do you have a comment?
Check out my 217 comments on http://wattsupwiththat.com/2012/12/21/haigh-anxiety-a-psycho-comedy-of-errors/
Matt G says:
January 5, 2013 at 4:06 pm
The size of sun spots varies hugely and difficult to take into account, so I have never been a fan of sun spot number. A better method would be to change to % surface area of the sun.
The sunspot area and the sunspot number track each other very closely when averaged over a month. Check Figure 3.
And the area data only goes back to 1874 [and a few years around 1860], so does not give us the long perspective. Furthermore, the Greenwich data stops in 1975 and recent area determinations vary considerably between them.
Don B says:
January 5, 2013 at 3:28 pm
“an amplifying mechanism such as the hypothesized GCR-cloud link”
The typical tactic for arguing against GCRs affecting cloud trends is a depiction based on ISCCP data of Hansen’s GISS for 2004 onwards, but by then there was severe satellite orbit change skewing as noted in http://tinyurl.com/a8lhzz7 . Other data has cloud cover trends more related to cosmic ray trends, including in recent years, as in http://s7.postimage.org/69qd0llcr/intermediate.gif (enlarging on click), which fits with http://tinyurl.com/cozyte3 .
Alexander Feht says:
January 5, 2013 at 4:45 pm
Years ” with the low sunspot count remain as such — and correlate, more or less, with the lower temperatures on Earth.”
And the solar cycle (/ GCR variation) correlates substantially to the time pattern in atmospheric humidity, among other indicators, as illustrated in http://s7.postimage.org/69qd0llcr/intermediate.gif
While you were arguing, the solstice side of the sun has rotated to face us.. and she is a pocked little thing:)
Leif writes “A somewhat disturbing [to many people] consequence of the correction of the official sunspot number is that there is now no evidence for a Modern Grand Maximum [‘the largest in 8000 years’ or some such].”
You’ve said this many times but have you actually calculated the trend of the integrals of that corrected sunspot data? It does look like it could be increasing to me…
TimTheToolMan says:
January 5, 2013 at 7:25 pm
have you actually calculated the trend of the integrals of that corrected sunspot data? It does look like it could be increasing to me…
I was talking about the sunspot numbers. And the trend of the integral of positive numbers is always increasing…
I applied the 1.2 multiplier to the pre 1947 SSN data back to 1750 and just looking at the graph it does still appear that over the past 60 years, SC’s 17, 18, 19, 21, 22 and 23 have been high in amplitude by comparison to the last 350 years. There were a couple of brief periods that came close. Namely SC’s 2, 3 and 4 and then 8, 9, and 11. The peaks in the graph show that “the blow torch has been on” with greater intensity and consistency so to speak in the last 60 years. Joining the peaks up, there is also still a hint of a sine wave showing an approximate 100 year cycle. This pattern indicates a small SC25 and possibly SC26. I am not an expert in this field, just using historical data to produce a trend.
Leif writes “I was talking about the sunspot numbers. And the trend of the integral of positive numbers is always increasing…”
Then look at the rate of change of that. Or look at integrals per time slice and look at the trend from that. You know exactly what I mean but have avoided answering. I strongly suspect you’ll find that the number of sunspots along with time they’ve “hung around” has increased over time. At least thats what the eyeball method shows.
Sunspot says:
January 5, 2013 at 9:00 pm
The peaks in the graph show that “the blow torch has been on” with greater intensity and consistency so to speak in the last 60 years.
Cycles are different, no doubt about it; the question is if they are different enough to call the last 60 years a ‘Grand Maximum’. And it is clear that they are not. To use your trick of naming cycles may I point out that cycles 3, 4, 8, and 11 are all higher than all the cycles in the past 60 years, except 19.
This pattern indicates a small SC25 and possibly SC26.
Patterns cannot be used to predict future cycles.
TimTheToolMan says:
January 5, 2013 at 10:20 pm
I strongly suspect you’ll find that the number of sunspots along with time they’ve “hung around” has increased over time. At least thats what the eyeball method shows.
Yes, they have increased: from 53 the first half of the period to 60 the 2nd half. This is not a significant long-term trend. The Modern Grand Maximum proponents like an increase by a factor of 2. That is the difference.
Leif writes “The Modern Grand Maximum proponents like an increase by a factor of 2.”
I think a 10% increase over that period is enough to be interested in. Particularly when you factor in the additional and unknown variability of Visible vs UV.
Dear Leif,
Are you trying to say that all the 14C and 10Be reconstructions are nonsense?
What do your colleagues think about that?
And even if they don’t tell us anything about sunspot numbers what are they telling us?
Can there be no link to climate at all?
Regards
Ed (Europe)
Eddy says:
January 6, 2013 at 3:36 am
Are you trying to say that all the 14C and 10Be reconstructions are nonsense?
No, and they are actually consistent with my analysis. See Figure 2 of http://www.leif.org/research/Svalgaard_ISSI_Proposal_Base.pdf
Can there be no link to climate at all?
There is definitely a link, but a weak one.
TimTheToolMan says:
January 6, 2013 at 1:57 am
I think a 10% increase over that period is enough to be interested in.
Yes, that would give us a warming of 0.003 degrees.
Leif says “And some people have speculated that when there are no dark spots to cause dips in TSI, that TSI would be higher during a Grand Minimum.”
This is something we can observe pretty much every cycle, and TSI does not seem to rise when sunspot count equals zero. Are you saying the TSI would rise when comparing MM and current solar maximums, or comparing MM and current solar minimums?
Another question: You repeatedly discount all other potential climate variables (Cosmic Ray, UV, you name it) because you limit your argument to specific portions of the argument, in particular, GW from 1980-2000 (when those variables haven’t really changed on that time scale, until recently). Keeping in that time scale, what is your opinion of the PDO, AMO and both their impact on climate and the source of their variability. Do you think that the 1980-2000 portion of the AMO is unnatural? I think it’s pretty obvious you have to subtract the variability of the PDO/AMO (60yr cycle, non-detrended) before analyzing what’s left in the background, unless you either believe the solar signal is very large compared to the oceanic cycle, or the solar cycle itself drives the oceanic cycle.
ed says:
January 6, 2013 at 8:14 am
Leif says “And some people have speculated that when there are no dark spots to cause dips in TSI, that TSI would be higher during a Grand Minimum.”
This is something we can observe pretty much every cycle, and TSI does not seem to rise when sunspot count equals zero. Are you saying the TSI would rise when comparing MM and current solar maximums, or comparing MM and current solar minimums?
1st: I said it is speculation, 2nd: At minimum, dark sunspots and bright faculae disappear, 3rd: at maximum, bright faculae increase TSI more than dark sunspots decrease it [hence the solar cycle variation of TSI], 4th: if during a Grand Minimum period [where we know that the solar cycle is still going on because cosmic rays are modulated] there were only faculae at sunspot maxima, but no dark sunspots, TSI would be higher during those maxima compared to maxima with lots of dark spots [as we have during non-Grand-Minima conditions].
Another question: You repeatedly discount all other potential climate variables (Cosmic Ray, UV, you name it) because you limit your argument to specific portions of the argument
On the contrary, I reconstruct solar wind and UV back centuries and find that they also do not vary much. Sunspot Number, TSI, and all other ‘potential variables’ vary together.
the PDO, AMO and both their impact on climate and the source of their variability
I would say that PDO etc are climate and that their variations are very natural. I just don’t think the Sun is the major driver. But, this post has a more limited scope, namely to point out that the official sunspot number needs revision [and why] before one begins to speculate on possible solar effects. One thing at at time.
In looking at these graphs (the same image as these graphs ) I immediately come up with the question of “How come all the minima in the ‘before’ graph are shown with minima sky high and all over the place while the ‘after’ graph shows them with minima dragged down to the zero to ten range?”
If I look at the individual cycles (The graphs have been prepared by Jan Alvestad based on data from SIDC, Brussels.) I am not seeing the high minima depicted in your ‘before’ graph.
Cycles 1 – 20 and Solar cycles 21-24
If we take Solar Cycle 19 with a peak of 250 to use for fixing the scale in the before graph, then the whole scale is zero to 250 and six divisions gives a count of ~forty per division. The graph I point to for Solar Cycle 19 shows an average minimum count of five on one side and an average minimum count of 10 on the other not ~80 and ~ 40 as depicted on the ‘Before’ graph WUWT? Heck even the low vs high in the minimum count is reversed!
I am not a physicist but I like graphs and used them all the time in presentations. These two graphs make me shudder.
Gail Combs says:
January 6, 2013 at 8:49 am
In looking at these graphs (the same image as these graphs ) I immediately come up with the question of “How come all the minima in the ‘before’ graph are shown with minima sky high and all over the place while the ‘after’ graph shows them with minima dragged down to the zero to ten range?”
I could have shown the Group Sunspot Number instead, which would have been a more direct comparison. I chose to show a different graph to underscore the real problem [and to provoke comments and discussion like yours]. People that model TSI, UV, cosmic rays, etc [often for the purpose of showing solar influence on climate] employ the following ‘trick’: they compute a ‘background’ from the cycle average sunspot number [usually the Group Sunspot Number as it varies in a convenient way] and then add to that background the annual values based on the annual sunspot numbers [thus effectively double the variation]. With this trick, the Modern Grand Maximum looms really large and significant. The ‘background’ values, of course, make the minima a lot higher.
Slide 18 of http://www.leif.org/research/Solar-Petaluma–How%20Well%20Do%20We%20Know%20the%20SSN.pdf shows how this ‘works’.
These two graphs make me shudder
Make me shudder too
Gail Combs says:
January 6, 2013 at 8:49 am
In looking at these graphs (the same image as these graphs ) I immediately come up with the question of “How come all the minima in the ‘before’ graph are shown with minima sky high …
Slide 8 of http://www.leif.org/research/Solar-Petaluma–How%20Well%20Do%20We%20Know%20the%20SSN.pdf shows the Group Sunspot Number in the lower left [blue curve].
Perhaps if you study temperature data the late 20th century warming will go away as well…..)
“”Leif says “And some people have speculated that when there are no dark spots to cause dips in TSI, that TSI would be higher during a Grand Minimum.”
This is something we can observe pretty much every cycle, and TSI does not seem to rise when sunspot count equals zero. Are you saying the TSI would rise when comparing MM and current solar maximums, or comparing MM and current solar minimums?
1st: I said it is speculation, 2nd: At minimum, dark sunspots and bright faculae disappear, 3rd: at maximum, bright faculae increase TSI more than dark sunspots decrease it [hence the solar cycle variation of TSI], 4th: if during a Grand Minimum period [where we know that the solar cycle is still going on because cosmic rays are modulated] there were only faculae at sunspot maxima, but no dark sunspots, TSI would be higher during those maxima compared to maxima with lots of dark spots [as we have during non-Grand-Minima conditions]. “”
Is there data at present that shows that TSI is higher when there are faculae present with smaller dark spots? Seems like we should be detecting this since the L&P graph seems to be holding, or generate a scatter plot to see if there is correlation, and I would think there is enough variability between cycles to quantify this. Or is it just that our current PMOD/ACRIM composites are not of sufficient quality to quantify for the last three cycles?
“On the contrary, I reconstruct solar wind and UV back centuries and find that they also do not vary much. Sunspot Number, TSI, and all other ‘potential variables’ vary together.”
I thought that it was recently noted that solar wind changed by 50% more than expected, and also that it was discovered that the UV varied by 10x from expectations (10% rather than 1%)?
“lsvalgaard says:
January 6, 2013 at 6:40 am
TimTheToolMan says:
January 6, 2013 at 1:57 am
I think a 10% increase over that period is enough to be interested in.
Yes, that would give us a warming of 0.003 degrees.”
I am assuming you are discussing UV…Do you have data to back up that calculation of 0.003 degrees (didn’t know the science had been worked out on that)? What is the time period of discussion for the 10% variation?
Hy again,
Thank you very much for your kind reply. 🙂
But what about this graph:
http://www.mpg.de/495993/pressRelease20041028
Has this been proven to be wrong? Isn’t there a consensus that on longer timescales solar “cycles” influence climate. There is an explanation for the Dansgaard-Oeschger-events based on several solar cycles. What about these cycles? Is there a scientific consensus that these cycles exist?
And if you were right, wouldn’t that mean that no such cycles ever existed. Or do you just say, that there was nearly no difference between 1700 and 2010, but on longer timescales there was a stronger effect on climate by TSI.
What I try to find out is if the sun cannot be responsible for anything, what has caused the differences in 14C and 10Be over longer timescales.
Do I understand your linked paper right, that these questions are still disputed and under investigation. Or is this blogpost the new consensus among solar scientists that there is no Great Maximum and nothing less important than todays Minimum?
Best regards
Ed(Europe)
DayHay says:
January 6, 2013 at 9:54 am
Perhaps if you study temperature data the late 20th century warming will go away as well…..
I think you are nurturing a false hope…
ed says:
January 6, 2013 at 10:07 am
Is there data at present that shows that TSI is higher when there are faculae present with smaller dark spots? Seems like we should be detecting this since the L&P graph seems to be holding, or generate a scatter plot to see if there is correlation, and I would think there is enough variability between cycles to quantify this. Or is it just that our current PMOD/ACRIM composites are not of sufficient quality to quantify for the last three cycles?
PMODACRIM are not good enough for this, long-term, but there are some indications that TSI from the much more accurate SORCE mission does not follow the sunspot number in recent years. E.g. http://www.leif.org/research/TSI-Recent-SSN.png
ed says:
January 6, 2013 at 10:10 am
I thought that it was recently noted that solar wind changed by 50% more than expected, and also that it was discovered that the UV varied by 10x from expectations (10% rather than 1%)?
You have been [partly] had by NASA press releases. The solar wind now is where it was a century ago. The UV variation has to do with how UV varies with wavelength, not with the total amount of UV we get.
ed says:
January 6, 2013 at 10:14 am
I am assuming you are discussing UV…Do you have data to back up that calculation of 0.003 degrees (didn’t know the science had been worked out on that)? What is the time period of discussion for the 10% variation?
During the 1st half of the time since 1700 the average sunspot number was 53, during the 2nd half it was 60. From modern measurements we know that 1 sunspot increases TSI by 0.007 W/m2 on average, so 7 extra spots increase TSI by 0.049 W/m2 or a fraction of 0.049/1361 = 0.00036 of TSI. That changes the temperature by a quarter of that [as per Stefan-Boltzman law], or 0.00009, which of the current 288K comes to 0.00259K
Eddy says:
January 6, 2013 at 10:20 am
But what about this graph:
http://www.mpg.de/495993/pressRelease20041028
Has this been proven to be wrong?
Essentially: yes. The red data points are the Group Sunspot number sliced on to the blue curve. And the GSN is not correct.
Isn’t there a consensus that on longer timescales solar “cycles” influence climate. There is an explanation for the Dansgaard-Oeschger-events based on several solar cycles. What about these cycles? Is there a scientific consensus that these cycles exist?
The D-O ‘cycles’ are likely an artifact from averaging 1000 and 2000 year variations [there is no ‘sharp’ 1500 or 1470-yr cycle]. There are very likely such long ‘cycles’ in climate. There is no good evidence that they are solar related.
What I try to find out is if the sun cannot be responsible for anything, what has caused the differences in 14C and 10Be over longer timescales.
We know that climate produces a part of the cosmic ray proxy variations as large or larger than those directly caused by the sun. Only more ice cores can resolve the question.
that these questions are still disputed and under investigation.
All of these questions are under heavy and vigorous debate. Old ‘myths’ die slowly. The end result of the current research is not in sight. What my post here is about, is to at least get one of the input parameters correct.
ed says:
January 6, 2013 at 10:14 am
Do you have data to back up that calculation of 0.003 degrees (didn’t know the science had been worked out on that)? What is the time period of discussion for the 10% variation?
It is difficult to type in so many zeroes. Here are the correct numbers:
During the 1st half of the time since 1700 the average sunspot number was 53, during the 2nd half it was 60. From modern measurements we know that 1 sunspot increases TSI by 0.007 W/m2 on average, so 7 extra spots increase TSI by 0.049 W/m2 or a fraction of 0.049/1361 = 0.000036 of TSI. That changes the temperature by a quarter of that [as per Stefan-Boltzman law], or 0.000009, which of the current 288K comes to 0.00259K
The last number 0.00259 was correct. For all whiners: the albedo, emissivity, greenhouse effects, and the spherical Earth are automatically taken into account by using the actual temperature 288K.
Thanks, for the very informative blog/post. As to the comment, “A somewhat disturbing [to many people] consequence of the correction of the official sunspot number is that there is now no evidence for a Modern Grand Maximum [‘the largest in 8000 years’ or some such].”
Many thinking that the prior sunspot data was correct formed hypothesis about the climate based on those ideas. And once someone has a favorite hypothesis, it is difficult to let it go.
On the other hand, if the most significant driver of warm and cold periods was the sun, the lack of a Modern Grand Maximum seems to fit with the changes in climate that have been seen. The Little Ice Age was a very cold period and during that period, I think the evidence supports that there was some kind of grand minimum of sun spots given that many observers indicate no sunspots were even seen for an extended period. Perhaps since the “grand minimum” if that is what it was, the sun returned to normal and since then, temperatures have been gradually recovering back to what it was during the Medieval period. Since there are cycles of solar activity the warming has not been even but somewhat cyclical due to the influence of solar changes, random climatic events, volcanoes, changes in climate cycles and even changes in CO2.
Leif replies “I think a 10% increase over that period is enough to be interested in.
Yes, that would give us a warming of 0.003 degrees.”
I dont suppose you have that figure in W/m2 do you?
BobG says:
January 6, 2013 at 1:24 pm
Perhaps since the “grand minimum” if that is what it was, the sun returned to normal and since then, temperatures have been gradually recovering back to what it was during the Medieval period.
since we don’t really know what causes those long-period climate changes, your view can, of course, not be easily dismissed. But, if you are correct, we would expect that the climate would change very slowly [on a human scale] so talking about impending ice ages because the Earth may not have warmed the last 16 or so years does not make much sense. Also, one would expect the long-term solar and climate records to be in sync for thousands of years [‘forever’, essentially]. This does not seem to be the case, but one could always say that the data is not good enough to determine the case either way. In any case, the purpose of my research and my post here is not to entertain such speculations, but simply to make sure at least one of the solar inputs to the problem is as correct as we can make it. Personally, I’m a fence-sitter on the sun-weather-climate issue and I do not believe one should let politics or emotions and such run the science. People often get the impression that I’m ‘dead-set’ against any S-W-C connection. This is incorrect. The truth is simply that none of the arguments [some good, most bad] brought forward on this have compelled me to come off the fence.
TimTheToolMan says:
January 6, 2013 at 1:34 pm
Leif replies “I think a 10% increase over that period is enough to be interested in.
Yes, that would give us a warming of 0.003 degrees.”
I dont suppose you have that figure in W/m2 do you?
Read my comments, please. How does 0.049 W/m2 grab you? I could live with a doubling of that, for a temperature change of 0.005 degrees.
TimTheToolMan says:
January 6, 2013 at 1:34 pm
I dont suppose you have that figure in W/m2 do you?
The tone of your comment leaves a bit to be desired. You could have said something like this:
“I am too lazy [or don’t have time, can’t read, whatever] to check if you gave a figure in W/m2. If I missed it, could you please tell me again? Thank you”.
Leif writes “From modern measurements we know that 1 sunspot increases TSI by 0.007 W/m2 on average, so 7 extra spots increase TSI by 0.049 W/m2 or a fraction of 0.049/1361 = 0.000036 of TSI.”
No I had simply missed that you’d given the answer in response to someone else. For that, I apologise. In that answer you’ve not mentioned whether that is using the previous understanding on Sunspot vs TSI leading to Visible energy or after the Harder adjustment?
It seems to me that if a multiplier of say 4 was used for the Harder adjustment then the difference is out around 0.2 W/m2 and that is something worth considering.
TimTheToolMan says:
January 6, 2013 at 6:23 pm
No I had simply missed that you’d given the answer in response to someone else. For that, I apologise.
OK.
In that answer you’ve not mentioned whether that is using the previous understanding on Sunspot vs TSI leading to Visible energy or after the Harder adjustment?
TSI includes all the solar output at all wave lengths. The Harder suggestion does not change TSI measurably.
Here is what I have SIDC with pre1947 SSN 1.2x. Looks like it doesn’t make a lot of difference to the trend, or the significance of the activity over the last 60yrs. It is exceptional in our era…what the final multipliers will be, who knows…
http://s852.beta.photobucket.com/user/etregembo/media/SIDCSSNADD20PERCWNTPRE1947_zps6f5c6b8b.png.html
ed says:
January 6, 2013 at 6:32 pm
It is exceptional in our era…
‘Exceptional’ is too strong. Compared with the often touted Modern Grand Maximum, out era is not special.
what the final multipliers will be, who knows…
As far as the influence of the weighting, there is not much more to expect. The cause has been found, the effect measured, and that is it. Further data or analysis will not change the result significantly. An issue is whether Wolf’s assessment was correct to begin with. That may be a topic of a future post.
“A comparison with sunspot and neutron records confirms that ice core 10Be reflects solar Schwabe cycle variations, and continued 10Be variability suggests cyclic solar activity throughout the Maunder and Spoerer grand solar activity minima. Recent 10Be values are low; however, they do not indicate unusually high recent solar activity compared to the last 600 years.”
http://www.leif.org/EOS/2009GL038004-Berggren.pdf
Leif Svalgaard says:
January 6, 2013 at 9:26 am
…I could have shown the Group Sunspot Number instead, which would have been a more direct comparison. I chose to show a different graph to underscore the real problem [and to provoke comments and discussion like yours]….
>>>>>>>>>>>>>>>>>>>>
Thanks for the explanation. I have no use for that sort of game playing. It does not advance scientific knowledge.
As you know, I think the sun has some effect on the climate but that type of crap is doing no one any favors. I am also willing to entertain other variables as having an effect, water being the biggest as far as I can see so far. However I don’t think any one has the list nailed down yet much less all the mechanisms. – a very intriguing scientific problem.
Gail Combs says:
January 6, 2013 at 7:09 pm
Thanks for the explanation. I have no use for that sort of game playing. It does not advance scientific knowledge.
You are right. That was poor judgement on my part. I was trying to do too much in one go. What I should have shown is the use people put the SSN to, like this Figure
http://www.leif.org/research/TSI-GSN-SSN-Background.png
The very intriguing problem of sun-climate is plagued by input with known problems. We are trying to remedy some of those.
Leif writes “TSI includes all the solar output at all wave lengths. The Harder suggestion does not change TSI measurably.”
You have mentioned this several times but TSI is not the whole story.
The Harder adjustment means more Visible and less UV (or vice versa) and that means more surface warming and related stratosphere cooling (or vice versa) and we dont know whether there has been a trend on those. The Harder adjustment means there is more scope for change and potential trends.
The December 2012 Smoothed Sunspots Number and their effect on the Smoothed Monthly Values curve have been posted. http://www.swpc.noaa.gov/SolarCycle/sunspot.gif
The SMV curve has inflected and the negative slope now parallels the Predicted Values Curve of 2008, but ~30 SSN lower and 9½ months early.
TimTheToolMan says:
January 7, 2013 at 12:05 am
The Harder adjustment means more Visible and less UV (or vice versa) and that means more surface warming and related stratosphere cooling (or vice versa) and we dont know whether there has been a trend on those. The Harder adjustment means there is more scope for change and potential trends.
There are several possibilities:
1) The Harder finding is not real [due to calibration problems]
2) Even if real, the effect on global temperature is very small [less 0.1 degrees] as per the calculations of Calahan that I showed
3) We have a good proxy for UV going back to 1722 [the diurnal variation of the geomagnetic field] which shows that total UV closely follows ordinary solar activity
4) If the Harder effect is real and UV behaves like that in every cycle it does not influence the trend
5) If the Harder effect is new [i.e. never happened before] then the effect cannot have been the reason for climate change over time.
6) More scope for change hardly matters if the changes are very small [c.f. point2]
TimTheToolMan says:
January 7, 2013 at 12:05 am
The Harder adjustment means more Visible and less UV (or vice versa)
In regard to my point 1):
Lean, Judith L., Matthew T. DeLand, 2012: How Does the Sun’s Spectrum Vary?. J. Climate, 25, 2555–2560. doi: http://dx.doi.org/10.1175/JCLI-D-11-00571.1
How Does the Sun’s Spectrum Vary?
“Recent observations made by the Spectral Irradiance Monitor (SIM) on the Solar Radiation and Climate Experiment (SORCE) spacecraft suggest that the Sun’s visible and infrared spectral irradiance increased from 2004 to 2008, even as the total solar irradiance measured simultaneously by SORCE’s Total Irradiance Monitor (TIM) decreased. At the same time, solar ultraviolet (UV) irradiance decreased 3–10 times more than expected from prior observations and model calculations of the known effects of sunspot and facular solar features. Analysis of the SIM spectral irradiance observations during the solar minimum epoch of 2008, when solar activity was essentially invariant, exposes trends in the SIM observations relative to both total solar irradiance and solar activity that are unlikely to be solar in origin. The authors suggest that the SIM’s radically different solar variability characterization is a consequence of undetected instrument sensitivity drifts, not true solar spectrum changes. It is thus doubtful that simulations of climate and atmospheric change using SIM measurements are indicative of real terrestrial behavior.”
TimTheToolMan says:
January 7, 2013 at 12:05 am
The Harder adjustment means more Visible and less UV (or vice versa)
http://ntrs.nasa.gov/archive/nasa/casi.ntrs.nasa.gov/20110023422_2011024608.pdf
“Thus, we conclude that the solar UV variations presented in Harder et al. (2009) and Haigh et al.
(2010) are incorrect, and that the long-term calibrations of the SORCE SIM and SORCE
SOLSTICE instruments need to be revised.”
lsvalgaard says:
January 5, 2013 at 11:04 am
Jim G says:
January 5, 2013 at 10:15 am
“The sunspot cycle controls only a very small part of our climate, so the precise method is not so important.”
“Perhaps a “lead us to believe” type comment would be less dogmatic and more appropriate.
It should be obvious that everything I say is just my humble opinion. ”
Your “humble” opinion is, as always, valued highly by me. I was only asking that it be stated as something less than hard fact given the variety of opinions on the subject. But then, perhaps, for a moment I forgot to whom I was speaking and sincerely would not want too much change as I do very much enjoy your “humble” responses.
Regards
Leif writes “2) Even if real, the effect on global temperature is very small [less 0.1 degrees] as per the calculations of Calahan that I showed”
As I’ve repeatedly said, I’m NOT interested in what models suggest the related temperature changes will be and am only interested in the differrence in the forcing because that can directly be related to the OHC changes which IMO is the only useful measure of GW.
And I’ve also said all along that the SIM data is new, short and could be problematic. I’ve never said the Harder adjustments are real but they’re all we have to go on for the moment. However if the more general result is true that UV and Visible components of TSI vary more than previously thought then that very much adds the possibility of trends leading to long term effects at the surface.
Anyway we’re going round in circles. You have your strong beliefs on this but I’m not convinced yet and would prefer to let the data speak for itself until it has been shown to be wrong and no I dont think the reanalysis has shown that yet. In time we’ll get a definitive answer although it may take years and more obsevations to do so.
lsvalgaard says:
January 5, 2013 at 2:31 pm
The paper report is [freely] available, not yet in digital form. Unfortunately the record does not overlap with RGO so the calibration is ‘free-floating’ and we can only calibrate by comparing to other records, e.g. the sunspot number 🙂
Nope, I am not interested in reports, paper or otherwise. I am interested in a database of more than 150 years of solar disk images (from 1858 to 2012). That’s what it takes to settle the question.
Berényi Péter says:
January 7, 2013 at 1:57 pm
…………….
Hi
Not exactly what you want, Debrecen Photoheliographic Data (1977-2012) plates are on line http://fenyi.solarobs.unideb.hu/DPD/index.html
Lief
I was looking more at the SC highs as groups rather than the spikes. Using the factor of 1.2 for pre 1947 the linear trend is still upwards and the Polynomial trend line shows a much more pronounced rise after 1950.
Jim G says:
January 7, 2013 at 12:23 pm
I was only asking that it be stated as something less than hard fact given the variety of opinions on the subject.
The subject has been opined [pro and con] upon for 400 years, so can hardly be considered a hard fact.
TimTheToolMan says:
January 7, 2013 at 1:56 pm
would prefer to let the data speak for itself until it has been shown to be wrong
I would prefer to let the data speak for itself until it has been shown to be right
Berényi Péter says:
January 7, 2013 at 1:57 pm
I am interested in a database of more than 150 years of solar disk images (from 1858 to 2012). That’s what it takes to settle the question.</i<
Me too. Unfortunately no such database exists.
Sunspot says:
January 7, 2013 at 4:16 pm
I was looking more at the SC highs as groups rather than the spikes. Using the factor of 1.2 for pre 1947 the linear trend is still upwards and the Polynomial trend line shows a much more pronounced rise after 1950.
The issue is not if there is a trend, but if there is a significant trend.
Using a three-cycle grouping [some solar scientists like that] the long-term variation looks like this: http://www.leif.org/research/Modern-Grand-Maximum-NOT.png with the blue curve being the 33-yr smoothed variation. In the upper left is Usoskin’s ‘Grand Maximum’ [with a 25 or 50 yr smooth – I forget which]. That is what we should compare with.
Now, I perfectly well understand the real need for seeing a significant trend to explain Global Warming.
“Leif Svalgaard says:
January 6, 2013 at 6:50 pm
ed says:
January 6, 2013 at 6:32 pm
It is exceptional in our era…
‘Exceptional’ is too strong. Compared with the often touted Modern Grand Maximum, out era is not special.
what the final multipliers will be, who knows…
As far as the influence of the weighting, there is not much more to expect. The cause has been found, the effect measured, and that is it. Further data or analysis will not change the result significantly. An issue is whether Wolf’s assessment was correct to begin with. That may be a topic of a future post.”
What I meant by multipliers are potential multipliers of the SC trend, like Cosmic Rays, UV, penetration into the ocean, cloud cover, atmospheric expansion/contraction, etc. The real climate drivers are not well defined or understood I believe. Like the oceanic 60yr cycle, suspiciously similar to the solar cycle activity clusters, but much out of phase/doesn’t match. With the AMO going cold in another 5yrs or so, that will be revealing and will likely cause a mandatory inclusion in any climate model (and subtract from modern CO2 attibutions). We’ll get closer to reality but only once some of the drivers cause climate to get colder, which thankfully with SC24/25 and the PDO/AMO heading negative we’ll get to observe in our lifetime (to the aingst of the climate modelers as every year diverges from thier current reality). Not to mention once the oceanic driver is acknowldeged, it can be removed and some of the background residual analyzed for other signatures, solar or otherwise.
Thanks for the polite responses, very much appreciated.
Leif writes “I would prefer to let the data speak for itself until it has been shown to be right”
Which data would you let speak for itself then?
vukcevic says:
January 7, 2013 at 2:51 pm
Not exactly what you want, Debrecen Photoheliographic Data (1977-2012) plates are on line http://fenyi.solarobs.unideb.hu/DPD/index.html
Thanks, wonderful. That’s exactly the kind of data I am looking for. The job is obviously not finished yet, though.
Leif Svalgaard says:
January 7, 2013 at 5:44 pm
Unfortunately no such database exists.
Leif, this is not entirely true, as vukevic has shown.
folks at Debrecen Observatory say: “The Debrecen Photoheliographic Data (DPD) sunspot catalogue is compiled as a continuation of Greenwich Photoheliographic Results (GPR)”
Now, questions: is there such a project under way at the Royal Greenwich Observatory? Kew Observatory? Are the photographic plates themselves archived? available for research? digitalized? put online?
I understand such projects need money and much silent human labor, but is not that science used to be about? Careful examination of data already collected, I mean. Are frivolous & futile modelling games played on supercomputers not much more expensive?
Greenwich Photo-heliographic Result (GPR) online
No photographic evidence, though. How come?
TimTheToolMan says:
January 7, 2013 at 11:51 pm
Which data would you let speak for itself then?
The data that shows otherwise.
Berényi Péter says:
January 7, 2013 at 11:53 pm
“Unfortunately no such database exists.”
Leif, this is not entirely true, as vukevic has shown.
No such database exists. Disconnected pieces, only.
Now, questions: is there such a project under way at the Royal Greenwich Observatory? Kew Observatory? Are the photographic plates themselves archived? available for research? digitalized? put online?
Whatever is available is not in digital form, depending on what you mean by that. The plates themselves are very difficult to work with.
Here is what is available:
http://www.leif.org/research/SSN/Willis.pdf
http://www.leif.org/research/SSN/Willis3.pdf
The ‘digital’ format is essentially just the ‘paper reports’
The plates still exists: http://janus.lib.cam.ac.uk/db/node.xsp?id=EAD%2FGBR%2F0180%2FRGO%2050
There is work ongoing to digitize the plates, e.g. http://arxiv.org/pdf/1212.4776.pdf
But, the Grand Database you were after does not [yet] exist [regardless of Vuk]
I understand such projects need money and much silent human labor, but is not that science used to be about? Careful examination of data already collected, I mean.
And we are trying to do something about it: http://ssnworkshop.wikia.com/wiki/Home
Berényi Péter says:
January 8, 2013 at 12:26 am
Greenwich Photo-heliographic Result (GPR) online
No photographic evidence, though. How come?
The plates exist. But putting them online is an enormous task, and interest is low.
Leif Svalgaard says:
January 8, 2013 at 1:28 am
The plates exist.
Wow, you mean no one bothered to look at them in one and a half century? Is it not cleaner to count spots on a sample of old plates using the current method and compare it to old counts?
Berényi Péter says:
January 8, 2013 at 7:10 am
Wow, you mean no one bothered to look at them in one and a half century?
They had already been counted…
Is it not cleaner to count spots on a sample of old plates using the current method and compare it to old counts?
Because of the strong indications of a problem with the sunspot series, old plates and drawings are being revisited.
Leif replies “Which data would you let speak for itself then?
The data that shows otherwise.”
So in your mind, the data that was based on proxy and assumption trumps the data that was measured by a purpose built satellite launched to specifically measure the spectral variance?
TimTheToolMan says:
January 8, 2013 at 1:31 pm
So in your mind, the data that was based on proxy and assumption trumps the data that was measured by a purpose built satellite launched to specifically measure the spectral variance?
In a sense, yes. These measurements are very difficult.
Solar UV variations during the decline of Cycle 23
Deland, Matthew T.; Cebula, Richard P.
Journal of Atmospheric and Solar-Terrestrial Physics, Volume 77, p. 225-234, 2012.
“Previous satellite measurements of solar UV variability show consistent solar cycle irradiance changes within instrumental uncertainties, and also show consistent spectral dependence for both rotational and solar cycle variations. Empirical solar irradiance models produce solar UV variations that agree well with observational data. Recent UV irradiance data from the Solar Radiation and Climate Experiment (SORCE) Spectral Irradiance Monitor (SIM) and Solar Stellar Irradiance Comparison Experiment (SOLSTICE) instruments longward of 170 nm covering the declining phase of Cycle 23 show solar variations that greatly exceed both previous measurements and predicted irradiance changes over this period. The spectral dependence of the SIM and SOLSTICE variations differs from previous results. However, short-term solar variability derived from SIM and SOLSTICE UV irradiance data agrees with other concurrent solar UV measurements and previous results, suggesting no change in solar physics. The SORCE long-term UV results can be explained by undercorrection of instrument response changes during early on-orbit measurements.”
Leif writes “In a sense, yes. These measurements are very difficult.”
That is only calling into question the long term variation of the data. A question that cant easily be answered with only short term data. The thing is that SIM has (IMO) correctly identified much more variability within TSI than was previously thought. Do you think that finding too, is wrong?
Longer term spectral variation (in the tenth of Watts range at least) seems quite possible to me and I would think quite likely even if it isn’t convincingly captured in a few short years worth of data.
Putting it another way, why would you think the sun doesn’t vary considerably in its spectral output? We already know it varies in its total output. And why would you think those spectral variations should be in step with the total output?
TimTheToolMan says:
January 8, 2013 at 5:49 pm
That is only calling into question the long term variation of the data.
No, it is calling into question the few years of dubious SIM data.
Do you think that finding too, is wrong?
Too? yes, that finding is wrong or rather has not been substantiated and established. What is ‘wrong’ is believing it is a ‘fact’.
Longer term spectral variation (in the tenth of Watts range at least) seems quite possible to me and I would think quite likely even if it isn’t convincingly captured in a few short years worth of data.
We normally don’t consider what ‘seems possible’. We try to go with what the data shows, rather than wishful thinking.
Putting it another way, why would you think the sun doesn’t vary considerably in its spectral output?
Since the UV is due to the same cause as all the other variations, namely the magnetic field, we expect it to vary the same way in every cycle.
Leif writes “We normally don’t consider what ‘seems possible’. We try to go with what the data shows, rather than wishful thinking.”
I find it slightly ironic that you say that but at the same time disregard the only actual data we have of spectral variance from a purpose built satellite. Surely the data rules UNTIL it is shown to be faulty. And by *shown to be faulty* I dont mean someone wanting it to be too great and comparing it to model output because it was unexpected.
Sure…if its waaaay out of spec then thats different but this data is well within what is possible.
Hy again,
I first want to thank you for your blog post and the thousand replies.
You are for the last more then 15 years one of the nicest scientists I ever “talked” to.
And what you explain is easily understandable for us laymen.
I didn’t read everything. Sorry. Maybe you already answered my question: “What is in your opinion the main driver of climate shifts, like the one that happened at the end of the LIA?”
Thank you very much again!!!!
Ed(Europe)
TimTheToolMan says:
January 9, 2013 at 12:55 am
Surely the data rules UNTIL it is shown to be faulty.
As a general rule that is not true. There are many cases where unexpected data are subsequently shown to be faulty. A good example is the data showing that neutrinos travel faster than light http://news.sciencemag.org/scienceinsider/2012/06/once-again-physicists-debunk.html
The names of the game are ‘duplication’ and ‘reproducibility’.
Leif writes “As a general rule that is not true.”
I would agree where the data is not measured but instead derived from proxies or from theory and models alone. In this case its an actual measured value. Measured by a device that was designed specifically to make the measurements. So in this case the data does rule until otherwise shown to be wrong.
Leif gives an example “A good example is the data showing that neutrinos travel faster than light”
Not a good example. There are good theoretical reasons why the neutrinos weren’t travelling faster than light and so that result was always going to be carefully verified.
Leif writes “The names of the game are ‘duplication’ and ‘reproducibility’.”
Neither of which apply to the data you prefer. The paper you quoted earlier had this to say about spectral variability
“short-term solar variability derived from SIM and SOLSTICE UV irradiance data agrees with other concurrent solar UV measurements and previous results, suggesting no change in solar physics.”
However you replied with “yes, that finding is wrong or rather has not been substantiated and established.”
So you can see that its really only your bias that prevents you from accepting that its very likely the spectral variance is greater then you’d have expected in the past. Why would you do that Leif?
TimTheToolMan says:
January 10, 2013 at 2:40 am
Not a good example. There are good theoretical reasons why the neutrinos weren’t travelling faster than light and so that result was always going to be carefully verified.
There are also good theoretical reasons why the UV variations reported are likely not real.
The paper you quoted earlier had this to say about spectral variability
“short-term solar variability derived from SIM and SOLSTICE UV irradiance data agrees with other concurrent solar UV measurements and previous results, suggesting no change in solar physics.”
However you replied with “yes, that finding is wrong or rather has not been substantiated and established.”
Your quote out of context is the reason the SIM data is wrong. Read the paper. We can test our understanding of UV variations by looking at the short-term [from day to day] variations. And they show that there is no ‘change in solar physics’, i.e. SIM is not correct. Which is not surprising as those measurements are difficult to make.
TimTheToolMan:
I would agree where the data is not measured but instead derived from proxies or from theory and models alone. In this case its an actual measured value. Measured by a device that was designed specifically to make the measurements. So in this case the data does rule until otherwise shown to be wrong.
When first launched, The Hubble Space Telescope returned data known immediately to be erroneous, even though it was a measuring device designed specifically to make the measurements. The error was recognised because the data did not match previous knowledge; nobody had to wait for proof of spherical abberation.
Sometimes the measuring instrument and/or the data processing just aren’t up to the job.
As an aside: I have to constantly remind myself that (nearly?) all “measurements” are actually proxies themselves. When I go outside and measure the temperature, I’m not assessing how much the molecules making up the environment are vibrating – I’m judging the position of the end of a column of mercury against a scale of length. If I want to know a temperature from 1927, I look up the record of someone who used a similar proxy. In doing so, I’m making big assumptions about (trusting) the combined knowledge and skills of scientists and engineers over a long time.
With enough data over time, properly assessed, proxies like sunspot-number-for-solar-magnetism can be as reliable as mercury-position-for-molecular-vibration.
Of course, other proxies, with little data over time, improperly assessed, may represent little more than longed-for-hockeysticks. 😉
And of course, I deliberately wrote “abberation” as a proxy for irony…
PJF writes “With enough data over time, properly assessed, proxies like sunspot-number-for-solar-magnetism can be as reliable as mercury-position-for-molecular-vibration.”
For TSI, perhaps. But sunspots may never say anything about the spectral components that make up that total. And changes in the composition of TSI make all the difference as to how the atmospheric heating operates. The Hubble Space Telescope’s lens problem produced results that didn’t match those from other measurements and so it was obvious something was wrong. There is no similar “obviousness” about the SIM irradiance values.
We should always be sceptical about data but pointing out that the measured data doesn’t correspond to what we thought it ought to have been is as useless as a catflap in the elephant house.
http://heliophysics.nasa.gov/SolarMinimum24/papers/Merkel.pdf
“The SIM irradiance measurements have an accuracy of better than 2% [Harder et al., 2010] and a long-term repeatability in the ultraviolet portion of the spectrum (220-310nm) is about 0.5-0.1%, in the 310-400 nm range the agreement is about 0.2-0.05%, and in the 400-1600 nm range the agreement is better than 0.05%. Auxiliary material to the Harder et al., [2009], describe the degradation correction methodology.”
So whilst its still possible there is something wrong with the SIM data and particularly with respect to drift over its relatively short life, until such time as something is SHOWN to be wrong with the short term variability of the data in particular, it stands. 2% is a world away from the 500% + that Leif believes is the case.
PJF follows on with “And of course, I deliberately wrote “abberation” as a proxy for irony…”
Quite clever. Myopia prevented me from seeing it the first time 😉
TimTheToolMan says:
January 10, 2013 at 6:09 pm
So whilst its still possible there is something wrong with the SIM data and particularly with respect to drift over its relatively short life, until such time as something is SHOWN to be wrong with the short term variability of the data in particular, it stands.
As I told you already, there is nothing wrong with the short-term variability. It is the long-term stability that is wrong. The observed short-term variability matches what our understanding, models, and previous observations say it should be. “the is no new solar physics”. It is the long-term stability that is in doubt, because the detectors degrade very quickly when exposed to that harsh UV in space. Modeling and correction of that degradation is likely where the problem lies.
The variation ‘over time’ is where people [like you] confuse things. UV etc vary a lot on a day-to-day basis, or even on a year-to-year basis, but since solar activity is cyclic there is a much smaller variation from cycle to cycle. It is like the weather: it varies a lot from day-to-day and from season-to-season, but a lot less from year-to-year. We have a good measure of the amount of UV we get over a year simply by measuring the variation of the direction of a compass needle [ http://www.leif.org/research/CAWSES%20-%20Sunspots.pdf ] and that measure shows us that the UV varies just like the Sunspot Number, the radio flux from the sun, TSI and just about every solar indicator you can find. So, UV over time is as stable as TSI. No purpose-built satellite can change that.
I wrote “That is only calling into question the long term variation of the data. A question that cant easily be answered with only short term data. The thing is that SIM has (IMO) correctly identified much more variability within TSI than was previously thought. Do you think that finding too, is wrong?”
And you replied “Do you think that finding too, is wrong?
Too? yes, that finding is wrong or rather has not been substantiated and established. What is ‘wrong’ is believing it is a ‘fact’.”
Now you write “As I told you already, there is nothing wrong with the short-term variability.”
No Leif. You told me the variability was wrong.
Then you say “The variation ‘over time’ is where people [like you] confuse things.”
Really, I dont feel confused by this. The fact is that long term variability is not ruled out by the SIM data, its just far from certain. But if you accept more short term variability then you are (even if you dont know it) accepting the greater possibility of long term variability as well.
TimTheToolMan says:
January 11, 2013 at 4:09 am
But if you accept more short term variability then you are (even if you dont know it) accepting the greater possibility of long term variability as well.
The greater possibility is contradicted by the observations I referred to. They show that UV simply follow the sunspot number and does not have any long-term variation beyond that.
Leif writes “The greater possibility is contradicted by the observations I referred to. ”
The greater possibility has nothing to do with the observation you referred to. It doesn’t need long term drift of values for any component (UV or visible) nor does it need out of phase variability. It simply needs more UV and less visible for a period meaning less energy at the ground followed by a period of less UV and more visible meaning more energy at the ground…all within the same observed TSI.
No measurements we have dispute that possibility and indeed they tend to support the idea.
You have pointed out that TSI alone only accounts for a small energy difference but if these variations are included then the energy difference could be greater.
TimTheToolMan says:
January 11, 2013 at 3:57 pm
It doesn’t need long term drift of values for any component (UV or visible)
If there is no long-term drift, then the UV data does not explain the long-term climate change, so perhaps we are in agreement on that.
Leif writes “If there is no long-term drift, then the UV data does not explain the long-term climate change, so perhaps we are in agreement on that.”
I am certainly not expecting the sun’s variability to be totally responsible for all climate change but I fully expect it to play a role and possibly a large one in the past. I’m not quite sure why you say the UV data doesn’t explain long-term climate change when its clear the ionisation proxy doesn’t reflect the true variability which was only recently discovered and even more recently it was discovered with direct measurement that the variability was even greater than expected.
Daily variability is great. There is a lot of scope for relatively subtle long term changes. And dont forget OHC changes only need heating in the few tenths of W/m2 range to be significant.