Rahmstorf et al (2012) Insist on Prolonging a Myth about El Niño and La Niña
Guest post by Bob Tisdale
Anthony Watts of WattsUpWithThat forwarded a link to a newly published peer-reviewed paper by Stefan Rahmstorf, Grant Foster (aka Tamino of the blog OpenMind) and Anny Cazenave. Thanks, Anthony. The title of the paper is Comparing climate projections to observations up to 2011. My Figure 1 is Figure 1 from Rahmostorf et al (2012).
The authors of the paper have elected to prolong on the often-portrayed myth about El Niño-Southern Oscillation (ENSO):
Global temperature data can be adjusted for solar variations, volcanic aerosols and ENSO using multivariate correlation analysis…
With respect to ENSO, that, of course, is nonsense.

Figure 1
The Rahmstorf et al (2012) text for Figure 1 reads:
Figure 1. Observed annual global temperature, unadjusted (pink) and adjusted for short-term variations due to solar variability, volcanoes and ENSO (red) as in Foster and Rahmstorf (2011). 12-months running averages are shown as well as linear trend lines, and compared to the scenarios of the IPCC (blue range and lines from the third assessment, green from the fourth assessment report). Projections are aligned in the graph so that they start (in 1990 and 2000, respectively) on the linear trend line of the (adjusted) observational data.
INITIAL NOTE
Under the heading of “2. Global temperature evolution”, in the first paragraph, Rahmstorf et al (2012) write:
To compare global temperature data to projections, we need to consider that IPCC projections do not attempt to predict the effect of solar variability, or specific sequences of either volcanic eruptions or El Niño events. Solar and volcanic forcing are routinely included only in ‘historic’ simulations for the past climate evolution but not for the future, while El Niño–Southern Oscillation (ENSO) is included as a stochastic process where the timing of specific warm or cool phases is random and averages out over the ensemble of projection models. Therefore, model-data comparisons either need to account for the short-term variability due to these natural factors as an added quasi-random uncertainty, or the specific short-term variability needs to be removed from the observational data before comparison. Since the latter approach allows a more stringent comparison it is adopted here.
In the first sentence in the above quote, Rahmstorf et al (2012) forgot to mention that the climate models used in the IPCC projections simulate ENSO so poorly that the authors of Guilyardi et al (2009) Understanding El Niño in Ocean-Atmosphere General Circulation Models: progress and challenges noted:
Because ENSO is the dominant mode of climate variability at interannual time scales, the lack of consistency in the model predictions of the response of ENSO to global warming currently limits our confidence in using these predictions to address adaptive societal concerns, such as regional impacts or extremes (Joseph and Nigam 2006; Power et al. 2006).
Refer to my post Guilyardi et al (2009) “Understanding El Niño in Ocean-Atmosphere General Circulation Models: progress and challenges”, which introduces that paper. That paper was discussed in much more detail in Chapter 5.8 Scientific Studies of the IPCC’s Climate Models Reveal How Poorly the Models Simulate ENSO Processes of my book Who Turned on the Heat?
THE MYTH CONTINUED
The second paragraph of Rahmstorf et al (2012) under that heading of “2. Global temperature evolution” reads:
Global temperature data can be adjusted for solar variations, volcanic aerosols and ENSO using multivariate correlation analysis (Foster and Rahmstorf 2011, Lean and Rind 2008, 2009, Schönwiese et al2010), since independent data series for these factors exist. We here use the data adjusted with the method exactly as described in Foster and Rahmstorf, but using data until the end of 2011. The contributions of all three factors to global temperature were estimated by linear correlation with the multivariate El Niño index for ENSO, aerosol optical thickness data for volcanic activity and total solar irradiance data for solar variability (optical thickness data for the year 2011 were not yet available, but since no major volcanic eruption occurred in 2011 we assumed zero volcanic forcing). These contributions were computed separately for each of the five available global (land and ocean) temperature data series (including both satellite and surface measurements) and subtracted. The five thus adjusted data sets were averaged in order to avoid any discussion of what is ‘the best’ data set; in any case the differences between the individual series are small (Foster and Rahmstorf 2011). We show this average as a 12-months running mean in figure 1, together with the unadjusted data (likewise as average over the five available data series). Comparing adjusted with unadjusted data shows how the adjustment largely removes e.g. the cold phase in 1992/1993 following the Pinatubo eruption, the exceptionally high 1998 temperature maximum related to the preceding extreme El Niño event, and La Niña-related cold in 2008 and 2011.
IT IS IMPOSSIBLE TO REMOVE THE EFFECTS OF ENSO IN THAT FASHION
Rahmstorf et al (2012) assume the effects of La Niñas on global surface temperatures are the proportional to the effects of El Niño events. They are not. Anyone who is capable of reading a graph can see and understand this.
But first: For 33% of the surface area of the global oceans, the East Pacific Ocean (90S-90N, 180-80W), it may be possible to remove much of the linear effects of ENSO from the sea surface temperature record, because the East Pacific Ocean mimics the ENSO index (NINO3.4 sea surface temperature anomalies). See Figure 2. But note how the East Pacific Ocean has not warmed significantly in 30+ years. A linear trend of 0.007 deg C/decade is basically flat.
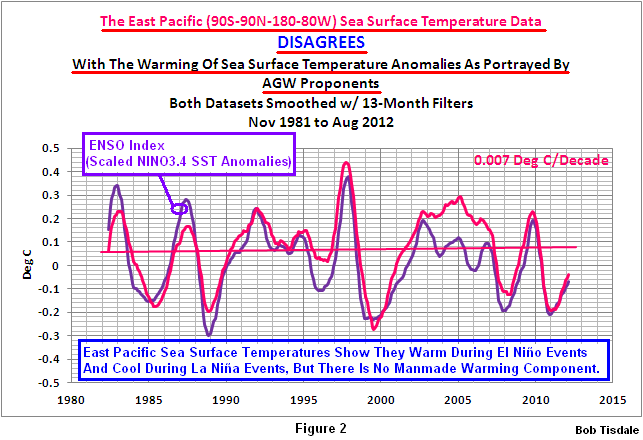
Figure 2
However, for the other 67% of the surface area of the global oceans, the Atlantic, Indian and West Pacific Oceans (90S-90N, 80W-180), which we’ll call the Rest of the World, the sea surface temperature anomalies do not mimic the ENSO index. We can see this by detrending the Rest-of-the-World data. Refer to Figure 3. Note how the Rest-of-the-World sea surface temperature anomalies diverge from the ENSO index during four periods. The two divergences highlighted in green are caused by the volcanic eruptions of El Chichon in 1982 and Mount Pinatubo in 1991. Rahmstorf et al (2012) are likely successful at removing most of the effects of those volcanic eruptions, using an aerosol optical depth dataset. But they have not accounted for and cannot account for the divergences highlighted in brown.

Figure 3
Those two divergences are referred to in Trenberth et al (2002) Evolution of El Nino–Southern Oscillation and global atmospheric surface temperatures” as ENSO residuals. Trenberth et al write:
Although it is possible to use regression to eliminate the linear portion of the global mean temperature signal associated with ENSO, the processes that contribute regionally to the global mean differ considerably, and the linear approach likely leaves an ENSO residual.
Again, the divergences in Figure 3 shown in brown are those ENSO residuals. They result because the naturally created warm water released from below the surface of the West Pacific Warm Pool by the El Niño events of 1986/87/88 and 1997/98 are not “consumed” by those El Niño events. In other words, there’s warm water left over from those El Niño events and that leftover warm water directly impacts the sea surface temperatures of the East Indian and West Pacific Oceans, preventing them from cooling during the trailing La Niñas. The leftover warm water, tending to initially accumulate in the South Pacific Convergence Zone (SPCZ) and in the Kuroshio-Oyashio Extension (KOE), also counteracts the indirect (teleconnection) impacts of the La Niña events on remote areas, like land surface temperatures and the sea surface temperatures of the North Atlantic. See the detrended sea surface temperature anomalies for the North Atlantic, Figure 4, which show the same ENSO-related divergences even though the North Atlantic data is isolated from the tropical Pacific Ocean and, therefore, not directly impacted by the ENSO events.
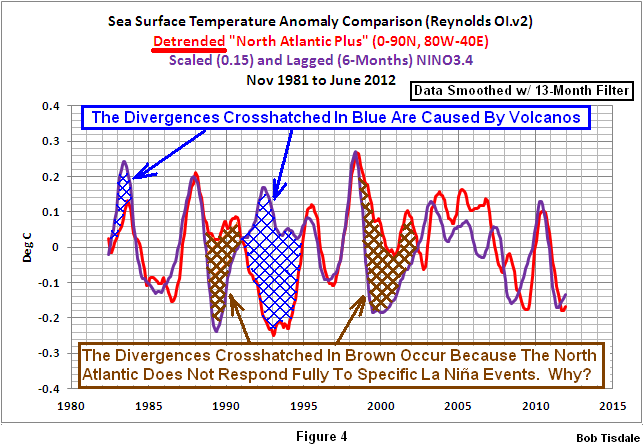
Figure 4
There’s something blatantly obvious in the graph of the detrended Rest-of-the-World sea surface temperature anomalies (Figure 3): If the Rest-of-the-World data responded proportionally during the 1988/89 and 1998-2001 La Niña events, the Rest-of-the-World data would appear similar to the East Pacific data (Figure 2) and would have no warming trend.
Because those divergences exist—that is, because the Rest-of-the-World data does not cool proportionally during those La Niña events—the Rest-of-the-World data acquires a warming trend, as shown in Figure 5. In other words, the warming trend, the appearance of upward shifts, is caused by the failure of the Rest-of-the-World sea surface temperature anomalies to cool proportionally during those La Niña events.
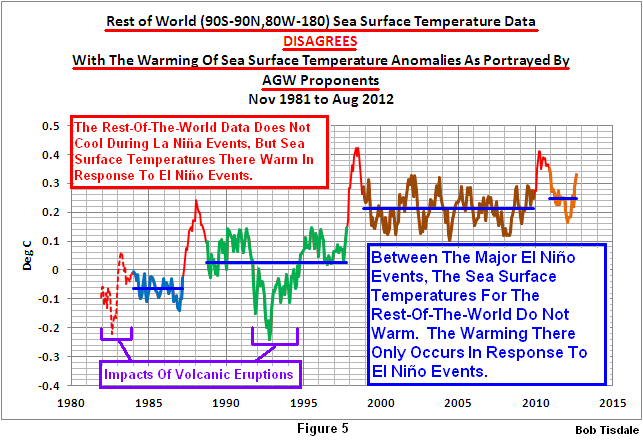
Figure 5
I find it difficult to believe that something so obvious is simply overlooked by climate scientists and those who peer review papers such as Rahmstorf (2012). Some readers might think the authors are intentionally being misleading.
FURTHER INFORMATION
The natural processes that cause the global oceans to warm were described in the Part 1 of YouTube video series “The Natural Warming of the Global Oceans”. It also describes and illustrates the impacts of ENSO on Ocean Heat Content for the tropical Pacific and the tropics as a whole.
Part 2 provides further explanation of the natural warming of the Ocean Heat Content and details the problems associated with Ocean Heat Content data in general. Part 2 should be viewed after Part 1.
And, of course, the natural processes that cause the oceans to warm were detailed with numerous datasets in my recently published ebook. It’s titled Who Turned on the Heat? with the subtitle The Unsuspected Global Warming Culprit, El Niño Southern Oscillation. It is intended for persons (with or without technical backgrounds) interested in learning about El Niño and La Niña events and in understanding the natural causes of the warming of our global oceans for the past 30 years. Because land surface air temperatures simply exaggerate the natural warming of the global oceans over annual and multidecadal time periods, the vast majority of the warming taking place on land is natural as well. The book is the product of years of research of the satellite-era sea surface temperature data that’s available to the public via the internet. It presents how the data accounts for its warming—and there are no indications the warming was caused by manmade greenhouse gases. None at all.
Who Turned on the Heat? was introduced in the blog post Everything You Every Wanted to Know about El Niño and La Niña… …Well Just about Everything. The Updated Free Preview includes the Table of Contents; the Introduction; the beginning of Section 1, with the cartoon-like illustrations; the discussion About the Cover; and the Closing. The book was updated recently to correct a few typos.
Please buy a copy. (Credit/Debit Card through PayPal. You do NOT need to open a PayPal account.). It’s only US$8.00.
CLOSING
Rahmstorf et al (2012) begin their Conclusions with:
In conclusion, the rise in CO2 concentration and global temperature has continued to closely match the projections over the past five years…
As discussed and illustrated above, ENSO is a process that cannot be removed simply from the global surface temperature record as Rahmstorf et al (2012) have attempted to do. The sea surface temperature records contradict the findings of Rahmstorf et al (2012). There is no evidence of a CO2-driven anthropogenic global warming component in the satellite-era sea surface temperature records. Each time climate scientists (and statisticians) attempt to continue this myth, they lose more and more…and more…credibility. Of course, that’s a choice they’ve clearly made.
And as long as papers such as Rahmstorf et al (2012) continue to pass through peer review and find publication, I will be more than happy to repeat my message about their blatantly obvious failings.
SOURCE
The Sea Surface Temperature anomaly data used in this post is available through the NOAA NOMADS website:
http://nomad1.ncep.noaa.gov/cgi-bin/pdisp_sst.sh
or:
http://nomad3.ncep.noaa.gov/cgi-bin/pdisp_sst.sh?lite=
=================================================================
Richard Tol is not impressed:
#Doha: Sea levels to rise by more than 1m by 2100 http://t.co/h2cNEMo7 Rahmstorff strikes again with his subpar statistics
http://twitter.com/RichardTol/status/273691430101323776
Thanks Bob. Lucia has already blown their statistics out of the water in various recent postings. How do these things get past ‘peer-review’?
so Bob – a formal rebuttal then? Only way to keep these dolts in check. No point blogging to the choir, it’s the journal editor and the readers we need to get to.
Another climastrology classic: When empirical data doesn’t match the model, adjust the data.
Rahmstorf can adjust temperature data to fit models but sea levels won’t cooperate. What will he do then?
Bob Tisdale says:
“Some readers might think the authors are intentionally being misleading.”
Bob Tidale, A.K.A. ‘Captain Obvious’
We’ve all been exposed to Bob’s theories on many many … many … occasions, and every time he is asked where the heat that is driving this inexporable ramping up of temperatures comes from, and he never answers, apart from “it’s all in my book – buy it and find out”.
Not good enough in my view.
REPLY: yet it is good enough for you to point to peer reviewed papers behind paywalls that cost 3-4 times as much. #lazycheapskate – Anthony
Louis Hooffstetter says: “Bob Tidale, A.K.A. ‘Captain Obvious’”
Sometimes it’s necessary to highlight the obvious.
Thanks, Anthony, for sending me the link and for cross posting this.
Regards from a chilly place where I can see snow from my windows. Brrrr. I think I need to take a trip to the tropical Pacific so I can study ENSO in person. I guess all I need is some government funding–like that’s gonna happen.
It helps to create a better impression of agreement with projections, or at least “consistent with” projections, by showing multiple IPCC projections. From the paper, “The IPCC temperature projections shown as solid lines here are produced using the six standard, illustrative SRES emissions scenarios discussed in the third and fourth IPCC reports.” Projections — and equally importantly, the uncertainty regions — for emissions scenarios which did not occur, can not be validly compared to the observed (or adjusted) temperatures.
I just went to the end to read the conclusion: “In conclusion, the rise in CO2 concentration and global temperature has continued to closely match the projections over the past five years…”
What a surprise. AGW is real and is happening now! Of course, anything that uses something that sounds as complicated as “multivariate correlation analysis” must be right.
Nicely explained Mr. Tisdale. Their (Rahmstorf/Foster) belief in AGW has become so profound though, they will not heed your science. Queue the screed rebuttal at the “Open Mind” in 3..2..1..
cui bono says:
November 28, 2012 at 6:12 am
Thanks Bob. Lucia has already blown their statistics out of the water in various recent postings. How do these things get past ‘peer-review’?
___________________________________________________________
Its hard to defeat Santa Claus and PAL REVIEW…
The quality of research, if as presented in recent publications, needs a wholesale firing of the culprits who waste valuable time on this junk science.
What ever……happened to “critical” thinking abilities?
Are we truly at the bottom of the barrel as far as talent goes?
It most certainly appears that way.
Steveta_uk says: “We’ve all been exposed to Bob’s theories on many many … many … occasions, and every time he is asked where the heat that is driving this inexporable ramping up of temperatures comes from, and he never answers…”
Actually I have explained it. Maybe you weren’t paying attention at the time. Let me quote from a post about the Foster and Rahmstorf paper that was also cross posted here at WUWT:
As I’ve noted in numerous posts, ENSO is also a process that redistributes the warm water that was leftover from the El Niño itself and enhances the redistribution of the warm water that resulted from the El Niño in waters outside of the eastern tropical Pacific. The redistribution carries that warm water poleward and into adjoining ocean basins during the La Niña that follows an El Niño. The impacts of this redistribution depend on the strength of the El Niño and the amount of water that was “left over”. Lesser El Niño events that are not followed by La Niña events obviously would not have the same impacts. There are no ENSO indices that can account for this redistribution and these differences.
La Niña events also recharge part of the warm water that was released during the El Niño. They accomplish this through an increase in downward shortwave radiation (visible light), and that results from the reduction in tropical Pacific cloud amount caused by the stronger trade winds of a La Niña. Sometimes La Niña events “overcharge” the tropical Pacific, inasmuch as they recharge more ocean heat in the tropical Pacific than was discharged during the El Niño that came before it. That was the case during the 1973/74/75/76 La Niña. Refer to Figure 2. Tropical Pacific Ocean Heat Content rose significantly during the 1973/94/75/76 La Niña, and that provided the initial “fuel” for the 1982/83 Super El Niño and the multi-year 1986/87/88 El Niño. The La Niña events that followed those El Niño only recharged a portion of the heat discharged by them. Tropical Pacific Ocean Heat Content declined until 1995. Then the 1995/96 La Niña event “overcharged” the Tropical Pacific Ocean Heat Content again and that provided the fuel for the 1997/98 “El Niño of the Century”.
http://bobtisdale.files.wordpress.com/2012/01/figure-2.png
The post referenced above is here:
http://bobtisdale.wordpress.com/2012/01/14/revised-post-on-foster-and-rahmstorf-2011/
Steveta_uk says: “…and he never answers, apart from “it’s all in my book – buy it and find out”.
Please link the post or blog comment in which I wrote, “it’s all in my book – buy it and find out”. I just Googled that quote and it appears once, only once, and it was not written by me. Are you sure I wrote? BTW: It costs you nothing to watch the videos I linked. I go into more detail in the explanation there.
Last, I don’t present theories. I present data.
“multivariate correlation analysis” is nothing new or special. It is a form of curve fitting. It can predict the past almost perfectly, and has no power to predict the future any better than tea leaves or a pair of dice when applied to complex systems.
Rahmstorf and Foster assume that climate is a simple system. They assume the factors they are studying are linear. If this is not a correct assumption, then “multivariate correlation analysis” will likely deliver a spurious a result. Where is the sensitivity analysis to determine if what they have found is robust or simply a product of misapplied mathematics?
What we have is first year mathematics applied to a complex system, to project the future. If this approach actually worked then computers would routinely predict stock market values in the future and climate scientists would have no need over government grants. They could simply use their computers to make billions, and use this money to pay people to not burn fossil fuels. I’d be just as happy to have Rahmstorf and Foster pay me to live somewhere warm and sunny rather than drive to work each day in the cold and dark we call the great white north.
Thanks, Bob, very good article.
It is good you do not get government grants, otherwise you would be corrupted into the group-think that drives (and benefits from) the grants.
REPLY: yet it is good enough for you to point to peer reviewed papers behind paywalls that cost 3-4 times as much. #lazycheapskate – Anthony
Huh? Who has pointed at peer reviewed papers behind paywalls?
“where the heat that is driving this inexporable ramping up of temperatures comes from, and he never answers”
He said it was not manmade CO2, as the step changes contradict the theory or steady warming due to CO2 rising. Others have proposed and demonstrated planatary orbital effects on the sun, and have proved their theory through prediction and confirmation. We are entering a cool phase now.
The real question is, why do you refuse to open your eyes to the evidence in front of you? Perhaps because you cannot prove thaat the planetary orbital effects wrong, so you whine over your failed CO2 hypothesis? It is not Bobs job to educate you, it is your job.
It seems you have more of a problem with the refs Foster and Rahmstorf 2011, Lean and Rind 2008, 2009, Schönwiese et al 2010, than the one you link to, since those are the refs that Rahmstorf use to support their claim, “Global temperature data can be adjusted for solar variations, volcanic aerosols and ENSO using multivariate correlation analysis”.
Shouldnt you be focusing on the start of the myth rather than slamming poor illiterate scientists who only consider the scientific literature and must be excused for their sin of not taking the blogosphere seriously?
Re:
Richard Tol is not impressed:
#Doha: Sea levels to rise by more than 1m by 2100 http://t.co/h2cNEMo7 Rahmstorff strikes again with his subpar statistics
On the other hand
“Put another way, in that scenario we would be looking at 5cm of sea level rise from Greenland by the year 2130: a paltry amount. …”
http://www.theregister.co.uk/2012/11/28/sea_levels_new_science_climate_change/
Commentary on latest GRACE data.
We know it can.
What SHOULD be adjusted is Figure 1. They forgot to mention that it is drawn to give naive readers the impression that El Nino events were being forecast from 1980, which is not true. This is just one more deceitful hind-cast.
At least those people claiming to forecast flu-season from weather-models are trying to do something useful (though we haven’t actually got a forecast out of them either).
“Perhaps because you cannot prove thaat the planetary orbital effects wrong, so you whine over your failed CO2 hypothesis?”
Again an attack on something I didn’t say have have never believed. How odd.
trafamadore says: “Shouldnt you be focusing on the start of the myth rather than slamming poor illiterate scientists who only consider the scientific literature and must be excused for their sin of not taking the blogosphere seriously?”
Somewhere along the line, possibly Jones in the 1989 book “The influence of ENSO on global temperatures” [not available online], a study used a statistical tool such as correlation or regression analysis to determine the linear relationship between an ENSO index and global temperature. With that factor and an appropriate time lag between the ENSO index and global surface temperatures, they then crossed a hurdle. They subtracted the scaled ENSO index from the global temperature data and claimed the difference was caused by manmade greenhouse gases. Since I haven’t read the Jones book, I don’t know if it was Jones who did it first.
Regardless, scientists and statisticians can never be excused for misrepresenting a process that causes global surface temperatures to warm over multiyear and multidecadal timescales.
In Figure 1 this paper attempts to convey the impression that they have been forecasting El Nino temperature events since 1980. This is, of course, untrue.
The duplicitous in climate science know they must give the impression of producing good predictions, or even projections. Hence this paper.
It appears to me that at least one editor or reviewer may have made a less than fulsome complement. Thus the sentence:
should be read twice. At least.
“Global temperature data can be adjusted….” Yes, we know it can. That is why this is not, never has been, and will never be a prediction, whatever impression the authors may wish to convey to the unwary reader.
(ps mods, if I post on the test page does it now get treated as spam if I post it again?)
Steveta_UK Don’t feed the troll?
Thanks Bob Still reading your book,great explanations love the graphs, you have communication skills sir, maybe the ,”It a failure to communicate” team should consider consulting you. After all their past techniques are a fail. Tamino is still using the old playbook , no brains, baffle ’em with bureaucrat speak.Peer review is looking more like pier review every year, as in a long walk off…
Since all this stuff is based on uncalibrated and uncalibratable assumptions and as pointed out a general ignorance, I suspect the entire process of peer review should also be called once again into questions. The methods these people use are only applicable to static processes and then only when long time factors are not applicable. I suspect climate is very much like human populations. We tend to make gross average assumptions all the time. The almost always are less then meaningful since the true “average man” simply does not exist.
Steveta_uk says:
November 28, 2012 at 6:17 am
We’ve all been exposed to Bob’s theories on many many … many … occasions, and every time he is asked where the heat that is driving this inexporable ramping up of temperatures comes from, and he never answers, apart from “it’s all in my book – buy it and find out”.
Not good enough in my view.
Your view is clearly somewhat foggy, I guess. How about you provide some science to prove that you mate and chief adjuster Rahmsdorf is correct? Oh, Sorry, that’s a request too far for your inadequate hypothoses.
Let me see if I understand this. We’re supposed to ignore the GISS, HADCRUT, and UAH temperature data sets that show no warming since 1998, and instead believe the paper’s “adjusted” data that shows the temps and CO2 happily marching in lockstep? Otherwise how can one explain their conclusion, “…the rise in CO2 concentration and global temperature has continued to closely match the projections over the past five years…”?
michael hart says: “In Figure 1 this paper attempts to convey the impression that they have been forecasting El Nino temperature events since 1980. This is, of course, untrue.”
I am sorry, I dont get that from the Fig at all. It looks to me like in 1980 the observations start. And the linear trend is not a prediction for that decade either, it’s based on observations. So could you pls explain what you mean by “forecasting”, cuz I really don’t get what you are saying.
Bob said:
“I guess all I need is some government funding–like that’s gonna happen.”
But according to those who “know” black is white, up is down, cold is warm, wet is dry…
So anything is possible in this world of today. 😉
Bob is correct it is impossible to remove ENSO from global temperatures, nobody has correctly.
First thing your calculation must show involves making the 1998 El Nino peak flat, but to do this just adds on to a later time period (not removed correctly here either). This is the evidence that ENSO is part of the later period too and therefore can’t be removed, highlighted by Bob because it surfaces elsewhere away from the ENSO region. The El Nino in 2010 is hardly removed at all so a general calculation that fails between different El Nino’s. This paper is wrong and only the political agenda let these papers through. That’s the difference between statisticians and science in this case, with the latter not understanding the process.
My post above should be “—,with the latter understanding the process much better.”
Good stuff again Bob. It is typical that these types spend their time creating hypothetical temperature projections, just so that they can show an increasing trend. If they are so good at adjusting the effects of solar variations and ENSO out of models, why don’t they build these marvellous figures into the models and show how good the the models are at matching real world observations? Of course, that doesn’t work and wouldn’t show an upward trend.
The problem here is with peer review. Think about it:
-classmates grading each others’ papers; no prof in sight.
-asylum inmates diagnosing and prescribing for each other; no doc in sight.
-the latest shipment of parts from China evaluated by comparison to each other; no external standard in sight.
Competent and intelligent and ingenuous people like Bob T. and Steve McIntyre don’t get chosen as reviewers of “climate science” because they are NOT peers, they are SUPERIORS!
Thanks for the SUPERIOR review, Bob (and Anthony)!
“Peer Review” = “Pal Review,” nuff said.
What a fraud this Rahmsdorf is!
They’ve been saying for years it’s NOTHING to do with the sun, now they adjusting for TSI !
Tacitly admitting that the models totally fail to model the major climate variations, they now make post hoc adjustments TO THE DATA to make it fit the models.
Final last trick ™ use a nice light pink for what’s now the rigged data put lots of stuff behind it and hope no one notices that even after the massaging it’s still does not match , even for 11 years.
This is a work worthy Micky Mann.
So after all the tricks, what part of the model is it which has been show to work ?
You see, the world is really cooling, but if we adjust the data for the fact it is cooling it (nearly) warms just like we said all along that it would. Projections are spot on and if we carry on adjusting real temperatures like this the everything in our fairyland world will be so hot it will die.
WE MUST ACT NOW. Say no to global data warming before it’s too late.
Climate Tipping Point:
A specially designated bin on every campus where this kind of RUBBISH can be dumped and the paper recycled.
This is usually kept away form other buildings because it stinks !!
“Steveta_uk says:
November 28, 2012 at 8:02 am
“Perhaps because you cannot prove thaat the planetary orbital effects wrong, so you whine over your failed CO2 hypothesis?”
Again an attack on something I didn’t say have have never believed. How odd.”
All that sniping, obfuscating, refusal to answer questions posted, selective irrelevant blathering and making inane, irrelevant commentary may appear to you to be demonstrating something of importance. From my purview, it exposes a sad little person trying desperately to being “right”. It comes across as something really sad. Why not just accept the fact that you are heading down the wrong path, instead of trying to demonstrate how ignorance and bias has overclouded your thinking processes. Better still, as much as I view your comments as comedy, surely there are other sites on the web who may actually appreciate your endless examples of childish comedic behaviour, I am certain this is not one of them.
trafamadore says:
November 28, 2012 at 7:36 am
>>
It seems you have more of a problem with the refs Foster and Rahmstorf 2011, Lean and Rind 2008, 2009, Schönwiese et al 2010, than the one you link to, since those are the refs that Rahmstorf use to support their claim
>>
No. The authors chose the papers they use. That means they (presumably) read them, find the method to be sound and endorse them by accepting the results and building on it.
No one forces them , they are totally responsible for what they chose to accept and adopt.
Don’t know much about the Rahmsdorf’s expertise, but his accessory Grant Foster is a climate science dupe. When I posted this on RC
http://www.vukcevic.talktalk.net/CET-Jun.htm
to point to the 350 years of no temperature rise, he concluded that I fabricated data . When he was put right by his host, this dubious so called expert Foster resorted to spitting vulgarities, forcing mightily embarrassed Gavin (of RC) to delete number of his posts.
Bob Tisdale says: “Regardless, scientists and statisticians can never be excused for misrepresenting a process that causes global surface temperatures to warm over multiyear and multidecadal timescales.”
So, if you were to recalculate/revise the red line in Fig 1 of the Rahmstorf paper, what would it look like? Isnt that the bottom line? I see your ocean surface analysis, but I dont see how that would figure in the Rahnstorf analysis, which considers more “places” (for lack of a better word at the moment).
The second thing is (cuz I have scanned you contribution a number of times and I hate to say it but) I really cant find where you have clearly articulated “the myth” in a single sentence, it must be in there somewhere. Please help. (Or someone else.)
Well, Steveta_UK, Tisdale has answered your complaint, and quite obligingly. Will you not acknowlege it? Perhaps you intend to ignore it.
Chuck L says: “Peer Review” = “Pal Review”
If you pls, could you suggest that to Nature or Science? It would be very helpful, I think, and people wouldnt haf to waste all this time resubmitting stuff.
Back to basics with Karl Popper:
http://guscost.com/2012/11/28/global-whining/
Camburn says:
November 28, 2012 at 6:41 am
The quality of research, if as presented in recent publications, needs a wholesale firing of the culprits who waste valuable time on this junk science.
What ever……happened to “critical” thinking abilities?
Are we truly at the bottom of the barrel as far as talent goes?
______________________________________________
Yes I am afraid so.
I have become more and more convinced the average voter doesn’t have the brains or even the curiosity to checkout Bob’s great vids or Anthony’s great website. The mediocrity of current science not to mention the fraud is appalling and it did not spring from nowhere. We blame ‘Post Normal Science.’ Here are the origins.
That is not the worst of it. Schools bore bright kids silly and then drug them when they fidget or act up. Children as young as first grade are labeled ADHD and routinely put on drugs by the school’s tame doctor. No parent needed. Parents have even been threatened by the schools with ‘Child Abuse’ charges and having the child removed by social services if they try to take their child of the medication.
Gifted children and adults are at high risk for being identified as ADD.
A peer reviewed paper:
The Real Suicide Data from the TADS Study Comes to Light
ADHD: Ritalin – Brain damage, heart attacks, hallucinations & liver damage
The Drugging of Our Children
Death from Ritalin
Bob Makes observations which make perfect sense in an engineering sort of way, then suggests a plausible mechanism but get called names.
Why not suggest why the mechanism is wrong or a different mechanism that explains the observations which logically cannot be caused by CO2, though they may help to cause CO2.
DaveE.
It seems most have missed a significant paradigm shift here. It used to be CO2 was THE driving force to global temperatures. Now Rahmsdorf et al by removing ENSO, solar variations etc in order to make the data fit have implicitly admitted that OTHER factors like solar variation, ENSO etc are more of a factor on global temps than CO2. I see this as a major win even if the overall article is bunkum.
If you detrend their detrending by examining more than the last 30 years, it cuts their warming trend by about 60%. See http://wattsupwiththat.com/2012/10/17/new-paper-cuts-recent-anthropogenic-warming-trend-in-half/
If this exercise in curve fitting can be extrapolated, the temperature arrest of the last 15 years ought to be continued for another decade or two. That ought to put a knot in the warmista’s undies.
In general, I find Rahmstorf’s rigor to be lacking.
Please consider…
http://climatesanity.wordpress.com/2012/11/11/rahmstorf-2011-robust-or-just-busted-part-6-holgates-sea-level-data/
or
http://climatesanity.wordpress.com/2012/09/29/rahmstorf-2011-robust-or-just-busted-part-5-why-a-paper-about-robustness/
So, let me get this straight…
After the publishing of the MBH98 graph, the warmists were hyping that 1998 was “…likely the warmest year in a millennium.” It epitomised the hype that was cAGW.
Now, since they are having a hard time accepting that there has been no effective increase since 1998 (in spite of various attempts to manipulate the data), they wish to try to make the 1998 peak ‘disappear’ behind an avalanche of ‘adjustment criteria’. Any suggestion of an accelerated rise in temperature has been forgotten. The Emperor is truly naked and his advisors are desperate.
How much lower will ‘climate science’ sink?
Why does this get peer reviewed ?
Is there quality control at PIK in Potsdam ?
Does Tempo Analytics support activities of their employee Grant Foster ?
Why do main stream media report this at all ?
I had a completely different response to what was quoted from the new paper.
I looked at what was said and the Figure 1 graph and concluded that since the IPCC projections do not include all the items that the paper claims to have removed from the observational data, then the IPCC projections, if accurate, are not projecting real temperatures. You can see that clearly in the graph – the projections are all higher than current temperatures. Therefore, even if we assume that the projections are correct, they don’t reflect what the temperature will be.
So anytime someone quotes the the IPCC projections for what temperatures will be in 2100, we can point to this paper and say that this paper states, quite clearly, that the projections will not be for observed temperatures because they don’t include all the factors.
The response to that will be that over time the other factors will average to zero, but I’d like to see a paper that demonstrates that. Until then, that’s only an unproven assumption.
trafamadore says: “So, if you were to recalculate/revise the red line in Fig 1 of the Rahmstorf paper, what would it look like? Isnt that the bottom line?”
No. You apparently missed something. Rahmstorf et al assume CO2 warmed the oceans, but there’s no anthropogenic global warming component in the sea surface temperature data for the past 30 years.
Matt G says @ November 28, 2012 at 9:25 am
…That’s the difference between statisticians and science in this case, with the latter not understanding the process.
___________________________
Please do not say that. A true scientist has at least enough statistics background so he understands the basics and knows when he is over his head so he can go get help from a trained statistician. CRU’s Dr. Phil Jones, world renowned climatologist, can’t even plot a trend in Excel!
I do not have a PhD or computer training and taught myself to use Excel as soon as they let me have a computer in the lab. For these people to be in charge of global temp data and climate models is surely ‘a travesty’ They are in Universities for crying out loud. They should be knee deep in statisticians and stat courses should be readily available.
They have absolutely no excuse for their demonstrated poor statistics.
With respect I disagree with Bob.
As an AGW proponent I do not recognize either figures 2 or 3 describing how I portray warming of sea surface temperatures, even though they are labelled as such.
The Foster and Rahmstorf analysis, which I agree with, is looking at the impact of ENSO on global temperature, including land, not the impact of ENSO on 66% of the oceans (the area designated rest of world in the post above) which is less than 50% of the earth’s surface.
The claim FR (and also me and others) make is that ENSO adds noise onto global temperature (the transitory 1998 spike for example) and so it would be useful to attempt to adjust this out and see what remains. Same with the solar cycle. To not do so requires just as much assumption that there is no ENSO or solar cycle noise in the data. If anything I think that’s a bigger assumption.
I live in the UK where the AGW agenda is not only political reality, but our fuel bills, our holidays and our taxes are all subjected to the monetary surcharges, all based on the AGW nonsense.
I noticed a reader from the Federal Energy Regulatory Commission, Washington, District of Columbia, United States
Well Sir/Madam it is my hope you are a person of some influence. If so I would like to bring this to your attention:
http://www.vukcevic.talktalk.net/MidSummer-MidWinter.htm
as you can see there is no excessive warming in the summer months, green and lush England is not going to turn into Sahara desert.
You will also notice there is a modest but steady warming in the winter. This is extremely beneficial, not only to elderly for whom cold is a killer, but to general prosperity since less work days are lost to bad weather, outdoor building industry benefits greatly, and finally it supports green agenda, less fuel used for heating, more oil and coal left in the ground for future generations.
In my simple view, global warming such as it is, it was and is it is very beneficial to the economy and society in general. Worth another look
http://www.vukcevic.talktalk.net/MidSummer-MidWinter.htm
Summers now as the 3 centuries ago, winters now warmer than the 3 centuries ago.
Gail Combs says:
November 28, 2012 at 11:47 am
I didn’t mean that quote, changed it a moment later when I released my mistake. (see my post after)
S Green says:
November 28, 2012 at 11:53 am
IOW, when the data do not fit the models, adjust the data.
How do you know what is signal, and what is “noise”? Answer: you don’t. You are putting forward the thesis that, if you can imagine a way in which something can occur, then the burden is on those who disagree to prove you wrong. That is completely bass-ackwards to science.
On another note, as a general comment to all, besides all the other guff, the error bars on these projections are so large as to be useless. You could fall within them a great majority of the time assuming purely random increments of change.
S Green says:
November 28, 2012 at 11:53 am
So you don’t understand how energy is stored in the Western Pacific Warm Pool during a La Niño and then released during an El Niño to the Eastern Pacific from whence it is smeared over the Indian & North Western Pacific in the following La Niña, but you understand the F&R paper?
By adjusting this out you are cheating. You are removing energy from the system which has been stored for a time and is now released into the wider system. Think of it as Earths KERS system! 😛
DaveE.
The warmists mantra of continuing rising temperatures lies in Fig. 1 for all to see. The “good” fit with IPCC/Hansen scenarios is dependent on the period of 2003 – 2012 in two ways:
1) adjustments for ENSO etc. being appropriate, and 2) the period is not showing us a quasi-sinusoidal (polynomial/curvy) “top” to a stalling or halting warming. Even if only the 2008-2012 adjustments are deemed partly invalid, the actual trend of observation falls to the bottom of the scenarios. Any further readjustments (as for UHIE) brings the IPCC narrative to its knees.
In the short-term, there is a 5 or 6 year up and one down cylce that is pretty clear; we had the “up”from 2008, and we should expect a “down”, in 2013, or perhaps 2014. Beyond 2015, there should be a recovery, and this is crucial for the warmists: if the recovery does not shoot up to the 0.42C* level in 2015/2016, then the trend for 2003 onward has to be dropped out of the IPCC scenario range. An unadjusted temp of <0.3C in 2015/2016 kills the continued warming story. Considering the importance of the Arctic in pushing global temperatures up, all we need to see is a colder than recent summer or two above the 66th parallel to do this.
I look forward to the next two years. I'm concerned that the "adjustments" continue to be made while the mainstream doesn't see to recognize that the alleged warming of 0.8C is all in the adjustments. Fig. 1 here reveals just how precarious the warmists' hold on the IPCC/Hansen scenarios is.
S Green:
I quote all your post at November 28, 2012 at 11:53 am so it cannot be thought that I am replying out of context. You say
I respectfully submit that you are missing two basic – and very important – points.
Firstly, in any proper science when an understanding is shown to be wrong by failure of a prediction then the understanding is revisited. But in ‘climate science’ that is not done
In ‘climate science’ when an understanding is shown to be wrong by failure of a prediction then it is common practice to make post hoc adjustments to the prediction. The FR paper is a clear example of such a post hoc adjustment.
The IPCC AR4 predicted (n.b. predicted and NOT projected) “committed warming” of 0.2 deg.C/decade global warming averaged over the first two decades after year 2000. This “committed warming” was inevitable because of GHG’s already in the system. But there has been no discernible warming since 2000, indeed no discernible warming since 1997.
That is a clear failure of the prediction. The predicted average trend is 0.2 deg.C per decade between 2000 and 2020 but there has been no warming since 2000, so the needed warming to fulfill the prediction is over 0.8 deg.C over the next 8 years. OK, hypothetically there could be a rise of 0.8 deg.C over the next 8 years but that is so improbable as to be risible: the total warming over the twentieth century was not that much. And if such rapid warming happened then there would still be the problem of explaining where the “committed warming” has been hiding over the last 12 years.
The FR paper is an attempt to show that the “committed warming” has been hidden by other effects. That is a clear attempt to make a post hoc adjustment to the prediction as an excuse for the failure of the understanding which predicted the “committed warming” instead of revisiting the understanding.
Secondly, the excuse is self-defeating. If natural forces have overwhelmed the “committed warming” then those same natural forces may have cause the warming of the twentieth century. Therefore, far from supporting the AGW-hypothesis, it removes any need for that hypothesis.
In other words, the understanding summarised in the AGW-hypothesis requires revisiting. And the FR paper – whatever its merits – is unwitting evidence that the understanding needs to be revisited.
Richard
Let me see if I understand this paper. IPCC projections have not been able to accurately predict the global temps. So, this paper attempts to remove the ENSO, volcanic, and solar variations from the recent temps to prove that the IPCC was actually right. So they use a multivariate analysis and then a linear regressive analysis looking for correlation. I didn’t see the correlation coefficients stated but even if they were fairly robust… Questions:
1) I am not familiar with multivariate analysis but I do understand linear regressive analysis and I doubt its going to be very accurate as the combined forcings would have to be linear. Can anyone explain why I would be wrong?
2) How accurate can the input data be? How well can we measure and calculate the global forcing of the solar activity and ENSO (Bob covered this)?
3) Do the IPCC projections really omit ENSO, volcanoes, and solar?
4) This paper really seems like an attempt at making an argument against skeptics instead of trying to advance science, anybody else see it this way?
That shade of “don’t look at me pink” is simply ridiculous. I’ve tried a few times to flip to the AGW side, and stuff like that is just a killer.
S Green says:
November 28, 2012 at 11:53 am
With respect I disagree with Bob.
Only a crimatologist would think it ‘OK’ to adjust out features they don’t like. I have said this more times than I can remember ‘ You never, never, never adjust raw data’. It is a crime to tamper with raw data and you should be ashamed to have even suggested it.
What am I ? A fully qualified engineer in Radio, electronics, electricity and telecommunications and an ex-chartered physicist. Adjusting data for any reason is totally unacceptable UNLESS you have well defined, unequivable proof and mathematical reasons for so doing.
The Warmists love indulging in sophistry. And with regard to ocean temperatures their argument is particularly threadbare.
It’s an absolute fact that Ice is an insulating material, and you only have to look at a weather map to see that the area of open ocean in the Arctic is losing heat to the atmosphere…but hang about, the atmosphere is demonstrating a distinct ‘lack of warming’…
Couldn’t they just try and me a bit consistent?
trafamadore says: “So, if you were to recalculate/revise the red line in Fig 1 of the Rahmstorf paper, what would it look like? Isnt that the bottom line?”
Bob Tisdale says: “No. You apparently missed something. Rahmstorf et al assume CO2 warmed the oceans, but there’s no anthropogenic global warming component in the sea surface temperature data for the past 30 years.”
Yes. I _did_ apparently miss something. I went and read the Rahmstorf paper and I found it perfectly understandable even though I am not a climate specialist (I am used to technical papers, but I dont think it matters, the paper was written very simply). But I seem to have severe trouble understanding the logic of your post. Sorry.
Okay. So pick one or more:
-> The ocean is not warming (and reports like Kennedy et al 2011 are just wrong)(but the oceans rising is then a mystery, what with not enuf water being added just yet.)
-> The ocean is warming by natural causes that just by chance matches the GW on land. (Is this the basis for your myth, that scientists think the ocean is warming due to CO2 like on land but you think that the warming is dues to natural oscillations?)(If so, one does not preclude the other, right?)
-> I still have the choices wrong and fail miserably at reading blog posts.
-> Add a choice, but speak simply.
Global temperature data can be adjusted for solar variations, volcanic aerosols and ENSO using multivariate correlation analysis
How does this jibe with Santer’s 17 years? Are they also based on adjustments or are they based on what actually happens? Will these people and Santer come up with a unified statement when we reach the 17 year mark with no warmth?
P. Solar says:
November 28, 2012 at 9:36 am (Edit)
What a fraud this Rahmsdorf is!
They’ve been saying for years it’s NOTHING to do with the sun, now they adjusting for TSI !
Tacitly admitting that the models totally fail to model the major climate variations, they now make post hoc adjustments TO THE DATA to make it fit the models.
##################
On the contrary nobody who believes in AGW thinks the sun has no effect.
The effect of the sun is represent by TSI.
The problem is this. Lets take Ar4. The models are run with historical forcing. That means certain values for TSI, values for methane, C02, aersols. etc. AND during the forecast period
the models are run with “projected forcings”. Scenarios, What if? sensitivity studies.
To do this the modelers assume that certain values will stay constant and they vary other values.
For Ar3 and AR4 solar input was held constant out to the future. With Ar4 that means they assumed higher solar forcing than actually happened. For volcanoes they assumed no volcanic forcing.
Let’s do a simple example. Suppose, I write a model to predict how far a golf ball will travel if it is hit by a club going 120 mph at impact. Pretty simple physics. I set up my assumptions.
clubhead speed = 120mph, windspeed = 0, standard atmosphere, altitude sea level,
ball size ect, drag, blah, blah blah.
And I predict that the ball will carry 290.45 yards. GIVEN the assumptions are met. that is GIVEN the test goes off as planned.
Now I run a field test and collect observations to test my model. I do 10 hits, but, its hard to control the speed of the club, so actually, my tests happened at 116 to 118 mph.
And, the windspeed wasnt zero for every shot, there was a faint .5 meter per second breeze in my face. and so forth. Its not a lab, I cannot control the conditions. I can get close, but for testing 120mph, I actullay ended up testing 117, lets say.
My test results have a ball landing distance of 287 yards.
What do I do?
1. retest until I can absolutely control all the conditions ( hehe, right )
2. Rerun my model with the ACTUAL parameters.
3. Account for the differences by adjusting the observations, removing noise, outliers etc
4. Invoke popper and claim that the model is wrong and newtons laws of gravity
which the model relies on are suddenly disproven.
Err. [snip. You know better than that. ~ mod.] will do 4.
Most of the time you will do #2, or #1 IFF it is feasible and cost effective
But if you cant do 1 ( we cant control the sun) and if you cant do 2 ( run the model over )
Then the only thing you can do is 3.
3 is ugly. 3 is hard. 3 is prone to confirmation bias because you tend to only correct those things that go in your favor to bring results inline with predictions, but option 3 is sometime the only thing you can do for the present time. its a band aid.
What they need to do is run the old models OVER with the actual forcings as observed. This would mean.
A) they would have to “freeze” models and keep “frozen” versions available for retest.
B) allocate a computer resources to do this.
Gail Combs says:
… CRU’s Dr. Phil Jones, world renowned climatologist, can’t even plot a trend in Excel!
Gail, there is a saying that circulates around the internet regarding spreadsheets and statistics, “don’t!” Run a search on “friends don’t let friends use Excel/spreadsheets” for statistics. You’ll find entries such as:
http://www.statisticalengineering.com/Weibull/excel.html
Personally, I quit using Excel the first time it offered a negative number for a variance. I downloaded R and started seriously trying to learn its syntax. To be fair all spreadsheets have similar weaknesses and at present Excel is no worse than others. It used to be one of the very worst though and given it’s odd history could become so again at any time.
Mosh.
I really must go through my back e-mails.
My late friend and I, (mainly Jan, he was the brains, I was the intuitive suggestions,) devised a model using electronic analogues which simulated c20th temperature increase using TSI from Leifs own data.
No need for any GHG forcing at all.
DaveE.
5. We’ve missed something, like perhaps the weight of the club head or maybe something we don’t even know about. Maybe we just don’t know.
What I do know is someone’s got to Mosh.
DaveE.
[Reply: already snipped. ~ mod.]
Steven Mosher says:
November 28, 2012 at 2:39 pm
You naughty man, you snuck in the “d” word. That’ll have your warmist friends licking honey from your navel no doubt.
Yes, the whole AGW versus AGW-skeptic debate will boil down to an inductive versus deductive show-down. Your representation of Popper is incorrect.
The philosopher of science Carl Popper argued for science to be deductive, based on economic interpretation of measured facts, which can readily be experimentally falsified. However the age of cheap computing power has caused researchers to fall into the alluring trap of inductive “science”, in which assumptions and hypotheses are built up on eachother like a house of cards.
I looked at some dictionary definitions and other reference sources about these two words, inductive and deductive, since their meanings might be slipping and blurring. There was an interesting visual thesaurus linking words in a map of proximity and connectivity. Inductive was linked to synthetic and synthesis while deductive was linked to analysis and analytic. I like to think of it in terms of the length of the paths that one draws between observation and conclusion. Short and economic (“parsimonious”) = deductive; long and convoluted involving multiple serial assumptions = inductive.
Two teams of scientists, team inductive and team deductive, were given a task: design a speedometer for a car – a device for measuring and displaying the speed that a car is travelling.
So team inductive got to work. This team included a fair number of physicists with computational and modelling skills. It became immediately clear to them that this was a task requiring the procesing of multiple factors all impacting on speed: what was the energy and force driving the car forward, what was the origin of this energy? Chemical and thermodynamic energy from the combustion of fuel needed to be carefully evaluated and modelled. What was the efficiency of this conversion from chemical to kinetic energy – how much was lost in the inefficiency of the motor? Several team members were assigned to modelling these processes. How much energy was lost as friction and heat through the gas exhaust? Simulation of the turbulent fluid flow and associated heat fluxes along the exhaust pipe was clearly called for.
Then of course there were hours of immense fun to be had modelling and evaluating the fluid friction of the air passing over the car. This of course was modified by the dynamics of the air itself – what was the prevailing wind direction? Then of course there was the friction between the tyre and the road. An important input here was the curvature of path of the travelling car and associated sideways force and geometric distortion of the tyre, adding heat to the tyre affecting its friction, and whether or not this induced tyre to road shear and slippage, each in turn calling for further modelling inputs. Of course tyre dynamics were temperature-related so local climate was again a critical factor and another useful variable.
So it became clear to team inductive that to have any hope whatsoever of measuring speed in a credible way, to give an output that would be accepted by internationally recogonised car speed scientists associated with the high profile journals and societies, that a large number of data inputs were needed: chemical measurement probes in the fuel tank to asses the fuel chemical potential energy; probes within the ignition chamber to assess on a millisecond basis pressures and temperatures to illucidate combustion energy. Then multiple sensors were required in the exhaust pipe to provide input for fluid flow modelling of the exhaust gasses. Sensors were also required at many locations on the car’s surface to assess airflow and boundary layer turbulence, as the exact location of the laminar-turbulent transition was a key factor in getting the drag models to work reliably. Sensors were needed within the tyres also. Other factors and associated sensor inputs were also identified and subject to in-depth research and computer simulation.
Then team deductive got to work. They measured the circumference of the wheels. And set up a sensor to measure the rate of rotation of the wheels. From this they got a speedometer.
trafamadore says: “The ocean is warming by natural causes that just by chance matches the GW on land.”
Your choice here is pretty close to reality, but it’s wrong.
The oceans warm naturally. That is, there is no apparent anthropogenic global warming component in the warming of the oceans. Land surface air temperatures simply mimic and exaggerate the warming oceans. If there is a measureable CO2-driven anthropogenic component in the warming of global land surface air temperatures, it’s on top of the response to the natural warming of the oceans, but it also shares the warming responsibilities with other forcings and factors, like land-use change, black soot on snow, poorly sited surface stations, overly zealous corrections to temperature records, etc.
Sorry. I’ve discussed this in numerous blog posts and videos, but I didn’t mention it this time. The reason: it basically wasn’t necessary. This was a discussion of the failings of the methods Rahmstorf et al used in their attempt to remove ENSO from the surface temperature record. This post showed very basically why they couldn’t do it.
Werner Brozek says:
“How does this jibe with Santer’s 17 years? Are they also based on adjustments or are they based on what actually happens? Will these people and Santer come up with a unified statement when we reach the 17 year mark with no warmth?”
We both know what will happen: at 17 years they will move the goal posts.
Mosh, if the models weren’t continually changed, then your proposed actions would make sense, however the models being used today are continually modified trying to backfit parameters that suddenly appear as, gasp, part of the nature of the climate. Low clouds, high clouds, aerosols, water particle sizes, vulcanism, the list goes on. You continue to pretend that the code being executed is unchanged, with only parametric changes, and we both know that isn’t the case. There have repeatedly been massive rewrites of the code, and not only to add additional parameters, but to eliminate bugs that have been there, hmm how long? You and I both know that the paleo-computations are still limited in their resolution, and couldn’t predict the worldwide weather for a month out, let alone for a year. You could even have the certain knowledge of the boundary conditions (now) and predict from now to 1 year from now – we both know how well that will work. Since climate is weather over time, don’t you think that in all honesty, the inability to predict the weather makes predicting the climate a “little” suspect. It’s even more suspect when people go to great lengths to claim that the world wasn’t ever this warm. Wheat grew in Greenland. Steve, it takes 110 frost free days for wheat to germinate and ripen. Or maybe you believe the Vikings had Russian Winter Red. They raised wheat and grapes in Greenland for years.
So tell me, when with the electrical fields within the atmosphere be included in the predictions? What effects do electrical discharges like the Aurora Borealis have on stratospheric clouds? Can sprite discharges modify the path of the jet streams? What about the low frequency resonances in the ionosphere, what is their contribution? Are these second order, third order effects? Who’s studied it?
There is so much we don’t know about our world, and the hubris of those who think they know it all, then hack the data to make it fit their views is unbelievable.
Don’t bother to give one of your typical cryptic, content free answers. JP and the gang will eat it up.
S Green says: “As an AGW proponent I do not recognize either figures 2 or 3 describing how I portray warming of sea surface temperatures, even though they are labelled as such.”
Figure 2 represents the sea surface temperature of the East Pacific Ocean from pole to pole, and from the dateline to the Isthmus of Panama, using the NOAA Reynolds OI.v2 dataset. It’s the best sea surface temperature dataset available. In fact, it’s been called the “truth.” The coordinates used are 90S-90N, 180-80W. The sea surface temperature anomalies of the East Pacific have not warmed in 30 years. That’s reality.
Figure 3 represents the sea surface temperature anomalies of the Rest of the World, 90S-90N, 80W-180, with the trend removed. Same dataset. It shows the sea surface temperatures for the Rest of the World diverging from the ENSO index during the 1988/89 and 1998-01 La Niña events. Because those divergences exist, and because they are ENSO related, Rahmstorf et al and similar papers do not account for the impact of those divergences on the warming of the Rest of the World data when they attempt to remove ENSO from the surface temperature records. Hence, their claim that the warming is caused CO2 is blatantly and obviously wrong.
S Green says: “The claim FR (and also me and others) make is that ENSO adds noise onto global temperature (the transitory 1998 spike for example) and so it would be useful to attempt to adjust this out and see what remains.”
Your claims and assumptions are obviously and fatally flawed. Figure 3 illustrates the reason. ENSO is a process that creates and releases heat naturally. The divergences result from warm water that’s left over from the 1986/87/88 and 1997/98 El Niño events. There is no ENSO index that can account for that warm water.
It’s pretty obvious. I can’t understand why that’s so difficult to recognize, S Green.
Steven Mosher’s misunderstanding of climate models
Tide gauges say sea level rise is just 1.6 mms/year.
When they fix the glacial isostatic adjustments applied to the satellite sea level estimates, the rise from the satellite measurments will also be lowered to 1.6 mms/year.
There is no acceleration in these numbers either. There is some variability each year but the longer-medium-term trend is only 1.6 mms/year.
There are 88 years left before the year 2100. 88 years times 1.6 = 14 cms = 5.6 inches and does not equal 1.0 metre.
Sea level rise is faster than predicted = Rahmstorf’s dreamy math again.
trafamadore = tralfamadore ? Seems like.
November 28, 2012 at 2:39 pm | Steven Mosher says:
———————————————————————
Poor analogy. Golf club and ball manufacturers have more in common with the sceptic view … they don’t rely on model data, they gather their data from real time physical experiments.
http://www.youtube.com/watch?feature=player_detailpage&v=nxVEXFjal1I
Examination of the text of the paper of Rahmstorf et al for fallacious arguments reveals an example of one. The authors conclude that the “…adjusted observed global temperature evolution closely follows the central IPCC projections…” but as “closely” has more than one meaning this phrase is an example of an equivocation. This equivocation has the power to mislead the naive to the false belief that the IPCC models have been statistically tested without being falsified by the evidence when these models are really insusceptible to being statistically tested. The argument that is made by IPCC Working Group I in AR4 is of a similarly deceptive nature.
Yet another load of “statistical hand waving” to yield a desired result. When you set out to compare “projected” versus “actual” and find the result is that measured “actual” peaked in 1998 and declined thereafter, you have a problem with the AGW story-line. “Actual” is completely out of (below) the bands of uncertainty for all the various climate-model-projected scenarios! What’s a true-believer who makes a handsome living off the spoils of AGW theory to do? In a sane world, this data destroys the AGW story-line! CO2 kept climbing unabated and global temperature did not, FOR A PERIOD OF 14 YEARS!
Fortunately for the author of this paper, we no longer live in a sane world where reason dominated science. Tortured data is the fundamental tool of AGW promotion. Measured data does not show what you wish? Adjust it! Apply a series of statistically based transformations until you get either the outcome you wish or, at a minimum, one that does not utterly destroy the AGW story.
In this case, the author knew he could not get away with simply burying the “measured actual” data on which his paper purports to be based, so he presented it on his chart in barely visible “pink”. He then presented an “adjusted actual” in bold “red” that conveniently fell within the bands of uncertainty of previous computer model projections. The Emperor Has No Clothes! Has the entire world gone stark bonkers?
Bob Tisdale says: “The oceans warm naturally. That is, there is no apparent anthropogenic global warming component in the warming of the oceans. Land surface air temperatures simply mimic and exaggerate the warming oceans.”
Like you could have said that at the beginning of your post. You may disagree with the published study by Rahmstorf but you could learn a lot from his concise presentation.
One thing you should worry about is when you say things like, “ENSO is a process that creates and releases heat naturally.” The release part is fine; the creation part, not. It seems you should ponder the laws of thermodynamics in a more quantitative matter. Total heat has to add up and come from somewhere, otherwise we could just heat our houses by blowing air about.
I think one difficulty with peer review in cases such as this one is that there is little scope to objectively argue against an entire method. Should R&F have even attempted to remove ENSO factors from the climate and what does that even mean?
Even if you dont believe in Bob’s analysis, you have to wonder whether something like it could be real. Certainly R&F have the MASSIVE assumption that CO2 is doing the warming despite the obvious large step temperature increases which on the face of it are difficult to attribute to a constant small forcing.
That phrase “failed to note”. [!]
I would say it is not a failure to note by Rahmstorf et al (2012),
Rather, what we see and read is a Failure To Comprehend!
Rahmstorf et al. lack the fundamental ability to … Comprehend.
Therefore, they wander aimlessly from ‘tree to tree’ and ‘swamp
to swamp’. Like the Anthropogenic Mann Thing.
And their ‘arithmetic’ … unfounded … illogical … in any realm of Mathematics.
Perhaps the branches of Astrology will Rush To Aid Them In Their
Moment Of Supreme Need …. err … no. Not EVEN these.
Mr. Rahmstorf … an example of … Failure. Supreme Failure.
A failed human being, a monster calling itself Mr. Rahmstorf.
Steve Mosher says:
“What do I do?
1. retest until I can absolutely control all the conditions ( hehe, right )
2. Rerun my model with the ACTUAL parameters.
3. Account for the differences by adjusting the observations, removing noise, outliers etc
4. Invoke popper and claim that the model is wrong and newtons laws of gravity
which the model relies on are suddenly disproven.
Most of the time you will do #2, or #1 IFF it is feasible and cost effective
But if you cant do 1 ( we cant control the sun) and if you cant do 2 ( run the model over )
Then the only thing you can do is 3.
3 is ugly. 3 is hard. 3 is prone to confirmation bias because you tend to only correct those things that go in your favor to bring results inline with predictions, but option 3 is sometime the only thing you can do for the present time. its a band.”
Steve, (and I may be preaching to the choir) Then why bother with a paper like rahmstorf et al at all? If in order to get a linear fit you have to remove and manipulate your data then how can you possibly state with any confidence that your conclusions are accurate? To me this paper is simply an effort to try and prove a point, so I say, what’s the point? Wouldn’t money be better spent in trying to find out more about what we don’t know? Clouds come to mind…
trafamadore says:
“One thing you should worry about is when you say things like, “ENSO is a process that creates and releases heat naturally.” The release part is fine; the creation part, not. It seems you should ponder the laws of thermodynamics in a more quantitative matter. Total heat has to add up and come from somewhere, otherwise we could just heat our houses by blowing air about.”
Bob has already explained this and it’s in his presentation if you would get off your butt and take a look. He explains that the added energy comes from SWR from decreased low level cloudiness. If you want to debate then ask him about cloudiness trends or something else rational, your arguments are exactly that, arguments.
Trafamadore, you say: “One thing you should worry about is when you say things like, “ENSO is a process that creates and releases heat naturally.” The release part is fine; the creation part, not. It seems you should ponder the laws of thermodynamics in a more quantitative matter. Total heat has to add up and come from somewhere, otherwise we could just heat our houses by blowing air about.”
It’s quite evident that you simply do not want to get this. How many times have Bob explained this to you and to all of us? It’s how the ENSO process works! The times when the net uptake of energy from the sun into the global system – you know, energy input from OUTSIDE the system – is positive (La Niña) is an equally important part of the ENSO process as the part where the net uptake of energy from the sun is negative (El Niño), that is, more energy is released from the Earth system than is being absorbed from the sun. ENSO doesn’t ‘create’ the energy. It works it into the system. If ENSO only released energy, never received any, it would quite soon have depleted its fuel deposits and faded away. No, the energy comes from the sun. Constantly. That’s a no-brainer. Sometimes more is released during El Niño conditions than is being absorbed during the following La Niña conditions. Then the Earth system will on average loose total energy content. At other times more energy is absorbed during a La Niña event (like during a three year one) than is able to be released during the following El Niño conditions. Then the total energy content of the Earth system will on average go up.
How hard is this to understand?
trafamadore says: “One thing you should worry about is when you say things like, ‘ENSO is a process that creates and releases heat naturally.’ The release part is fine; the creation part, not. It seems you should ponder the laws of thermodynamics in a more quantitative matter. Total heat has to add up and come from somewhere, otherwise we could just heat our houses by blowing air about.”
Maybe you should study the data before you question my statement, trafamadore. The graphs presented in this post indicate the sea surface temperatures warmed naturally. Are you aware that the global oceans can be divided into logical subsets which show the ocean heat content warmed naturally, too? This is illustrated and discussed quite clearly in the two videos presented in the post. Since 1950, there have been three 3-year La Niña events. They occurred in 1954-57, 1973-76, and 1998-2001. During the multidecadal periods between those 3-year La Niñas, Ocean Heat Content cooled in the tropical Pacific. Did you know that? Are you aware that the same holds true for the tropical oceans as a whole? If you do not understand how the tropical oceans warm during La Niña events, then you have no basis from which to claim I don’t understand thermodynamics. Are you aware the Ocean Heat Content for the extratropical North Pacific cooled from the start of the dataset until the late 1980s and then warmed in a 2-year period, and that without that 2-year warming, the Ocean Heat Content for that region would show cooling from 1955 to present? Again, trafamadore, you need to study the data and the natural processes through which the oceans warm before YOU think that somehow, somewhere anthropogenic greenhouse gases can do something more that evaporate a little more water from the surface of the global oceans.
No, I didn’t ignore it, and I’m grateful to Bob for responding politely, unlike some of the other posters here.
This is in fact the same response that has been given by Bob to me, and to others who have raised exactly the same issue several times in response to Bob’s postings.
The problem in more detail is this. Take figure 5, and rotate it by approx 10 degress clockwise. What you’d get is a graph that shows temp rises during an El Nino, followed by a gradual decay back to previous temps by the time of the following El Nino.
If you then impose a linear warming signal on to this graph you would get exactly what Bob shows. The question that has been asked before, by me and other people, is how could you distinguish these two cases – one where there is a gradual warming, and one where step changes occur due to El Nino events. The graudal waming case seems to some people to make more sense, as I do not think Bob has explained where the long-term increases in temperature are coming from.
Note that Bob doesn’t dispute this – he explictly says “I don’t present theories. I present data.”
I’m astonished at the nasty attacks I’ve received in comments above for wanting to know the answer to this issue. It has nothing whatsoever to do with Solar/CO2/volcanos/whatever – I would simply like to know if the data can distinguish between the case of there being no underlying warming signal and the case where is there a warming signal, and all of Bob’s responses are about the heat redistribution, which he explains very well, but does not (to me) explain where the gradual long-term increase in temperatures shown in figure 5 come from. I would think that this requires a long-term increase in ocean heat content, and not just a redistribution of heat, to sustain such a thing over the 35-year period of the graph.
You should not be astonished. Go back and read your original complaint wherein you claim that Tisdale had never responded to the issue except to tender his book. Then read your last posting wherein you admit that Tisdale has indeed provided you the answer previously; I quote: “This is in fact the the same response that has been given by Bob to me..”. When you seem to shoot from the lip, people will shoot back.
Furthermore, one complaint about the Rahmstorf paper is that it changes data to suit the theory. Please allow me to quote Faraday which quote seems applicable. “When I make observations that contradict my theories, I adjust my theory to accomodate the observation. What do you do sir?”
Well, the response to Faraday’s question is not recorded but it might have been something like– ” Take figure 5 and rotate it about ten degrees.”
Steveta_uk says:
November 29, 2012 at 12:58 am
Would you dispute that the warm water in the Western Pacific Warm Pool, (WPWP,) cannot be caused by IR back-radiation?
If you cannot dispute that then there is no need to explain any more than Bob already has.
Like a KERS on a GP car, between El Niños, energy from the Sun is harvested in the battery, (the WPWP,) and then later released during an El Niño. The only thing that can prevent this is additional cloud mid-Pacific. If we can find out why there is less cloud over the mid-Pacific than once there was, we will have the answer.
DaveE.
If only they’d fly away en masse!
Steveta_uk says: “The graudal waming case seems to some people to make more sense, as I do not think Bob has explained where the long-term increases in temperature are coming from.”
I have explained it in numerous posts before this one and in this post. In the two paragraphs before Figure 5, above, I wrote:
There’s something blatantly obvious in the graph of the detrended Rest-of-the-World sea surface temperature anomalies (Figure 3): If the Rest-of-the-World data responded proportionally during the 1988/89 and 1998-2001 La Niña events, the Rest-of-the-World data would appear similar to the East Pacific data (Figure 2) and would have no warming trend.
Because those divergences exist—that is, because the Rest-of-the-World data does not cool proportionally during those La Niña events—the Rest-of-the-World data acquires a warming trend, as shown in Figure 5. In other words, the warming trend, the appearance of upward shifts, is caused by the failure of the Rest-of-the-World sea surface temperature anomalies to cool proportionally during those La Niña events.
And, Steveta_uk, in the paragraph before those two, I wrote:
They [the divergences during the La Nina events of 1988/89 and 1998-2001] result because the naturally created warm water released from below the surface of the West Pacific Warm Pool by the El Niño events of 1986/87/88 and 1997/98 are not “consumed” by those El Niño events. In other words, there’s warm water left over from those El Niño events and that leftover warm water directly impacts the sea surface temperatures of the East Indian and West Pacific Oceans, preventing them from cooling during the trailing La Niñas. The leftover warm water, tending to initially accumulate in the South Pacific Convergence Zone (SPCZ) and in the Kuroshio-Oyashio Extension (KOE), also counteracts the indirect (teleconnection) impacts of the La Niña events on remote areas, like land surface temperatures and the sea surface temperatures of the North Atlantic. See the detrended sea surface temperature anomalies for the North Atlantic, Figure 4, which show the same ENSO-related divergences even though the North Atlantic data is isolated from the tropical Pacific Ocean and, therefore, not directly impacted by the ENSO events.
Steveta_uk asks where: “… but does not (to me) explain where the gradual long-term increase in temperatures shown in figure 5 come from.” while ignoring the actual message of Fig 5. The rest of the world does not completely cool to the previous temp during La Ninas. Why? Any number of reasons which to me are mostly associated with 1) a lag in ocean currents, and to me the most obvious 2) increased solar energy and 3) solar energy is a constant. Why do you assume that Rafmstorf/Foster-12 actually identified the total impacts of even those influences studied and that those they idenfied are any where near the actual complete list.
Steve your confusion is based upon a reliance that the slow increase in warming MUST BE from GHGs. Worse to support that belief he has to adjust he visual presentation: “Take figure 5, and rotate it by approx 10 degress clockwise. What you’d get is a graph that shows temp rises during an El Nino, followed by a gradual decay back to previous temps by the time of the following El Nino.
If you then impose a linear warming signal on to this graph you would get exactly what Bob shows.”
What is obvious to me is that the AGW signal, when positive, is easily over whelmed by natural signals. The other problem I have is considering ~130 years long term, when we have a signal for this interglacial of overall cooling since the early warmup.
If the precise measurements you imply were actually available most of these discussions would disappear, but they do not exist, and we must calculate them from even more imprecise data/knowledge. The RF Study is a prime example of this.
Bob Tisdale says:”Maybe you should study the data before you question my statement, trafamadore.”
Perhaps. But maybe you should publish your stuff before you attempt to take down already published studies.
Sorry, but in the science world, peer reviewed published stuff trumps abstracts from meetings, talks, books, unpublished manuscripts, the US house of representatives — and blog posts. (That was in order of credibility, BTW)
Maybe to say it another way, I am not a climate specialist and it is obvious that most others on this site are not either. So when I see someone try to take down a published article with a bunch of Excel graphs and has not published himself, I favor the peer reviewed stuff. Pretty simple.
If you are right, prove it like a lowly scientist does it…you publish. Pretty simple. I think that Mr Watts believes this as well.
Hiding in the blog dens that are uncritical of your stuff means you will never improve your story and of course never have an effect.
Duster says:
November 28, 2012 at 2:48 pm
Gail Combs says:
… CRU’s Dr. Phil Jones, world renowned climatologist, can’t even plot a trend in Excel!
Gail, there is a saying that circulates around the internet regarding spreadsheets and statistics, “don’t!”…
_________________________________
I haven’t used Excel in a decade or two. It was just the first spreadsheet I learned and I found it extremely easy even for the ‘computer-impaired’ My home computer has Linux. (I Can’t stand Windows)
wsbriggs says:
November 28, 2012 at 3:30 pm
So tell me, when with the electrical fields within the atmosphere be included in the predictions? What effects do electrical discharges like the Aurora Borealis have on stratospheric clouds? Can sprite discharges modify the path of the jet streams? What about the low frequency resonances in the ionosphere, what is their contribution? Are these second order, third order effects? Who’s studied it?…
_________________________________
Try Dr. Joan Feynman, Richard Feynman’s sister. She has been fascinated by the Aurora Borealis since Richard showed it to her as a little girl.
trafamadore says:
November 28, 2012 at 6:50 pm
….One thing you should worry about is when you say things like, “ENSO is a process that creates and releases heat naturally.” The release part is fine; the creation part, not. It seems you should ponder the laws of thermodynamics in a more quantitative matter. Total heat has to add up and come from somewhere, otherwise we could just heat our houses by blowing air about.
______________________________________________
Bob has most certainly explained that.
In a nut shell El Nino is the ‘release of heat’ half of the cycle and La Nina is the recharge half of the cycle. These two halves are NOT necessarily in equilibrium. If the El Nino has ‘left over heat’ as it has during the time Bob has been studying it then the net result is an increase in total SST. link
In the cool (recharge) half of the cycle, La Nina, the cloud cover in the equatorial zone is diminished and the seas gain heat from the sun. If this gain is fairly large the seas do not cool as much giving the stair steps seen in Bob’s <a href="http://i49.tinypic.com/j638yq.jpg"graphs. If the gain is small during La Nina the seas could cool more and there could be less El Ninos and you could see a DECREASE in SST as is evident in the EPA graph from 1880 to 1910.
My SWAG is that is the type of ENSO we are going to be seeing in the near future with a net decrease in SST. For example the last La Nina has not been followed by an El Nino but by a La Nada (neutral)
Bob explains it a heck of a lot better than I can in his video.
trafamadore:
Following a series of people pointing out your deplorable behaviour, at November 29, 2012 at 5:27 am you have the gall to write
He has published his excellent “stuff” in several places including here. And he is suggesting that you read it before making your foolish comments.
Maybe you should learn that it is better to be thought a fool than to say something which proves you are.
Richard
richardscourtney: In ‘climate science’ when an understanding is shown to be wrong by failure of a prediction then it is common practice to make post hoc adjustments to the prediction. The FR paper is a clear example of such a post hoc adjustment.
On this I agree with you. I in my wording, I distinguish between “testing a hypothesis” and “rescuing a hypothesis”.
Trafamadore
Many in the warmist camp refer to the process of peer review as you do, as a sort of imprimature or certification of validity,and that papers that lack such a certification are unworthy of consideration. This assumption is gross error, as peer review is no certification of the validity of the study. Furthermore, many worthy papers are given at science colloquiums and conferences. For example, at the annual GSA conference, hundreds of geoscientists gather to present and to hear studies and reports, none of which have been “peer reviewed” or published in a journal. This sort of colloquium is found in all scientific disciplines. Almost all scientists have participated in such conferences and none would ever make such statements as you have concerning unpublished studies, EXCEPT in the field of climatology where one repeatedly hears sneers about “peer review” or lack thereof. Your sneering reveals you as a parrot, repeating what you hear without understanding what you say.
richardscourtney says: “Following a series of people pointing out your deplorable behaviour”
What’s that line about a kettle and a pot?
richardscourtney says: “Maybe you should learn that it is better to be thought a fool than to say something which proves you are.”
I am very used to being wrong, it’s part of my business model.
But a fool? I did not use the word to describe anyone here, and would advise you to follow my example.
richardscourtney says: “He has published his excellent “stuff” in several places including here.”
You can say and publish anything you want on the internet; but as you know I was talking about peer review. And that he has not done.
Tisdale could answer in a clear way where the mysterious energy comes from in his model. Several people have asked this of him, and when I looked in to it this AM, it turns out this is not the only place he has been asked such questions. He says it’s natural, well, that’s what he says. The more he explained things, the more I started thinking about people explaining a perpetual motion machine; his too complicated explanation, complete with caps and red lettering, seems overdone.
The bottom line is that the earth is warming, the Arctic is melting, and the ocean is both rising and becoming more acid. I suspect swirling hot and cold ocean currents are not going to be enuf to explain it all. Nevertheless, I will be the first to say I am wrong if he publishes in Nature.
Bob, as a non expert I would have to say I very much agree with Anthonys views on this one…
“He has not succeeded in terms of how science views, you know, a successful inquiry. His papers have not passed peer review.”
That was referring to Richard Muller but I can’t see a reason why it doesn’t apply here.
Nick Kermode says:
November 29, 2012 at 1:28 pm
“He has not succeeded in terms of how science views, you know, a successful inquiry. His papers have not passed peer review.”
That was referring to Richard Muller but I can’t see a reason why it doesn’t apply here.
______________________________________
With the amount of fraud in peer-reviewed papers, the gate-keeping and the expense, why the heck should Bob Tissdale bother?
Muller’s paper was submitted to peer review and not passed it after a year and a half. I.e., the reviewers have found problems with it. No reviewers have found problems with Tisdale’s paper.
trafamadore says:
At November 29, 2012 at 1:14 pm you say
Oh! So your business has gone broke. Or perhaps you business is windpower so subsidies pay for your being wrong.
And you say of Bob Tisdale
You can say and publish anything you like in ‘climate science’ in peer reviewed form if you have the right pals. An example of this is the ridiculous paper by Rahmstorf and Foster which is the subject of this discussion, and consideration of which you are trying to deflect. Even outrageous tripe such as Mann, Bradley & Hughes (1998) gets a pass through pal review.
Do you have anything to say in defence of the nonsense by Rahmstorf and Foster or is your snowstorm of strawmen – notably your unjustified attack on Bob Tisdale – the only response you can muster to the criticisms of that paper?
Richard
Nick Kermode says: “That was referring to Richard Muller but I can’t see a reason why it doesn’t apply here.”
I’m surprised you can’t see the difference, Nick. It’s very obvious. Muller was presenting a totally revised land surface air temperature dataset. On the other hand, I’m simply noting the blatantly obvious deficiencies in the methods used Rahmstorf et al (2012). Anyone who can read a graph can see the problem with their assumptions that I’ve presented in Figure 3 of this post. Why would you, Nick, think that requires peer review, when the problem is so obvious?
trafamadore says: “Maybe to say it another way, I am not a climate specialist and it is obvious that most others on this site are not either. So when I see someone try to take down a published article with a bunch of Excel graphs and has not published himself, I favor the peer reviewed stuff. Pretty simple.”
You can believe anything you want, trafamadore. I personally do not care what anyone believes.
What I do is very simple. I present data. And in this case, the data contradicts the assumptions made by the authors of the peer-reviewed paper. That leaves you, the reader of my post, with a number of choices. (1) You can believe the peer-reviewed paper, even though the data contradicts their assumptions. (2) You can believe the data as I have presented it. Or (3) you can be skeptical of what I presented and go to the source of data that I included at the end to the post and verify my results. If you verify my results, you have two more choices, which are to believe the data or to believe the paper. Those choices are yours.
Most of the visitors here have stopped verifying my results. They used to do it all of the time. Now, I see few comments to that effect. Most of the people here would favor (your choice of words—favor is a great word in this discussion, BTW) the data over a peer-reviewed paper. What’s your choice?
David A. Evans says: “Like a KERS on a GP car, between El Niños, energy from the Sun is harvested in the battery, (the WPWP,) and then later released during an El Niño.”
Great analogy, David. Thanks. I’m terrible with analogies. And for those wonder what KERS is, it’s the Kinetic Energy Recovery System used on Formula 1 cars:
http://en.wikipedia.org/wiki/Kinetic_energy_recovery_system
GRRRR. I missed the last two races of the season this year. The Sky Sports webcast through the eplsite locked up. That made me cranky when I saw the results.
@ 7:33, Gail Combs says “In the cool (recharge) half of the cycle, La Nina,” and so on.
The wording – half of the cycle – ought to be something like:
In the La Niña (recharge) activity . . .
. . . because there is not a cycle to halve.
Hi there Roger. I think your statement that no reviewers have found a problem with this work probably reflects the fact that it hasn’t been submitted for review, not there are no issues with this paper. On reading it several things jump out. Maybe someone can put my understanding right if I have it wrong.
Bob says….”They result because the naturally created warm water…”
As far as I am aware it takes energy to warm water. As far as I am aware it takes more energy to make warmer water, and more energy again to sustain it. The most basic laws of thermodynamics categorically disprove Bobs assertion here. I don’t know of any hypotheses that have relied on naturally created energy that have done too well in peer review.
Also Bob says ” The rest of the world data does not cool during La Nina events but sea surface temperatures there warm in response to El Nino events”
and
” the warming trend, the appearance of upward shifts, is caused by the failure of the Rest-of-the-World sea surface temperature anomalies to cool proportionally during those La Niña events.”
Looks like a plausible assumption based on the graph but if we look deeper into the past using this mechanism, some back of the envelope calculations would show a that this hypothesis just can’t be possible. I’ll try a short elevator as I understand Bob…
El Nino warms the “rest of the world” SSTs on each occasion,
La Nina does not cool the “rest of the world” SSTs post an El Nino event.
ENSO is not noise and can not be averaged out over time, therefore has a cumulative heat effect.
Bobs figure 5 shows three El Ninos between 85 and present,
Bobs figure 5 shows a 0.3C increase in SST.
Bobs mechanism therefore shows (roughly) 0.1C increase per event
In the last hundred years we have had about 23 El Ninos
Lets now be conservative and halve all the numbers to average a guess over long timescales and do the calculation
.05 increase per event x 11 events per 100 years= 0.55C over 100 years.
Still sounds plausible, but Bob says this is not waxing and waning noise that adds up to zero effect as RFC 12 suggest, so must be cumulative. So lets go back 5000 years..
0.55 x 50= 27.5C.
So, to my understanding, Bobs hypothesis is certainly supported by that 30 years of data but by extending the mechanism outside that time shows it is obviously incorrect. Some other mechanism is driving the increasing OHC. Combine that with the fact that whatever the wiggles or natural events all graphs show more heat in the ocean now than the 80’s. This has not been “created” (unless we have discovered perpetual motion) it has been transferred. Bobs hypothesis can not explain this. (?)
trafamadore
You are misled. You say that the globe is warming but it is not. The last warming trend ended before this century began. What peer-reviewed studies have told you that the globe is warming? You should not read such garbage.
You say that the Arctic is melting- it is not, it’s freezing. It’s that time of year, you see. Come May it will start melting, as always. Then it will start freezing again next Sept. The polar bears are doing fine, except when some global warmer shoots them with a tranquilizing dart. Then they drown. Has some peer reviewed study told you that Arctic ice will someday disappear completely? Ah-, you must be reading about what some climate model has “projected”.Watch out for those.
The ocean level fluctuates according to cycles of warmth and cooling, as ice mass ablates in warmer periods and accumulates during cooler periods. Can you not find a peer-reviewed study that explains that? So relax, because 2 or 3 mm a year is no big deal and that is fixing to reverse.
By the way, a warmer world is entirely beneficial. It means milder winters. It means a longer growing season and higher levels of humidity. This increases world food supply, no small consideration for a world that will double and redouble in population this century. That means food production will need to double and redouble. For that, we need a warmer world. A warmer world means better conditions for all life forms. Cooling is the scythe of death and the gravest of threats because we are still in the Ice Age, though at an interstadial.
So pray for a warmer world. Some time ago, it was hoped that we could warm the world by oxidizing carbon, but that hope has been dashed as the world has seen no warming for over a decade and it is feared that a cooling trend is coming.
Does peer-reviewed literature tell you that the oceans are becoming more acid? Tsk, tsk, poor, misled fellow. The oceans are alkaline, and will remain so for the next billion years or more. Some peer reviewed studies imply that CO2 has increased the acidity of ocean waters and is dissolving plankton, corals, etc., which is egregious error. So beware of what you see in the peer-reviewed literature. You could wind up with a bad case of ChickenLittlepox, an infectious social disease that dulls the reasoning processes and results in confusion.
to my (trafamadore’s): “I am very used to being wrong, it’s part of my business model.”
richardscourtney says “Oh! So your business has gone broke. Or perhaps you business is windpower so subsidies pay for your being wrong.”
Ha Ha. No. I thought would have figured it out: I am a scientist. Like most scientists, I would at eliminating incorrect hypothesis. Think Edison, with his success story of 1999 ways not to make a light bulb, and you have a glimpse of the boring work I do! But not on AGW, thank heavens. But I have colleagues that do, and they are quite good I think. But I digress…
richardscourtney says “You can say and publish anything you like in ‘climate science’ in peer reviewed form if you have the right pals.”
I wish you were correct. Most unfortunately for all of us, you have no idea what you are talking about.
richardscourtney says “Do you have anything to say in defence of the nonsense by Rahmstorf and Foster or is your snowstorm of strawmen”
Of course I am not a climate man. But, no, I see nothing wrong with their paper. And to claim that the way they handled the ENSO noise in the record is wrong has no support in the published literature, that’s the way is has been done in the past, it’s a minor point in the paper, and they have a bigger point to make, and even if they thought they could modify it, I dont think they even care about. It’s not want they do. Also, I do have a fair amount training in statistics, like most scientists, and the approach appears statistically sound. It’s not too different than using a noise filter to remove the dust (ENSO) in a scanned picture.
But is there a problem with the published data? There might be.
Let me show you a problem:
Bob Tisdale says: “You can believe anything you want, trafamadore. I personally do not care what anyone believes.” He then does on to say he says stuff and we can believe of not. I am not doing justice to his screed, but you can read it above.
So your Tisdale is his own worse enemy, not me. How can people cite his stuff if it is not published, doesnt he know that you cant refs on the web in a paper? Heck, I dont even allow my undergrads to cite the web it in their term papers.
Nick Kermode
But Tisdale’s paper has been submitted for review right here at this website for a review process that is as thorough as any publication peer review and more thorough than some. It is an open process and superior to the present peer review system of publications, I believe.
trafamadore,
Leaving aside climate pal review, does it not concern you that there is no measurable AGW signal that has been conclusively identified? There is still no testable evidence showing that AGW even exists. At this point it is just an assertion. AGW may exist, but without measurable evidence it is still simply a conjecture. An opinion.
Do you tell your students that fact? Do you explain that AGW is stalled at the Conjecture stage of the Scientific Method? Do you explain that it is neither a testable hypothesis, nor a theory? Do you explain to them that the climate Null Hypothesis deconstructs all of the wild-eyed speculation regarding storms, weather, anthropogenic global warming, etc.? Do you inform them that every climate parameter has been exceeded during the Holocene, when CO2 was much lower?
Or, do you perpetuate the scientifically baseless Rahmsdorf/Foster myths, and the rest of the evidence-free climate beliefs?
Either produce testable, verifiable scientific measurements showing conclusively that global warming is caused, in whole or in part, by human emissions — or continue to defend peer reviewed witch doctor explanations. Because what they are doing is not science based, it is belief based.
Sixteen years and counting…
trafamadore says: “So your Tisdale is his own worse enemy, not me. How can people cite his stuff if it is not published, doesnt he know that you cant refs on the web in a paper?”
Your comments on this thread have reached nonsense level. Apparently you did not comprehend what I wrote to you in my earlier reply. Let me try it again: You, trafamadore, can accept the peer-reviewed paper or you can accept the data. I don’t care which choice YOU make. It’s your choice.
But I have to ask, Why would I be my own worst enemy, trafamadore?
mpainter says:
“The last warming trend ended before this century began.”
Really? Then please explain the measured ocean warming:
http://sealevel.colorado.edu/content/world-ocean-heat-content-and-thermosteric-sea-level-change-0-2000-1955-2010
I love how people just ignore data because they don’t like its results….
Mughal,
Thank you for that link. which shows conclusively that there has been no acceleration of the natural sea level rise:
http://sealevel.colorado.edu/files/2012_rel4/sl_ns_global.png
Despite substantially higher [harmless, beneficial] CO2 levels, nothing unusual or unprecedented is occurring. Thus, the climate Null Hypothesis remains un-falsified, and AGW remains a conjecture; an assertion lacking testable, empirical measurements.
Nick Kermode says:
November 29, 2012 at 6:09 pm
As far as I am aware it takes energy to warm water.
That is correct. As Bob T. expressed it “downward shortwave radiation (visible light), . . .”
What part of that are you having trouble with?
mpainter says: “You are misled.”
No. I lead myself, thank you. My principles are my own. Care to share?
mpainter says: “By the way, a warmer world is entirely beneficial. It means milder winters.”
I am from Buffalo originally and I like to ski in the winter. I love the cold and snow. So dont anger me.
mpainter says: “Does peer-reviewed literature tell you that the oceans are becoming more acid? Tsk, tsk, poor, misled fellow. The oceans are alkaline, and will remain so for the next billion years or more. Some peer reviewed studies imply that CO2 has increased the acidity of ocean waters and is dissolving plankton, corals, etc., which is egregious error.”
Does peer-reviewed literature tell your doctor that a new drug has come out that might save someone close to you? Tsk, tsk, poor, misled fellow. Dont do it! Quickly, stick your head in the sand because the death of someone close to you is natural.
More seriously, more heat will have winners (Canada) and losers (Texas). Be careful of what you wish for.
Nick Kermode says: “As far as I am aware it takes energy to warm water. As far as I am aware it takes more energy to make warmer water, and more energy again to sustain it. The most basic laws of thermodynamics categorically disprove Bobs assertion here.”
Nick, your lack of understanding of ENSO is astounding. You obviously do understand the interaction between the trade winds and the surface temperatures of the tropical Pacific. You obviously do not understand the interaction between the trade winds and tropical Pacific cloud cover. You obviously do not understand the interaction between tropical Pacific cloud cover and downward shortwave radiation (visible sunlight) entering the tropical Pacific. You obviously do not understand the interaction between downward shortwave radiation and the ocean heat content of the tropical Pacific.
Maybe you might try to understand the topic of discussion before you make statements that broadcast your ignorance of the subject matter.
Nick Kermode says: “I don’t know of any hypotheses that have relied on naturally created energy that have done too well in peer review.”
I immediately thought one: McPhaden 1999 “Genesis and Evolution of the 1997-98 El Niño”.
http://www.pmel.noaa.gov/pubs/outstand/mcph2029/text.shtml
McPhaden writes:
“For at least a year before the onset of the 1997–98 El Niño, there was a buildup of heat content in the western equatorial Pacific due to stronger than normal trade winds associated with a weak La Niña in 1995–96.”
Would you like me to explain how that happens, Nick?
John F. Hultquist, it appears the trolls would rather believe in a flawed hypothesis than spend a few moments to comprehend what the data says. To each their own.
Bob Tisdale says: “But I have to ask, Why would I be my own worst enemy, trafamadore?”
Guys (and I mean gals too by that), I think we are starting to get somewhere.
Bob Tisdale says: “Your comments on this thread have reached nonsense level. Apparently you did not comprehend what I wrote to you in my earlier reply. Let me try it again: You, trafamadore, can accept the peer-reviewed paper or you can accept the data. I don’t care which choice YOU make. It’s your choice.”
No. You see it’s not my choice. Data only matters when it’s published. Scientists, mostly liberals BTW, are really conservative on this one point. It’s the choice of the scientific community, they are old rules that go back hundreds of years, and they have served us unbelievably well. Unbelievably. If you don’t agree with that, fine, but then you will have nothing to offer, and when this blog is deleted some day, you and the bytes that define you will be gone. You don’t get to set the rules. You will just be ignored. So deal with it.
So to others out there who have something to offer, stop complaining about the quality of science and publish in a peer reviewed journal. Only then will people really notice you.
trafamadore says:
“Data only matters when it’s published.”
What?? You prissy, testosterone-deficient academic. Data is data! Clearly, you do not understand that fact. Go back to your tenure-protected ivory tower, jamoke. This here is the real world.
You poison minds in order to keep your green sycophant, competition-free fellow academics kissing up to your protected status. How comfortable.
You have no balls. If I am wrong, then let us set up a real debate, with a mutually agreed moderator in a neutral venue. Recorded on YouTube, for all the world to see, forever.
What’s that? You, like every other cowardly climate alarmist, tucks tail and runs from any real debate? What are you afraid of? Having the public pass judgement on your witch doctor pseudo-science?
You and Algore. Two peas in a pod.
Chicken.
trafamadore says:
November 29, 2012 at 8:37 pm
——————————————-
So your premise is that ENSO and SST data is neither published, nor derived from peer-reviewed publications ?
You idiot.
D Böehm says: “do you perpetuate the scientifically baseless Rahmsdorf/Foster myths, and the rest of the evidence-free climate beliefs?”
Look, the Rahmsdorf paper is–in the end–a prediction, and we will have no idea of its mythdom until 5 to 10 years from now. They stuck their necks out, and we will see. But to call it nonsense _now_ is nonsense. You must wait.
Hansen did the same thing 20 years ago, and he has been more or less correct, and thats with a really weak model by todays standards.
Models are hypotheses, and they are tested by their predictions, and then they are modified, and they are tested again, and on, and on, and on. As it turns out, the worse model out there has predictive value and the best model out there is not prefect. What would you expect?
But scientifically baseless? Not.
trafamadore says: “Data only matters when it’s published.”
and to that D Böehm says,”What?? You prissy, testosterone-deficient academic. Data is data! Clearly, you do not understand that fact. Go back to your tenure-protected ivory tower, jamoke. This here is the real world.”
Like really? In the real tenure-protected ivory tower world we publish. I can read stuff published hundreds of years ago…
And tenure-protected ivory tower academics…and your descendants…will be able to read my testosterone-deficient stuff hundreds of years from now, if AGW hasnt upset things too much.
Stuff not published? Vaporization. Especially with the heat expected…
D Böehm: So you agree the sea continues to rise.
Why? Where is this oceanic warming coming from (my original question)?
Many years ago people working on science, especially math, problems did not publish. Rather they would challenge others to public contests, each submitting problems for the other. Knowing something others did not could lead to embarrassment for your rivals. To try to keep that from happening to the CAGW-Team they invented a “pal review”, “editor intimidation”, and “never debate” protocol. The internet and blogs have made a shambles of that strategy. It has famously been said when your hypothesis does not agree with the data, you are wrong. CAGW is wrong.
Mughal says:
November 29, 2012 at 7:56 pm
mpainter says:
“The last warming trend ended before this century began.”
Really? Then please explain the measured ocean warming:
http://sealevel.colorado.edu/content/world-ocean-heat-content-and-thermosteric-sea-level-change-0-2000-1955-2010
There has been no change in sea surface temperatures since March 1997 or 15 years, 8 months (goes to October). See the graph below to prove it. Note that this graph has not been peer reviewed. It is merely plotted data with a best fit line. I also realize that you talked about deeper levels of the ocean warming. My response is that even if this were true, why should that concern us? We can burn fossil fuels for a long time if the deeper ocean took all the heat and warmed from 3.0 C to 3.2 C.
http://www.woodfortrees.org/plot/hadsst2gl/from:1997.1/plot/hadsst2gl/from:1997.1/trend
mpainter says: “Many in the warmist camp refer to the process of peer review as you do, as a sort of imprimature or certification of validity,and that papers that lack such a certification are unworthy of consideration. This assumption is gross error, as peer review is no certification of the validity of the study. Furthermore, many worthy papers are given at science colloquiums and conferences.”
Maybe. There are bad papers out there, and we do often wonder how some papers got through review. But in my experience, those are the minority and they end up being poorly cited papers, so they get justice in the end. (You can go to “web of science” to look at the citation index for individual papers, but I think you need a subscription.)
First you are right many worthy papers (Mine for example!!) are given at science colloquiums and conferences. But they dont get attention in Nature until they are published normally. But you should know, many many shoddy papers are given at science colloquiums and conferences. (Not mine for sure!!) By the time they see print, they are certainly less shoddy.
Peer review = quality control. It’s not perfect, even Honda and Toyotas have defects. But peer review, its pretty good. And it’s all we got. No one has better idea how to do it at the moment, but you can put your ideas in the little suggestion box at your workplace.
trafamadore says:
November 29, 2012 at 7:01 pm
Just some friendly advice:
You would do well to read the list of names of people who signed the “An open letter to the U.N from climate skeptic”s
Hi Bob, I read your link and have read other recent papers on those lines. As far as I can tell all the processes there are transfers of energy between ocean currents and atmosphere as would be expected given thermodynamic laws. It does explain how ENSO exists and how the energy in the system is shifted, localised/concentrated etc during the events. Winds, currents etc etc do not explain the OHC increases and they certainly dont create heat. Transfer yes.
The key here is the quote you choose to support your idea. It says “build up” of heat which IS NOT the same as creating it. Wind heating the ocean is not creating energy, it is transferring it or containing it. If put a heater on in a room and put a fan facing into the room near the doorway heat will build up in that room. Conversely if I put the fan near the heater facing out the doorway the heat will be distributed throughout the house. The wind from the fan is not creating energy but can cause it to build up. To create an upwards trend in the temperature of the room for both fan positions you have to add more heat. So the energy that has raised the SSTs must come from outside the system. Your link, and quote do not disprove the second law. Thanks for your reply.
Dear Moderators, can you please check something?
This is regards to trafamadore on November 29, 2012 at 8:37 pm.
After several days and many comments on several threads, after trying to boost his flagging credibility by claiming he’s a scientist teaching undergrads, now suddenly, between just this comment and his 8:16PM comment, he has miraculously discovered apostrophes and their use in contractions.
I cannot believe this is the same person. It must be at least two who have switched places for their haranguing duties.
Can you check ISP’s and whatever else you do, and see if it is more than one person?
Note: Those who will not use apostrophes, had best not be wont to look smart as they won’t.
Trafamadore
What fun you are! Please allow me to doctor you for confusion.
Concerning temperatures in Texas for the past century,there has been no trend- a flat curve. If you compensate for the UHE, you get a slight cooling trend. How about that!
Concerning snow in Buffalo, surely you don’t expect to ever run out of that. A warmer Lake Erie will mean more snow, if I am not mistaken about the lake effect. So relax, ski away, and try not to get angry because a warmer world is a better world.
And believe me, if you hang around the wrong publications, you can get misled. Proof is in the pudding- as when you say that the globe is still warming.
Because I show awareness that the world food requirements will be dire in the future, do you suggest that I have my head in the sand? Tsk, tsk, poor fellow, such confusion.
And of course the oceans are alkaline with no possibility of becoming acid. You are not so confused that you tried to rebut that. So there is hope for you. But you must stay away from those peer reviewed climate articles if you wish to improve.
Well, Mughal, where are you? Off somewhere, ignoring data that you don’t like?
Nick Kermode says: “Hi Bob, I read your link and have read other recent papers on those lines. As far as I can tell all the processes there are transfers of energy between ocean currents and atmosphere as would be expected given thermodynamic laws. It does explain how ENSO exists and how the energy in the system is shifted, localised/concentrated etc during the events. Winds, currents etc etc do not explain the OHC increases and they certainly dont create heat.”
In my last reply to you, did you somehow miss the discussion about trade winds, cloud cover, downward shortwave radiation, and ocean heat content? During a La Nina, trade winds are stronger than normal. The stronger trade winds reduce cloud cover, which, in turn, allows more downward shortwave radiation to enter and warm the tropical Pacific.
You continue to express your lack of understandings of ENSO basics. Let me guess, you must be a climate modeler. They also don’t understand ENSO basics.
If you’re having trouble comprehending my explanation because it’s so simple, Nick, refer to Pavlakis et al (2008) paper “ENSO Surface Shortwave Radiation Forcing over the Tropical Pacific.”
http://www.atmos-chem-phys-discuss.net/8/6697/2008/acpd-8-6697-2008-print.pdf
Note the inverse relationship between downward shortwave radiation and the sea surface temperature anomalies of the NINO3.4 region in their Figure 6.
To complement that, here’s a graph to show the interrelationship between the sea surface temperature anomalies of the NINO3.4 region and cloud cover for the regions presented by Pavlakis et al:
http://i47.tinypic.com/35jfs7a.jpg
With your newfound knowledge of ENSO, maybe you’ll now understand why the long-term warming of the Ocean Heat Content for the tropical Pacific was caused by the 3-year La Nina events and the unusual 1995/96 La Nina:
http://i47.tinypic.com/2uianx2.jpg
During the multidecadal periods between the three 3-year La Nina events, tropical Pacific Ocean Heat Content actually cools, Nick:
http://i49.tinypic.com/dcd7k0.jpg
Where’s the effect of CO2 between the 3-year La Nina events, Nick?
For years, oceanographers and physicists have been saying that infrared radiation from CO2 only causes the oceans to evaporate a little more water, Nick. Sure does look like they’re correct. There is nothing in the satellite-era sea surface temperature data or the ocean heat content data that indicates manmade CO2 was responsible for the warming.
Have a nice day.
trafamadore says: “Data only matters when it’s published.”
The data is published, trafamadore. In fact, the general public can have access to NOAA’s Reynolds OI.v2 sea surface temperature data at the NOAA NOMADS website here:
http://nomad1.ncep.noaa.gov/cgi-bin/pdisp_sst.sh
The general public has access to the NODC ocean heat content through the KNMI Climate Explorer here:
http://climexp.knmi.nl/selectfield_obs.cgi?someone@somewhere
If, trafamadore, in that quote you’re saying data only matters when it’s presented in peer-reviewed papers, then your comments have reached laughable level.
There is enough heat capacity in the ocean for changes in upwelling, downwelling and currents to cause, in principle, both warming and cooling of climate WITHOUT ANY CHANGE IN TOTAL HEAT. Thus the repeatedly asked question “where is the heat coming or going” is a deeply ignorant one.
mpainter asked on November 30, 2012 at 12:01 am:
Well, Mughal, where are you? Off somewhere, ignoring data that you don’t like?
He was last sighted getting in a “last word” at the old Heartland Institute thread, ostensibly asking DirkH a question two weeks after the thread was otherwise forgotten.
I saw it pop up in “Recent Comments”, went to look, haven’t re-closed that tab yet.
trafamadore:
At November 29, 2012 at 3:32 pm I asked you – and I boldened the question so you could not miss it – this question
Since then you have continued to snow the thread with irrelevant and untrue nonsense but
you have failed to reply to the question.
This is a clear demonstration by you that you have no answer to Tisdale’s fundamental and valid criticisms of the paper by Rahmstorf and Foster.
You are now completely lacking any credibility and the only way you could recover some is for you – for the first time – to address the subject of this thread instead of deflecting from that subject with your bafflegab.
Richard
Bob Tisdale says: “The data is published, trafamadore. In fact, the general public can have access to NOAA’s Reynolds OI.v2 sea surface temperature data at the NOAA NOMADS website”
Yeah, I was wondering when someone would mention that, and also when I would accidentally say “data”. It’s the same in the biology world, with the all the genomes in various stages of disrepair. In biology, they are usually accompanied by a published article that no one reads in Nature that has hundreds of names on it.
While you are correct the data is on the web in unreviewed form for many years and peer reviewed articles are published with that data, I think we can say the data are not a hypotheses (but not always, gene homology for example). Usually when papers are based on web data, at least one reviewer is familiar with the web data, and we get through it. In the long run, bad web data is probably no worse than experiments with other less than prefect tools.
Inanycase, your stuff is not data and I didnt mean to call it that, it is an unreviewed manuscript containing unreviewed hypotheses, like any unreviewed manuscript.
kadaka (KD Knoebel) says: “Dear Moderators, can you please check something?”
Very funny. Dont you have something else to do? be warned sometimes i dont even cap or anything
trafamadore:
At November 29, 2012 at 10:09 pm you assert
NO!
Peer review does NOT equal quality control except of the most basic kind.
Peer review is a protection for journal Editors.
Reviewers assess a paper for logical inconsistencies, erroneous citations and methodological errors. Hence, an Editor gains some protection from publishing a paper which is so wrong as to be risible.
Importantly, an Editor may choose to not put a paper to peer review if he/she perceives that its contents will be blocked by the vested interests of a powerful consensus group. For example, knowing there was such a prejudice of all potential reviewers, the then Editor of Nature published two papers by an incompetent patents clerk without putting the papers to peer review. Those papers on relativity by Albert Einstein initiated a revolution in physics.
Publishing those papers without peer review gave Nature a degree of credibility as a scientific journal on which it relies to this day.
And peer review prior to publication does not – and cannot – provide a published paper with credibility. Only subsequent detailed consideration and replication of the work can do that.
This is demonstrated by a paper which was not put to peer review, was authored by two bicycle salesman, and was published in a magazine about bee-keeping. It was the seminal work on aeronautics by Orville & Wilbur Wright.
The value of that paper is demonstrated by the existence of the aviation industry and not by who wrote it, where they published it, and its lack of peer review.
Reading your posts in this thread, I am caused to wonder if you understand anything about epistemology and the scientific method.
Richard
Nick Kermode says:
November 29, 2012 at 10:22 pm
– – –
Wow! Just … wow.
Bob Tisdale says:
November 30, 2012 at 2:09 am
– – –
You’re being too kind. This is a person who’s clearly not here to ‘get your point’.
Werner Brozek says: “There has been no change in sea surface temperatures since March 1997 or 15 years, 8 months (goes to October)”
Wasn’t there an blog post here on cherry picking time intervals for an Escalator or something?
But I hadn’t seen that wood for trees web site, it’s cool. Thanks. Look at my plot:
http://www.woodfortrees.org/plot/hadsst2gl/from:1970/plot/hadsst2gl/from:1970/trend
thanks for the paper Mughal.
trafamadore, the Appeal to Authority defense went up in smoke in the last decade due to well publicised FRAUDS.
In the News:
New York Times: A Sharp Rise in Retractions Prompts Calls for Reform
PLOS medicine: Why Most Published Research Findings Are False
United States Attorney’s Office: Former Penn State Professor Charged in $3 Million Federal Research Grant Fraud
Australian Universities’ Review, Vol. 43, No. 2, 2000, pp. 17-22: Research grants: problems and options
Scientific American: The Broken Science Funding System
Spiegel: WWF Helps Industry More than Environment
Daily Mail: The ‘false’ pandemic: Drug firms cashed in on scare over swine flu, claims Euro health chief says
Washington Times: Survey shocker: Liberal profs admit they’d discriminate against conservatives in hiring, advancement ‘Impossible lack of diversity’ reflects ideological intimidation on campus
MED city News: FDA says CRO Cetero faked trial data; pharmas may need to redo tests
University World News: NETHERLANDS: Dean may face data fraud charges
And that is just a small sample. There is even a website Retraction Watch
Science has lost its “priesthood” status and the public’s belief in it’s integrity thanks to all the fudging and out right lies. As a scientist I find this very very sad.
Kermode, Trafamadore, whomever else
The peer review process regarding climate studies is somewhat discredited. Time and again climate studies are shown to be in error, after publication. Peer review among “climate scientists” is faulty because the reviewer all too often shares an ideological commitment with the authors. Such a commitment stymies objective critique. This is lack of objective critique from peers has hurt the field of climate study. For example, for decades many paleo-climate studies were based on tree rings,which proxy has been thoroughly discredited and is being abandoned. For confirmation of this, see Jim Bouldin of RealClimate. The net result is that decades of studies and hundreds of works now have to be discarded. And for decades progress in understanding climate processes has been held back because of this polluting science. It is all due to faulty, uncritical peer review. This faulty peer review is insidious and works in other ways. Worthy climate studies sometimes have difficuly getting getting published. Such eminent scientists as Roger Pielke, Sr. and Roy Spencer have encountered what amounts to prejudice in this regard. It is all due to the displacement of science by ideology. You two bloggers are good examples of this.
Bob Tisdale is justified in publishing his paper himself. His intention not to advance an ideology but to inform and instruct. His work does so commendably, but some choose not to understand the charts. Or maybe they can’t.
trafamadore:
This thread is about the clear failings of the ludicrous paper by Rahmstorf and Foster.
At November 29, 2012 at 3:32 pm I asked you a question – and I boldened it so you could not miss it – and I repeated the question at November 30, 2012 at 4:16 am.
I again remind that the question is
If you persist in your trolling of this thread then I will persist in posting the question so onlookers are reminded that you are unable to answer the criticisms of the paper by Rahmstorf and Foster.
Stop disrupting the thread: answer the question or go away.
Richard
trafamadore:
I read your post at November 30, 2012 at 5:20 am which replies to Werner Brozek saying
He provided this plot which shows the fact
http://www.woodfortrees.org/plot/hadsst2gl/from:1997.1/plot/hadsst2gl/from:1997.1/trend
Your reply says
Your plot shows that Werner Brozek is right, and your cherry-picking does not change that.
Werner Brozek shows sea surface temperatures have a slightly negative trend for nearly 16 years and NOAA says 15 years provides a statistically significant trend.
Your plot runs from 1970 and you are suggesting Werner Brozek is being misleading. LOL.
A person aged 30 stopped growing at age 18 but your plot is like claiming he is still growing because the trend of his height from age one is positive.
Your post is merely another example of your trolling this thread because you don’t like it being pointed out that the paper by Rahmstorf and Foster is rubbish.
I yet again ask you to answer the question
Richard
Trafamadore, I copy you
“Does peer-reviewed literature tell your doctor that a new drug has come out that might save someone close to you? Tsk, tsk, poor, misled fellow. Dont do it! Quickly, stick your head in the sand because the death of someone close to you is natural.”
Now, I know that you meant nothing by this, but a friendly word of advice: people have been known to turn something like this into a death threat. You really can’t be too careful about this sort of thing. Recall the notorious incident in Australia wherein a death threat was fabricated on a pretext less than this and taken up by the media, all for the purpose of smearing a skeptic. Now skeptics do not resort to such tactics, so you are safe on this blog. But be careful when you are dealing with the global warmers, especially Australians, who are an especially virulent type.
trafamadore: Peer review = quality control. It’s not perfect, even Honda and Toyotas have defects. But peer review, its pretty good. And it’s all we got. No one has better idea how to do it at the moment, but you can put your ideas in the little suggestion box at your workplace.
Your comments and some of the responses highlight a serious problem. The peer-review process is not sufficiently rigorous that all the published papers can be relied upon; talented people in blogs often point out flaws in papers that have been published, such as this post by Bob Tisdale, itself based on citations of other published data. Most legitimate criticisms of the published AGW-promoting papers face insuperable difficulties in getting published (read of some of the rare successes at Steve McIntyre’s blog Climate Audit); this leaves blogs such at WUWT as the single most important corrective to the peer-review process, though bloggers are themselves not perfect.
So here we have a solid effort by Bob Tisdale highlighting serious flaws in a published paper, and your critiques are: (a) you are not qualified or willing to judge it on its merits and (b) it has not been published in the sort of peer-reviewed literature that is not accepting of criticism. You also wrote that Rahmstorf and Foster have published a prediction that can be tested in the future, but AGW promoters never accept failed tests of hypotheses: they revise them, as R&F did here to a previous testable hypothesis, in such a way that failed predictions never count as evidence with respect to the truth of AGW.
It seems to me that, if you discredit the value of blogs as a corrective to the flaws of peer-review (I maintain that they are the best single corrective we have now), you would do better to evaluate Bob Tisdale’s post on its merits, and make this a better blog thereby. Lots of people read WUWT; if any of the regular readers have slogged through your posts, they have wasted their time.
trafamadore says:
November 30, 2012 at 5:20 am
Wasn’t there an blog post here on cherry picking time intervals for an Escalator or something?
But I hadn’t seen that wood for trees web site, it’s cool. Thanks. Look at my plot:
http://www.woodfortrees.org/plot/hadsst2gl/from:1970/plot/hadsst2gl/from:1970/trend
Yes, there was, and all times were less than 15 years. I have taken your plot and extended it to 1850 and have drawn a few more slope lines. Here is a summary:
Last 15 years, slope is 0.
From 1970 to date, the slope is 1.3/century.
From 1912 to 1942, the slope s 1.6/century.
From 1850 to date, the slope is 0.4/century.
So if we are concerned about “proper” 30 year periods, the 30 year period from 1912 to 1942 had a steeper slope than the last 42 years. So CO2 does not seem to be a factor. Or do you not agree? See:
http://www.woodfortrees.org/plot/hadsst2gl/from:1850/plot/hadsst2gl/from:1970/trend/plot/hadsst2gl/from:1850/trend/plot/hadsst2gl/from:1997.1/trend/plot/hadsst2gl/from:1912/to:1942/trend
Matthew R Marler says:
Good comment- wish I had put that.
Werner Brozek:
In your cogent post at November 30, 2012 at 8:49 am you write
It is possible that there may be onlookers who do not understand the importance of your point which completely demolishes the ‘red herring’ from the troll posting as trafamadore.
Therefore, I write to spell-out the issues which you raise when you write, “all times were less than 15 years”.
Firstly, in 2009 the US National Oceanographic and Atmospheric Administration (NOAA) reported at
http://www1.ncdc.noaa.gov/pub/data/cmb/bams-sotc/climate-assessment-2008-lo-rez.pdf
on page 123:
NOAA said that in 2009 and, Werner, you show that there has now been “zero trends for intervals of 15 yr or more” so there is a “discrepancy” between what the models predict and “the expected present-day warming rate”.
The rubbish paper by Rahmstorf & Foster which is the subject of this thread is an attempt to excuse that “discrepancy”.
Which brings us to the ‘escalator’ thread mentioned – as another ‘red herring’ – by the troll. It is at
http://wattsupwiththat.com/2012/11/25/skeptical-science-misrepresents-their-animation-the-escalator/
In that thread I explained the importance of your point about “all times were less than 15 years” with reference to the discrepancy. I copy that post below to save others needing to find it.
Richard
—————–
richardscourtney says:
November 26, 2012 at 2:46 am
RoHa:
At November 25, 2012 at 10:36 pm you ask the very reasonable – and fundamental – question:
An answer to your question depends on what is “their point”. In his above article, Bob Tisdale correctly states that “point” to be
So, the simple answer to your question is, ‘Yes’.
However, like all simple answers, that ‘yes’ requires some expansion.
It ignores
(a) The cause(s) of the overall warming trend.
(b) The cause(s) of the periods when the trend ‘flattens’.
And
(c) The dissimilarity of the periods of ‘flattening’.
Importantly, SkS presents the ‘escalator’ as being a demonstration that the present period of ‘flattening’ is not an indication that the overall warming trend is mostly or entirely induced by natural climate variation. But their demonstration is false. I explain this as follows.
SkS (and e.g. renewableguy in this thread) assume the overall warming trend is mostly or entirely induced by increased atmospheric CO2 concentration. And that assumption is improbable for several reasons.
The overall warming trend is most likely a recovery from the Little Ice Age (LIA), and there is no reason to suppose the LIA was caused by change to atmospheric CO2 concentration. Simply, the LIA is an observed natural variation of unknown cause but the cause was not observed variation to atmospheric CO2 concentration. The Null Hypothesis and paucity suggest that whatever caused the LIA is the probable cause of recovery from the LIA (e.g. the LIA was coincident with the Maunder Minimum in solar activity: if it is assumed that the start of the Maunder Minimum induced the LIA then recovery from the LIA is a result of the end of the Maunder Minimum).
Importantly, it has been claimed that the overall warming trend is too large for it to have been caused by natural variation other than variation caused by increased atmospheric CO2 concentration (this claim is not true, but an explanation of why the claim is false is not relevant here).
Atmospheric CO2 concentration has been increasing exponentially. If it is assumed that the CO2 increase causes the overall warming trend then the periods of ‘flattening’ demonstrate that natural variations can overwhelm the warming effect of the CO2. This is a conclusive demonstration that natural variation has at least as great an effect on global warming/cooling as atmospheric CO2 concentration.
So,
the recent overall warming trend could be entirely a result of recovery from the LIA
but
the unknown cause of the LIA was not altered atmospheric CO2 concentration
and
the recovery from the LIA is most likely a cessation of whatever induced the LIA
while
the natural variability is observed to be sufficient to overwhelm the warming effect of increased atmospheric CO2 concentration.
Which brings us to the periods of ‘flattening’ in the warming trend.
Firstly, these periods may be apparent and not real. The measurement data are sparse so the global temperature derivations have little confidence. Hence, values of trends in global temperature over short periods could be ‘noise’ provided by the uncertainty in the data and, therefore, these trends may indicate nothing about reality. Importantly, prior to the now present period of ‘flattening’, SkS and others were claiming such short-period-trends are ‘noise’. Indeed, they needed to claim that because – if they are real – the periods of ‘flattening’ demonstrate that natural variability can overwhelm the warming effect of increasing atmospheric CO2 concentration.
However, the present period of ‘flattening’ now exceeds 15 years and the claimed certainty of the data does not allow the trend of such a long period to be ‘noise’; i.e. the present ‘flattening’ is real and not ‘noise’.
The ‘escalator’ attempts to show the present ‘flattening’ is similar to the previous ‘flattenings’. Either it is or it is not. But, whichever of these possibilities is true then it does not support the SkS assertions of the overall warming trend being a result of increased atmospheric CO2 concentration.
1.
If the periods of ‘flattening’ are real then they indicate the overall warming trend can be overwhelmed by natural climate variation.
2.
If the previous periods of ‘flattening’ are ‘noise’ then the present period of statistically significant ‘flattening’ indicates the overall warming trend is being overwhelmed by natural climate variation.
In either case, such large effect of natural climate variation provides the probability that the overall warming trend is mostly or entirely natural recovery from the LIA.
Add to that the fact – as Bob Tisdale’s article points out – that the trends in the SkS ‘escalator’ are false and one can only conclude that the SkS escalator is deliberately misleading propaganda.
And all of the above assumes that linear trends indicate anything about the global temperature time series. In reality the time series indicate several overlaid cycles which need to be understood and modelled for any true trends to be discerned, and those true trends would not be linear.
Richard
zzzzzzzz
Opps.
Death threats? Seriously?
Look, I agree with the Rahmstorf paper because it extents their past work in a logical direction and seems quite reasonable, at least to me. I disagree with the Tisdale stuff because it seems that he cant or doesnt explain where the heat comes from in the last 30 years. One being readable helped, my patience these days is short for poor writing.
Those who hit the modelers for changing their models, what are you smoking? That’s what they do! What are you thinking? Maybe they should keep using those old bad models because they they had a really good smell to them? Should we use weather prediction models from the 50s so Sandy could have killed more people?
You can hit peer review all you wish, but at a minimum it would have made Tisdale stuff readable, which the blog here has failed at.
On how the science community regulates it’s own self, lots has been written and lots has been said. But in the end, the only ones that are able to distinguish good work from excellent work are the scientists, evil, sinister, or whatever. (Based on the comments last week from a GOPer hopeful about the age of the earth, we need to stay as far from politicians as we can!)
On scientific misdeeds, it happens but it is really rare. I actually have never met a person with a retraction, but a friend of mine had a friend who knew someone who did. I think. I don’t wish to brag, but how many professions get critical reviews when the retraction rate is at 40 retractions per 100,000 articles — 0.04%? (And dont compare us to the priesthood, where about 1 to 2 percent of them have abused children, at least in the US.)
In the end, if you believe the Rahmstorf paper to be in error, who of you plan to write the editor? That’s what you are supposed to do, not whine about it in a blog. So get to it.
REPLY: That applies to you to Don, since you are here – Anthony
trafamadore says: @ November 29, 2012 at 8:16 pm
Does peer-reviewed literature tell your doctor that a new drug has come out that might save someone close to you? Tsk, tsk, poor, misled fellow. Dont do it! Quickly, stick your head in the sand because the death of someone close to you is natural.
___________________________________
Don’t try that one on me
I sure as heck wish my Mom had ignored the @#$!@ doctor with his *@#$!@ new drug. The drug killed her but since it cause heart attack after heart attack (Known according to the peer-reviewed lit.) and she died from that side effect the ‘drug test’ was considered a HUGE “success” in the paper he was writing.
I was still in school and did the research and found the drug caused heart attacks. Unfortunately the doctor giving her the drug was a ‘specialist’ and knew nothing about the heart so he would not take her off the drug. Her heart specialist knew nothing about the new drug therefore would not take her off the drug and a consultion at Sloan Kettering had them backing away from their initial opinion after talking the the ‘Doctor’
When I finally convinced Mom to quit taking the drug it was too late she died within a week.
The doctor who killed her was known among his colleagues as “The Butcher” and the hospital a year later was ‘featured’ on 60 minutes because of the horrendous number of ‘excess’ deaths. It was a University ‘teaching’ Hospital.
trafamadore:
At November 28, 2012 at 1:30 pm you wrote
Now, at November 30, 2012 at 10:51 am, you write
I get that. You say you think that papers can only be assessed by “the scientists”, and in this case “the scientists” are climate scientists of whom you say are not one.
OK. That explains why you have repeatedly ignored my question which asks you if you have anything to say in defence of the paper by Rahmstorf and Foster by way of refutation of the criticisms of it by Bob Tisdale. You cannot address the subject of this thread because – you say – you are not one of “the scientists” competent to assess it.
It would have helped if you had admitted from the start that you felt you were incompetent to address the subject of this thread instead of trolling the thread with every irrelevance you could imagine.
Richard
trafamadore:
You seem to complain about Tisdale being unreadable. Can you be more specific? Perhaps his point of view is too disagreeable and you just can’t swallow enough meaning in order to understand what he is saying.
Thank you all for commenting. This thread will be quite enlightening when people stop back.
Regards to all.
trafamadore says:
November 30, 2012 at 10:51 am
That’s what they do! What are you thinking? Maybe they should keep using those old bad models because they they had a really good smell to them? Should we use weather prediction models from the 50s so Sandy could have killed more people?
You raise many interesting questions. The problem is that they do not really discard the models that simply do not work. They simply move the goal posts to make it seem as if their models are still good, but just need some minor tweaks.
I do not know if you are familiar with Ptolemy’s epicycles and other attempts to explain why planets sometimes go faster or slower and why they even seem to go backwards at times. It got extremely complex and still did not answer all questions. Then when Kepler came up with ellipses, much was explained. (And later Einstein expanded on Kepler.) In my view the warmists are like the people who cannot recognize when their theory is completely flawed and when confronted with new evidence, they do NOT embrace a new Kepler. What they do is try to add more ‘epicycles’ to make a flawed theory work.
Thank you very much for:
richardscourtney says:
November 30, 2012 at 10:42 am
On another blog I commented as follows:
So where are we now? With 15 years, we are 95% certain something is wrong. And according to Santer, if I have it right, at 17 years we are 100% certain something is wrong. And with RSS having 0 slope for 15 years and 10 months, we must be around 97% certain something is wrong.
I wonder if the same technique can be used to show that the current warming trend is consistent with a linear cooling trend since the Holocene optimum.
http://en.wikipedia.org/wiki/File:Holocene_Temperature_Variations.png
I am still hoping someone does a nice job of applying the SKS escalator graphic to 8000 years of Holocene cooling. My attempt was pathetic.
Who Turned on the Heat — 561 Pages!?!?!?!?
At least there are lots of graphics.
richardscourtney says:
November 30, 2012 at 10:42 am
Firstly, in 2009 the US National Oceanographic and Atmospheric Administration (NOAA) reported at
http://www1.ncdc.noaa.gov/pub/data/cmb/bams-sotc/climate-assessment-2008-lo-rez.pdf
on page 123:
The simulations rule out (at the 95% level) zero trends for intervals of 15 yr or more, suggesting that an observed absence of warming of this duration is needed to create a discrepancy with the expected present-day warming rate.
Can’t find it there, try again please.
richardscourtney says:
November 30, 2012 at 4:55 am
Importantly, an Editor may choose to not put a paper to peer review if he/she perceives that its contents will be blocked by the vested interests of a powerful consensus group. For example, knowing there was such a prejudice of all potential reviewers, the then Editor of Nature published two papers by an incompetent patents clerk without putting the papers to peer review. Those papers on relativity by Albert Einstein initiated a revolution in physics.
Publishing those papers without peer review gave Nature a degree of credibility as a scientific journal on which it relies to this day.
As usual not very accurate when it comes to facts, Richard.
Einstein published his Annus Mirabilis papers in Annalen der Physik (he’d published there before), not Nature!
Also they weren’t exactly not peer reviewed, Einstein submitted his papers to Planck who forwarded them for publication, that’s a real peer review.
Needless to say Einstein’s publication in A der P did nothing for Nature’s reputation although it did temporarily boost Annalen’s reputation as the foremost german language physics journal.
Phil. says:
November 30, 2012 at 5:33 pm
on page 123:
That should be page 23, in the middle column in the blue part. However since page 23 is not numbered, you have to go to page 24 and scroll back up a page.
Regarding “Rest of World” temperature hardly dipping from the 1989 and 2000 La Linas, have a look at the pink curve in Figure 1. Global temperature dipped in these years, even if ocean temperature outside the East Pacific largely did not.
My biggest complaint of Figure 1 is not the attempt to detrend ENSO – the difference between the pink and red curves in the La Nina years of complaint indicates to me this actually largely works. My complaint is that the large slope of about .17 degree/decade is from not detrending for AMO, which is known to affect global temperature and probably contributes to the periodic component that is visible in HadCRUT3. After detrending for the periodic component visible in HadCRUT3, the linear trend from 1980 to 2011 would be about .115 degree/decade.
trafamadore,
The rising “linear trend” is the only impression they want the reader to take home, they don’t want the reader to understand it. Projections, predictions. Whatever. They want to avoid it being called that when it is wrong, but still wish to draw an arbitrary, continuously rising linear trend line so they can say “Look: Consistent with models”. They are arguing from what the temperature might have been, not what it is or was.
Phil:
At November 30, 2012 at 5:33 pm you wrote
“Can’t find it there, try again please.”
You are right. I made a misprint when I wrote “page 123”. I intended “page 23”. Sorry.
Indeed, I need to be very specific to avoid further knit-picking of your usual kind.
The quotation is actually in an explanatory box so you need to go to page 24 the scroll back.
I am truly sorry for my misprint of the page number which I feel certain means you will claim invalidates the quotation.
Richard
Phil.:
At November 30, 2012 at 5:59 pm you provide your usual inaccurate knit-picking and assert I am “not very accurate on facts” (which is laughable coming from you).
It seems you have picked up the baton of irrelevant distraction from trafamadore. My advice is that you don’t bother because your track record shows you are even less competent at it than he is.
For example, in your post I am answering, you say Einstein had his work “peer reviewed” because he asked Plank to comment on it. Well, according to that criterion, Tisdale has had much more peer review of his work because he has put it on the internet for everybody to comment on it.
The subject of this thread is a review of the ridiculous paper by Rahmstorf&Foster.
Address the criticisms of the Rahmstorf&Foster paper or go away.
Richard
Donald L. Klipstein says: “Regarding ‘Rest of World’ temperature hardly dipping from the 1989 and 2000 La Linas, have a look at the pink curve in Figure 1. Global temperature dipped in these years, even if ocean temperature outside the East Pacific largely did not.”
Using any global dataset can be misleading. The object of this post was to show that some portions of the globe respond proportionally to La Nina events (East Pacific), while the vast majority of the globe does not. Because the vast majority of the globe does not cool proportionally during all La Ninas, Rahmstorf et al cannot attempt to remove the linear effects of ENSO. They’ve left a very obvious ENSO residual that accounts for much of the warming seen over the past 30 years.
With respect to your comment about the AMO, I will agree in part. However, detrended North Atlantic sea surface temperature anomalies also diverge from the ENSO index (fail to cool proportionally) during those La Niña events. I’ve never seen this addressed specifically in any papers about the North Atlantic or the AMO.
http://i48.tinypic.com/2vhtcev.jpg
Regards
RobertInAz says: “Who Turned on the Heat — 561 Pages!?!?!?!?”
I assume that means you’ve purchased a copy. Thanks.
richardscourtney: It seems you have picked up the baton of irrelevant distraction from trafamadore.
When you are wrong on the details that you have introduced into the discussion, you ought to admit it and apologize. If someone with the stature of Planck recommends publication of Bob Tisdale’s work in the peer-reviewed literature, I am sure it will be published. Since you claimed that Einstein’s paper had not been peer-reviewed, you ought to admit that you were wrong. You ought not to refer to a detail that you introduced into the discussion as a “nit”: if it’s an irrelevant detail, instead you ought to apologize for introducing it.
To Bob Tisdale: I have been planning to buy you new book, but thought I should first clean out my hard drive climate library to ensure I comfortably have enough space for it. Now I see (as you and RobertInAz point out) it is 561 pp. with lots of graphics. Could you give me a rough ballpark as to the total megabytes invoved in the download upon purchase?
richardscourtney says:
December 1, 2012 at 1:54 am
Phil.:
At November 30, 2012 at 5:59 pm you provide your usual inaccurate knit-picking and assert I am “not very accurate on facts” (which is laughable coming from you).
Well you raised the subject of the reviewing of Einstein’s papers and got almost everything about it wrong so as everyone can see you were completely inaccurate on the facts I guess we should be thankful that you spelled his name right? Getting the name of the journal wrong is a rather basic error! You also sought to imply that Einstein was a complete unknown whereas in fact he had already published in Annalen (5 papers before 1905). Also you said “For example, knowing there was such a prejudice of all potential reviewers, the then Editor of Nature published two papers by an incompetent patents clerk without putting the papers to peer review.” This is a complete fabrication, peer review was not the rule then and since Einstein submitted his papers via Planck no such thoughts would be entertained by Drude (the editor). Also Einstein had a Doctorate, indeed, one of the 1905 papers was his thesis and was the work for which he was later awarded the Nobel prize
It seems you have picked up the baton of irrelevant distraction from trafamadore. My advice is that you don’t bother because your track record shows you are even less competent at it than he is.
For example, in your post I am answering, you say Einstein had his work “peer reviewed” because he asked Plank to comment on it. Well, according to that criterion, Tisdale has had much more peer review of his work because he has put it on the internet for everybody to comment on it.
I agree with Matthew if anyone is guilty of ‘irrelevant distraction’ it is you and comparing Max Planck to the readership of WUWT is ridiculous. Quality beats quantity in this case. In your usual style you didn’t answer my post, you rarely do in fact, you just pout.
The subject of this thread is a review of the ridiculous paper by Rahmstorf&Foster.
Address the criticisms of the Rahmstorf&Foster paper or go away.
Now you’ve corrected your typo so that I can now see the context of your previous quote I might do so. If it were your blog you could issue orders, but since it isn’t consider yourself ignored.
Matthew R Marler:
At December 1, 2012 at 8:31 am you write to me saying
I was clearly, unambiguously and entirely right, not wrong.
The issue was ‘peer review’ for publication; i.e. the selection by a journal Editor of reviewers who provide him/her with advice on whether or not to publish a paper submitted for publication.
The issue was NOT the provision of a paper by its author for comment by other scientists.
At December 1, 2012 at 1:54 am I wrote
That is true.
You have asserted, “When you are wrong on the details that you have introduced into the discussion, you ought to admit it and apologize”.
I await your apology.
Richard
Phil.:
Your content-free diatribe at December 1, 2012 at 2:36 pm (which attempts to divert from thew subject of this thread) concludes by saying to me
O dear! That puts me on a par with you! I never thought I could sink that low.
Richard
ridhardscourtney: I await your apology.
lol!
You were just plain wrong.
Matthew R Marler:
I was just plain RIGHT and you have not stated any way in which there was any error in what I said.
Onlookers can see that for themselves so I fail to understand why you try to pretend otherwise.
Richard
Leigh B. Kelley: Sorry for the delay getting back to you. Who Turned on the Heat? is about 23MB in pdf form.
To Bob Tisdale: Thanks Bob! With a bit of pruning, my old machine can handle that. I wish that more people would read your account (or read it with more care). I have not found the basic outline at all hard to understand. If correct, your account is devastating to the basic IPCC metric for AGW, global mean near surface air temperature, but that was their choice. And of course, if the new metric were to change to OHC with all or a substantial part of the GHG heat mixing into the deep ocean, that has its own severe problems (and not just in terms of uncertainties in the measurements!).
Leigh B. Kelley says: “With a bit of pruning, my old machine can handle that.”
I’m glad I didn’t publish it only in Kindle form. The file size is then 55MB. One of these days I may publish it that way, maybe next year.
richardscourtney says:
December 2, 2012 at 6:00 am
Matthew R Marler:
At December 1, 2012 at 8:31 am you write to me saying
When you are wrong on the details that you have introduced into the discussion, you ought to admit it and apologize. If someone with the stature of Planck recommends publication of Bob Tisdale’s work in the peer-reviewed literature, I am sure it will be published. Since you claimed that Einstein’s paper had not been peer-reviewed, you ought to admit that you were wrong.
I was clearly, unambiguously and entirely right, not wrong.
No you weren’t, first of all you got the journal wrong, a basic error particularly for two of the most famous papers in modern physics!
The issue was ‘peer review’ for publication; i.e. the selection by a journal Editor of reviewers who provide him/her with advice on whether or not to publish a paper submitted for publication.
The issue was NOT the provision of a paper by its author for comment by other scientists.
Again you were wrong, ‘peer review’ is the review of papers prior to publication by knowledgable peers in the field. The model you described is not the only one and was certainly not the only one used in the past. You said that the editor of Annalen der Physik, Drude, himself a professor of physics, “knowing there was such a prejudice of all potential reviewers, the then Editor of Nature (sic) published two papers by an incompetent patents clerk without putting the papers to peer review”, this is untrue, their usual reviewing procedure was followed as it had been for Einstein’s previous publications in that journal. It was commonplace for authors to submit their papers via a peer, in this case Planck, for review prior to submission to the journal, certainly Drude receiving a paper from Planck with a recommendation to publish would not seek out further reviews! This procedure was followed as recently as the 1970s by the Proceedings of the Royal Society, you would submit your paper to a FRS asking him to review it for Proc Roy Soc, this was a stronger form of review than the anonymous reviews since when the paper was published the Fellow’s name was added below the title line, so his reputation was on the line too!
As usual when caught out in an error you refuse to address the error and instead resort to ad hominem attack and bluster and in this case even state that you made no errors, do you still think that these papers were published in Nature?
herefore, I write to spell-out the issues which you raise when you write, “all times were less than 15 years”.
And I’m writing to point out the mistake you have made.
Firstly, in 2009 the US National Oceanographic and Atmospheric Administration (NOAA) reported at
http://www1.ncdc.noaa.gov/pub/data/cmb/bams-sotc/climate-assessment-2008-lo-rez.pdf
on page 123: actually 23
“The simulations rule out (at the 95% level) zero trends for intervals of 15 yr or more, suggesting that an observed absence of warming of this duration is needed to create a discrepancy with the expected present-day warming rate.”
NOAA said that in 2009 and, Werner, you show that there has now been “zero trends for intervals of 15 yr or more” so there is a “discrepancy” between what the models predict and “the expected present-day warming rate”.
Yes they said that but the context is important, which why I asked for the correct reference.
There I found out what Richard had omitted which completely changed the meaning. The full quote is as follows:
“ENSO-adjusted warming in the three surface temperature datasets over the last 2–25 yr continu-
ally lies within the 90% range of all similar-length ENSO-adjusted temperature changes in these simulations (Fig. 2.8b). Near-zero and even negative trends are common for intervals of a decade or less in the simulations, due to the model’s internal climate variability. The simulations rule out (at the 95% level) zero trends for intervals of 15 yr or more, suggesting that an observed absence of warming of this duration is needed to create a discrepancy with the expected present-day warming rate.”
The statement only applies to temperature histories from which the ENSO effect has been removed (i.e. ENSO-adjusted), it does not apply to to unadjusted histories unlike Richard is trying to claim! The R & L paper shows that we are not in a zero trend period of 15yrs+, if you don’t trust this paper’s analysis you need to find a different ENSO-adjusted history (perhaps the method of Thompson et al.) if you wish to apply the NOAA statement.
Phil. says:
I agree with you; the entire discussion there seems to involve the ENSO-adjusted data. However, I think there is also an additional problem with Richard’s claim: I read the statement from Santer et al as saying that a trend of zero lies outside the 95% confidence cone on the trend for the climate model simulations for 15 year periods. [From where they have put the parenthetical remark “(at the 95% level)” this seems to me like the correct way to read it.]
What Richard has done is changed the goalposts from what Santer et al. set out as the criterion: Yes, it may be true that the actual trend in the data may itself have a 95% confidence cone that includes the possibility of zero trend. But, that is not the same thing as saying that the actual computed value of the trend is zero. It is in fact positive.
Well at least Bob Tisdale has a mechanism to explain warming. But it almost certainly wrong.
As for the 15 years for global warming, lets just forget that and use 1995 as a start date for all future “no warming since…” claims. Anyway, since Bob has a mechanism to explain warming, why would you guys want to say there wasn’t any?
BTW, have there been any statistically significant periods of global cooling in the past 60 years?