The Impact of Sandy on Sea Surface Temperature Anomalies Along Its Track
Guest post by Bob Tisdale
We’ve established in recent posts that, based on linear trends, the sea surface temperature anomalies along Sandy’s storm track haven’t risen in 70+ years and that there was nothing unusual about the sea surface temperature anomalies there during October 2012. And we’ve established and discussed for years that there is no anthropogenic global warming component in the warming of global sea surface temperatures or ocean heat content.
Yet activist websites continue to post climate change alarmist nonsense in Sandy’s wake. See examples here, here and here. And they call themselves realists. They must think Salvador Dali’s paintings were realistic. Refer to the discussion of Dali’s The Persistence of Memory. MOMA notes that “Dalí painted this work…he said, ‘to systematize confusion and thus to help discredit completely the world of reality.’” I read that and instantly thought of Joe Romm at ClimateProgress and John Cook at SkepticalScience.
I’m tired of responding to their drivel, so this is an informative post.
It presents the impacts of Sandy on the sea surface temperature anomalies, using the storm track data for the week centered on Wednesday October 24th, which, due to data availablity, we’ll have to consider the week during Sandy, and the week of October 31st, which will be the week after.
Like El Niño events, tropical cyclones (hurricanes) are one of Mother Nature’s ways of transporting heat from the tropical oceans toward the poles. These processes allow the heat to be radiated into space more readily at higher latitudes and they also help to reduce the temperature differences between the tropics and the poles that would exist without them. Sandy was a prime example of those processes at work. It drew enough heat from the western North Atlantic to cool the sea surface temperature anomalies about 1.0 deg C along the storm track (12N-40N, 80W-70W). See Figure 1. Sea surface temperature anomalies were near their seasonal high the week of October 24th (during the storm). A week later, the week of October 31st(after the storm) they were about 1.0 deg C cooler.

Figure 1
Keep in mind, though, that the storm track is a reasonably small portion of the global oceans. As such, weekly sea surface temperature anomalies there can be very volatile. Figure 2 illustrates the weekly change in sea surface temperature anomalies (Week “n” Minus the Week before “n”) since the start of this portion of the weekly Reynolds OI.v2 data, January 3, 1990. As shown, weekly changes of 0.4 deg C occur regularly. Even changes of near 0.6 deg C have occurred 4 times. The drop in response to Sandy, however, was freakish—the combined aftereffects of a number of factors that contributed to the storm—and obviously not part of some new normal.
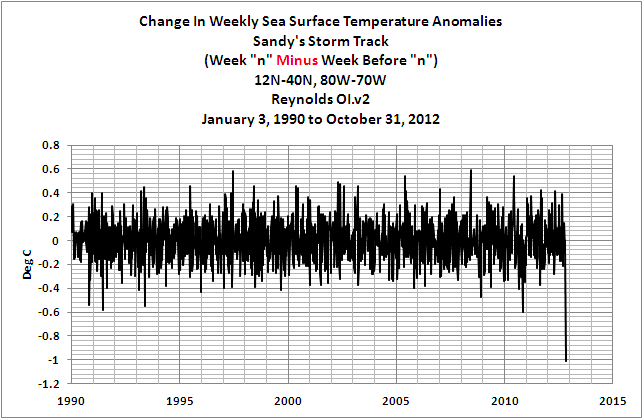
Figure 2
The greatest drop in sea surface temperature anomalies occurred in the extratropics, Figure 3. This should be after Sandy merged with the cold front and became a large extratropical (baroclinic) cyclone (with a small hurricane in the center?).

Figure 3
SOURCES
The Sea Surface Temperature anomaly data used in this post is available through the NOAA NOMADS website:
http://nomad1.ncep.noaa.gov/cgi-bin/pdisp_sst.sh
or:
http://nomad3.ncep.noaa.gov/cgi-bin/pdisp_sst.sh?lite=
Nice post, Bob. I was a bit boggled by the title, thinking “well, doh, hurricanes are a heat-exchange (cooling) mechanism.” OK, we agree…
Nice. Thanks Bob.
Wow, that is such a big outlier, I would think something is wrong with the data.
Thanks, Anthony.
Like a slush ball hitting the coast, dissipating on contact. Thank you, Bob.
Nice post, Bob..
I’m somewhat disappointed not to see a composite satellite thermal image of the hurrican/storm track. Perhaps it was too cloudy.
As I understand it, a low pressure zone is one with rising air, which removes heat from the ocean by evaporation. Evaporation leads (eventually) to cloud formation whch increases albedo, reducing insolation on the ocean’s surface and its take-up of solar energy.
But I still can’t figure out (calculate) when that reduction in energy causes the “collapse” of the low pressure zone. (Ignoring landfall.)
So, to cool the oceans, we need more hurricanes?
Quite an upwelling post.
Thanks Bob!
Here’s a link that goes to SST maps before and after Sandy. Generally you can see the track of passed hurricanes as a cool streak in the warmer water, this time Sandy was so wide that it cooled a huge area:
http://deepseanews.com/2012/11/a-recap-of-hurricane-sandy-the-ocean-version/
There are also images showing how much vertical mixing there was in the water under Sandy.
Bernd Felsche says:November 11, 2012 at 5:24 pm
I’m somewhat disappointed not to see a composite satellite thermal image of the hurrican/storm track.
Look at the ocean page under Reference Pages above, second graph shows SST still very cool along the storm track.
It’s worth noting that the extra tropical area was already cooling strongly before the storm hit
http://nomad1.ncep.noaa.gov/cgi-bin/pdisp_sst.sh?ctlfile=oiv2.ctl&ptype=ts&var=sst&level=1&op1=none&op2=none&day=03&month=oct&year=2012&fday=07&fmonth=nov&fyear=2012&lat0=25&lat1=30&lon0=-80&lon1=-70&plotsize=800×600&title=25N-30N+70W-80W&dir=
yet the tropical part was warming strongly having gained about +0.5 degrees in the previous two weeks:
http://nomad1.ncep.noaa.gov/cgi-bin/pdisp_sst.sh?ctlfile=oiv2.ctl&ptype=ts&var=sst&level=1&op1=none&op2=none&day=03&month=oct&year=2012&fday=07&fmonth=nov&fyear=2012&lat0=10&lat1=15&lon0=-80&lon1=-70&plotsize=800×600&title=25N-30N+70W-80W&dir=
Matthew W says: So, to cool the oceans, we need more hurricanes?
Yep, that’s why there are more hurricanes during warmer periods of climate. All part of negative feedbacks that keep climate stable.
http://i49.tinypic.com/xbfqtw.png
We are at the peak of a 30 year NATURAL warming cycle, that’s why there is more cyclone energy in the system.
This is not “the new normal” it’s the OLD NORMAL, NORMAL.
this is how climate is supposed to work.
The fun is just beginning. As Obama will leverage AGWphobia any way he can to help realize his anti free enterprise agenda, look for much more of such nonsense. I forecast a whole lot more propagandizing. Proponents don’t care if they are wrong so long as the AGW narrative is promoted and there is no one with authority who care/dare to hold them accountable. What we have here is a political movement seeking legitimacy using the reputation of science via a corrupt academy.
P. Solar says:
November 11, 2012 at 6:23 pm
“ . . . , that’s why there is more cyclone energy in the system.”
It’s been a tiring weekend so maybe my synapses are not snapping rapidly enough to find the compatibility between P’s statement (above) and the downtrend of ACE as reported by Ryan Maue here . . .
http://wattsupwiththat.com/2012/10/01/dr-ryan-maue-releases-new-hurricane-frequency-data-showing-a-negative-trend-in-the-last-30-years/
On another note, a lot of cold temp records will be set in California tonight and tomorrow night. With dew points in the low 20s, a cold airmass in place, and excellent cooling conditions in place, the previous record lows in the upper 30s are sure to be broken if not shattered.
Seems the Gores, Manns, Hansens, Trenberths, Jones, and Gavin Schmidts of our reality are having a very difficult time! Their reality, i.e. inside their brains, is not the reality that we other humans perceive. When they look at the world around them they see a War Zone, a cataclysmic conflagration, destruction, wonton killing for no reason, debauchery. Yet, looking out my window I see nothing of this! Nothing at all! Could it be the drugs (?) the Gores, Manns, Hansens, Trenberths, Jones and Gavin Schmidts of our world are abusing, injecting, hour by hour, day by day, month by month?!
Such abusive behavior is very appalling, disgusting, and very telling about them!
Well, that may well be the state of the … Anthropocene Mann. A nonexistent thing I might say.
[snip]
That is the Anthropocene.
Great work Bob; and your irritation at the antics and lies of the pro-AGW spruikers is entirely justified.
Very interesting about the new low temps in California. So when a denier (warmist denying cooling) repeat the mantra that Sandy was due to warming temperatures, I can refer to new low temperatures should be an indicator of something also. they will probably say that , “yes, that due to global warming”, because they are repeat robots.
See Figure 1. Sea surface temperature anomalies were near their seasonal high the week of October 24th
There is no seasonality to anomalies. Reynolds calculates anomalies on a monthly basis. So the anomaly for a month is the difference from the average of that month over the reference period.
What Figure 1 shows is that 2012 had more summer warming than the reference period average. This has happened for the last 2 or 3 years and is also seen in the satellite temperature data. The East coast of North America and the East coast of Asia both show significant summer SST warming.
The cause is likely increased solar insolation from decreased (primarily urban) aerosols.
John F. Hultquist says:
I was wondering the same thing.
What implications will this cooling have on this season’s winter? How much heat was removed?
@ Don: November 11, 2012 at 8:05 pm
No…….they’ll just say it’s weather…./s
@ DR: November 11, 2012 at 8:37 pm
“What implications will this cooling have on this season’s winter? How much heat was removed?”
About this much:
http://stevengoddard.wordpress.com/2012/11/11/visualizing-the-effects-of-missing-arctic-ice/
You should read those little explanatory notes next to Dali’s paintings next time you are at the museum… they can be very instructive 😉
I haven’t read all your recent posts, Bob. How is this data collected at the surface? Is it from Argo floats that were in the path of the storm, and if so is there any data on how deep the effect goes?
Thanks.
The goal or purpose of this post is unclear, because it is not stated. The author seems to know the audience here, and appears to accept as understood that his presentation of data will convince readers that AGW is false. Because the message is so unclear, what follows will refute the author’s apparent conclusion– the one that can be roughly gleaned from the article.
Mr. Tisdale here seems to gloat over some sort of (inferred) slam-dunk victory with “scientific” analyis– measured by temperature anomalies in the hurricane Sandy storm track– over established evidence that weather will be more extreme as global warming accelerates. It clearly fails that goal. (And again, if that is not the goal, the writer should write more clearly. And bring pertinent science to the argument.)
It merely shows that temperatures fell along the track. It doesn’t show any reason why, although one might infer the storm brought colder water to the surface. But to claim that an unexplained temperature anomaly invalidates AGW is a non sequitur. It makes no sense because it is not related to the premise it appears to refute.
Only true believers in the AGW denialist movement (religion) might make a contorted leap of faith to assume the data presented refutes global warming. That’s because they won’t critically examine the data vis a vis the argument to see if they match.
As evidence of the lack of critical thinking ability in some of this audience, look at Jack’s post. He assumes Obama has some kind of anti-free enterprise agenda. WTF?? This is a wacko, Tea-Partyesque, bizarre conclusion direct from alternate universe (i.e., conservative) media. Like so many posts and comments here, it has no basis in fact.
Oddly, one of the web sites posted as an “alarmist” argument for AGW was a mockup video of a monster destroying houses with wry commentary by observers. What does this have to do with global warming and climate change? What does prove? It is an inane, useless link.
Other links cited as alarmist make the connection between severe weather events and climate change. Does anyone believe this post authoritatively refutes the well-established evidence for those claims? News for you: it does not.
Furthermore, the title referring to an inverse hockey stick conflates the issue of long term planetary temperature increases (Mann’s hockey stick graph) with a short term ocean temperature anomaly in a very small region. This is not only bad science, it is poor logic. What is its purpose, if not merely to inflame the rabid support of those who do not understand the issue???
If those who post on websites like this want to refute the massive evidence for human-caused climate change, they had better come up with clear communications and viable evidence for their arguments. And the evidence had better be good enough to convince every major scientific organization on the planet. It has not so far. That can only mean a severe lack of rigor in the science and the evidence presented by climate change skeptics. This post is a sterling example of that lack of scientific rigor.
The post merely added noise to the argument. I fully expect the author to take this as a personal insult, but it is not. So will the many attack dogs here who, following their religious leaders, do not understand scientific criticisms, but will also take them as personal attacks. Go ahead–but realize science is above and apart from all that. Just go with real science, and you can’t go wrong.
It is vital to call out junk science when it purports to have bearing on a vital scientific issue like climate change. Again, if it isn’t completely clear:
Mr.Tisdale’s post offers nothing to advance any scientific debate on global warming or climate science. It is difficult to fathom the many notes of congratulations in the face of that fact.
The caption to the photo at deepseanews states:”Sea surface temperatures before and after Sandy hit land. As Sandy moved northward it mixed colder deep water up, causing widespread cooling of the surface ocean off the Mid-Atlantic coast.”
I thought the hurricane sucks its energy from the ocean surface, and that is the mechanism for the cooling.
EJ
Figure 2 looks like a chart of daily changes in a stock market indices. Wonder what the power-law distribution of SSTs (or other climate phenomena) is (or if there is such a distribution). Certainly David Orrell uses earthquakes and ENSO to highlight similarities between such natural phenomena and financial markets.
From the post “…These processes allow the heat to be radiated into space more readily at higher latitudes…” This must mean that those “bad” GHGs are the cause for cooling from said latitudes at certain elevations.
Deny, deny, deny. Bob Tisdale really wants another Sandy against an unprotected coast. Guess what. I agree.
Because no-one’s gonna care about the next Sandy drowning two million in Bangladesh.
Hey mods, snip it! Climate Revisionist’s Violation!
michael hart says: “I haven’t read all your recent posts, Bob. How is this data collected at the surface?”
Reynolds OI.v2 is primarily a satellite-based sea surface temperature dataset, with buoys and ship-inlet measurements.
EJ: Tropical cyclone apparently draw so much heat from the surface that they can impact the top 60 meters. Well, at least they typically need warm water to depths of 60 meters in order to form:
http://www.ems.psu.edu/~nese/ch11sec3.htm
“The farther backward you can look, the farther forward you are likely to see.” Winston Churchill
Tshane3000 says:
November 11, 2012 at 11:19 pm
…
Only true believers in the AGW denialist movement (religion) might make a contorted leap of faith to assume the data presented refutes global warming. That’s because they won’t critically examine the data vis a vis the argument to see if they match.
As evidence of the lack of critical thinking ability in some of this audience, look at Jack’s post. He assumes Obama has some kind of anti-free enterprise agenda. WTF?? This is a wacko, Tea-Partyesque, bizarre conclusion direct from alternate universe (i.e., conservative) media. Like so many posts and comments here, it has no basis in fact.
In turn, let me ask quietly just what actual evidence do you have that ANY member or any policy of the Obama administration is pro-business, pro-free-enterprise, pro-growth, or pro-economic? His subsidies have gone directly to his union supporters and their pension plans, to government workers, to his welfare receivers, and to the foreign owners of the the companies that have paid him money to get elected and re-elected. His “green energy” program have gone to the owners of now bankrupt compnies, all owners who FIRST paid him campaign contributions.
No part of his “economic plan” has worked. Will work. Has ever worked worldwide – but (you!) want it to persist because of your hatred and greed and envy of those who are successful by their work.
You have thrown out your hatred and prejudices into this web site, but offer nothing and no evidence backing up any of your statements about Obama, his supposed “science” .. At best, you can only claim the “consensus” of 72 out of 3500: all 72 who are government-paid “scientists” who desire more power, control, and tax money for their government sponsors.
Tshane3000 says: “The goal or purpose of this post is unclear, because it is not stated.”
It is stated. You must not have read or understood the post.
Tshane3000 says: “The author seems to know the audience here, and appears to accept as understood that his presentation of data will convince readers that AGW is false… Mr.Tisdale’s post offers nothing to advance any scientific debate on global warming or climate science. It is difficult to fathom the many notes of congratulations in the face of that fact.”
The remainder of your entire comment suggests you haven’t read or understood the post. This post has nothing to do with AGW. This post simply shows the drop in sea surface temperatures in response to Sandy. Nothing more. But if you’d like to read the posts that dispute the existence of an AGW signal in sea surface temperature data, use the search function near the top of the page and search for my last name. Or if you can wait a few days, I’ll be providing an hour-long presentation about that on the WUWT-TV special.
Have a nice day.
Philip Bradley says: “There is no seasonality to anomalies.”
Actually, there is. You can see the seasonal component in SST anomalies in any long-term sea surface temperature anomaly animation:
Which is one of the reasons I use maps of 12-month average SST anomalies in animations such as this:
http://bobtisdale.files.wordpress.com/2012/02/east-indian-west-pacific-97-thru-012.gif
And you can see the seasonal component in the hemispheric sea surface temperature anomaly graphs:
http://bobtisdale.files.wordpress.com/2012/11/5-no-hem.png
and:
http://bobtisdale.files.wordpress.com/2012/11/6-so-hem.png
Thanks Bob. Sounds like sense to me.
Remember how people made such a big deal about the size of Sandy. If you take a look at the remnants of winter storm Brutus you’ll it stretches from around the tip of Hudson Bay all the way to Northern Mexico. Kind of makes Sandy look wimpy.
Tshane3000, Bob has done several other posts on Sandy that you should have read before spouting.
The fact that sea surface temperatures fall by such a large amount along the track of a hurricane is a very interesting climate fact, seen in almost all events. Massive amounts of energy are taken from the surface, dropped into the atmosphere, transported a certain distance and direction (most often northerly) and then eventually emitted to space.
This is what the climate / the Earth energy system does. It happens at the level of latitudinal climate zones, hurricane systems, afternoon thunderstorms and at night when the Sun goes down. Climate science has underestimated how fast this occurs and consequently, the warming is 50% to 90% less than expected.
Tshane3000 says:
November 11, 2012 at 11:19 pm
“It merely shows that temperatures fell along the track. It doesn’t show any reason why, although one might infer the storm brought colder water to the surface. But to claim that an unexplained temperature anomaly…………………”
Why are you commenting when you are a scientific illiterate?
You don’t even know the mechanism by which hurricanes transport heat from the oceans and yet you feel able to criticise the poster.
This is typical of AGW believers, absolutely clueless about the science and physics yet they KNOW they are right. It is quite amusing actually.
Stop embarrassing yourself my man., go away and learn a bit about the science before commenting and you might be able to leave the question of whether you are an idiot open.
Alan
Bob Tisdale says:
>>
Philip Bradley says: “There is no seasonality to anomalies.”
Actually, there is. You can see the seasonal component in SST anomalies in any long-term sea surface temperature anomaly animation:
>>
Yes there is some residual annual variation from the deseasonalised anomalies because not all years have identical variations. But you cannot talk of the “seasonal high” in an anomaly like you did since the it could be seasonally lower that the reference period.
Philip Bradley’s criticism is totally valid.
Once again you demonstrate you total inability to accept any criticism or admit any mistake you have made.
As I have pointed out several times, winning the argument is clearly more important the being correct for you (and you see every correction as an argument to be won). This devalues everything you post, which often has some good points to make.
Try being less defensive and admitting a mistake when one is made.
Tshane3000…Your ignorance about hurricanes is staggering. Hurricanes cool the ocean because the hurricane engine is convection. The temperature gradient between ocean and middle atmosphere is huge and the storm is the balancing force. The alarmists ignorance of basic natural balancing engines is the cornerstone of your faith. Your AGW if it existed would not necessarily cause more severe weather, in fact many hurricane scientists suspect that a warmer world on average could actually lead to less severe weather due to lowered temperature differentials in certain areas. Not a fact obviously. Non-alarmist scientists don’t state suggestions and ideas as facts, they leave that to Alarmist clowns.
John F. Hultquist says:
November 11, 2012 at 6:54 pm
>>
P. Solar says:
November 11, 2012 at 6:23 pm
“ . . . , that’s why there is more cyclone energy in the system.”
It’s been a tiring weekend so maybe my synapses are not snapping rapidly enough to find the compatibility between P’s statement (above) and the downtrend of ACE as reported by Ryan Maue here . . .
http://wattsupwiththat.com/2012/10/01/dr-ryan-maue-releases-new-hurricane-frequency-data-showing-a-negative-trend-in-the-last-30-years/
>>
It’s not that hard to see. I plot 120 years of data Ryan shows thirty-six evenly spaced either side of the recent maximum.
The other key point is that he is fitting “trends” to complex data with huge pseudo-cyclic variations. That is nearly always a mistake and can show anything you want (or don’t want).
As you can see his plot avoids the big picture from which you can clearly see what is happening without dubious trend fitting.
You also fall into the trap of seeing what you expect. There are two lines on Ryan’s graph , one rises the other falls. You only see the one that falls.
What I would read from his graph is that “major hurricanes” are peaking a bit later than “all”. This implies the NOT “major” ones are declining even earlier.
His plot is not incompatible with mine it’s just a very small window.
However, his conclusions are somewhat misleading because of taking such a narrow view.
Hope that helps your synapses 😉
PS he is plotting hurricane “frequency” which may be less directly linked to temperature than total cyclone energy. His plot seems to turn earlier.
Instead of the title “Hurricane Sandy cools the ocean”, how about “Ocean cooling powers Hurricane Sandy”?
The weather NOW is substantially identical to what it was in the 1950s. It is not “dirty weather”, nor is it “unnatural nature”. It is the absolutely natural and consistently historical pattern of weather prior to the warm / stable phase of the PDO that we’ve had for the last 30 years. It is a 60 year cycle, so not all that surprising that the last similar storm to hit the New York / New Jersey area was about 60 years ago. (Though that one was stronger). Similarly, it is absolutely normal that glaciers that had relentlessly ADVANCED during the Little Ice Age would turn around and retreat during the rebound to normal warmth when that Little Ice Age ended. As we are at the end of that period, the retreat would be maximum now. As we enter the next cold phase, they will again advance after the turn is well underway
http://chiefio.wordpress.com/2012/11/10/unnatural-stupidity/
The idea that we humans can make sacrifices to assure more favorable weather is a primitive, but enduring belief in the history of civilizations. It is surprising that these days the notion is embraced by so many otherwise educated people.
Tshane3000 says:
November 11, 2012 at 11:19 pm
It merely shows that temperatures fell along the track. It doesn’t show any reason why, although one might infer the storm brought colder water to the surface.
Why, when you clearly have zero understanding of climate science – or any other variety, come to that, have you bothered to comment on a climate science blog, apart from some peculiar and inexplicable desire to insult the contributors?
In any case, the way things are going I think these days it is you Warmist true believers that are the deniers, not us AGW sceptics.
An on the issue of Sandy we have this from Climate Depot.
cRR Kampen says: “Deny, deny, deny. Bob Tisdale really wants another Sandy against an unprotected coast.”
Hello, troll. Please quote the sentence or paragraph in this post or in any of the others I’ve written about Sandy that led you to your conclusion. Good-bye, troll.
REPLY: cRR Kampen has long ago made himself known for this sort of garbage, and has been disinvited. He keeps coming back because he thinks his opinion is of worldwide importance – Anthony
P. Solar says: “Yes there is some residual annual variation from the deseasonalised anomalies because not all years have identical variations. But you cannot talk of the ‘seasonal high’ in an anomaly like you did since the it could be seasonally lower that the reference period.”
Was it ” seasonally lower that the reference period”, P. Solar? Apparently not. A positive anomaly of 0.8 deg C indicates it was above the base year average.
Thanks Bob, it is good to see some numbers that help tell the story of the Earth’s thermostat.
Huge storm -> huge temperature drop
Yes, storm convection cools the waters underneath and the heat is moved to great heights very fast.
P. Solar says:
November 12, 2012 at 4:36 am
“As you can see his plot avoids the big picture from which you can clearly see what is happening without dubious trend fitting.”
Fair enough. Thanks for the clarification.
Could a storm of this nature be a leading indicator of the looming end of the interglacial?
Peoples Democratic Republic of Catastrophic Climate Disruption.
Bob Tisdale says:
November 12, 2012 at 2:30 am
Philip Bradley says: “There is no seasonality to anomalies.”
Actually, there is. You can see the seasonal component in SST anomalies in any long-term sea surface temperature anomaly animation:
Bob, There can be short term (one or several years) seasonal pattern in the anomalies, but a long term (covering the reference period) seasonal pattern is impossible.
You said,
Sea surface temperature anomalies were near their seasonal high the week of October 24th
You could have said ‘annual high’. Although annual high for the anomaly doesn’t mean much.
As I mentioned the seasonal SST (and satellite temperature data) pattern in the last 2 or 3 years means (assuming its not chance variation) that something has changed in the climate, and it appears to be a global reduction in clouds and resultant increase in solar insolation.
And to follow up on P Solar’s post. When someone points out an error in your work use it as an opportunity to learn something you didn’t know and/or improve the quality of your work. Science writing requires a degree of precision in the use of language that many people find difficult. I come across examples of imprecise language all the time in published peer reviewed papers.
Take Anthony as an example. He is always gracious when people point out errors in his work (although he makes very few), and its an important reason for the success of his blog.
Philip Bradley says: “Bob, There can be short term (one or several years) seasonal pattern in the anomalies, but a long term (covering the reference period) seasonal pattern is impossible.”
I’m not discussing the long-term, Philip.
Impossible? That’s a bad word for you to use when you obviously have not studied the subject. Read on, Philip.
Philip Bradley says: “As I mentioned the seasonal SST (and satellite temperature data) pattern in the last 2 or 3 years means (assuming its not chance variation) that something has changed in the climate, and it appears to be a global reduction in clouds and resultant increase in solar insolation.”
And as I have suggested to you on past threads, you need to study the impact of the base years on the seasonal component and on the additional variability. Further to this, in my earlier reply to you on this thread, I provided the graphs of the Northern and Southern Hemisphere sea surface temperature anomalies to illustrate the seasonal component in the data. You must’ve missed them or maybe you were having trouble with seeing the seasonal component. If so, here’s a graph of the difference between the sea surface temperature ANOMALIES of the two hemispheres: Northern Hemisphere minus Southern Hemisphere. Note how the seasonal component grows in recent years, outside of the base years of 1971-2000 used by NOAA:
http://i49.tinypic.com/2a9v2ud.jpg
I used the NOAA NOMADS website for that graph, as I did when I wrote this post. Now, using the KNMI Climate Explorer, I shifted the base years to 1995 to 2011 for the next graph. It’s the same data, just different base years. Note how the greatest seasonal component has shifted to the early part of the data:
http://i45.tinypic.com/1pcu38.jpg
Looking at the earlier part of the graph, would you also assume that “something has changed in the climate” during those wild swings?
Philip Bradley says: “And to follow up on P Solar’s post. When someone points out an error in your work use it as an opportunity to learn something you didn’t know and/or improve the quality of your work.”
When I’m wrong, I’m happy to admit or correct my mistake. HOWEVER, in this instance I was not wrong. Maybe you should heed your own advise!
Typo correction, Philip. The last sentence should read, Maybe you should heed your own advice!
Drivel, drivel, drivel – hoping for Sandy 2.0 at 910 hPa 🙂
REPLY: So you’d wish death and destruction on people just to prove your point? What a schmuck. Get the off my blog PERMANENTLY. We don’t cater to sadists here, and after many warnings, I’m done with you. GET OUT. – Anthony Watts
Anthony: After you banished cRR Kampen from WUWT, he/she came to visit me at my blog.
http://bobtisdale.wordpress.com/2012/11/11/the-impact-of-sandy-on-sea-surface-temperature-anomalies-along-its-track/#comment-6321
It was his/her first and last comment there.
The warmies have said that “Sandy” was the worst Hurricane ever.[snip. No HAARP discussion, please. — mod.]
Could it be that the surface temperatures were churned, revealing cooler deeper water? I’m just curious. It of course makes sense that bring warmth higher up would lead to heat transfer out of our upper atmosphere.
I notice the discussion of a hurricane moving heat laterally, but not the effect of moving tons of water vapor to altitude where it condenses and radiates heat to space vertically.
All that water falling as rain represents heat transported to great heights in the clouds. And released there.
In that situation, more GHG (at altitude) ought to increase heat radiation and net cooling.
It’s not just poleward transport that matters…
So one could say that rain generally has a balancing effect on warmer weather. If it rains more when oceans are warmer, this makes sense. Is there a general study that shows this as one of the moderating effect, helping to balance the earth’s energy budget? Is this one of the negative feedbacks?
[snip]