Gee, the AGW meme seems to permeate everything these days. Here’s a place where I least expected it to show up, the venerable Astronomy Picture of the Day, one of the oldest running daily features on the Internet. The first blunder is obvious; the graphic of hurricane tracks for September 4th 2012 has nothing to do with astronomy or NASA, it isn’t even remote imaging, but rather a terrestrial data plot. WUWT?

They must be running out of actual astronomy content. The caption however, is the second blunder, worse than the first. Here’s the caption, complete with links:
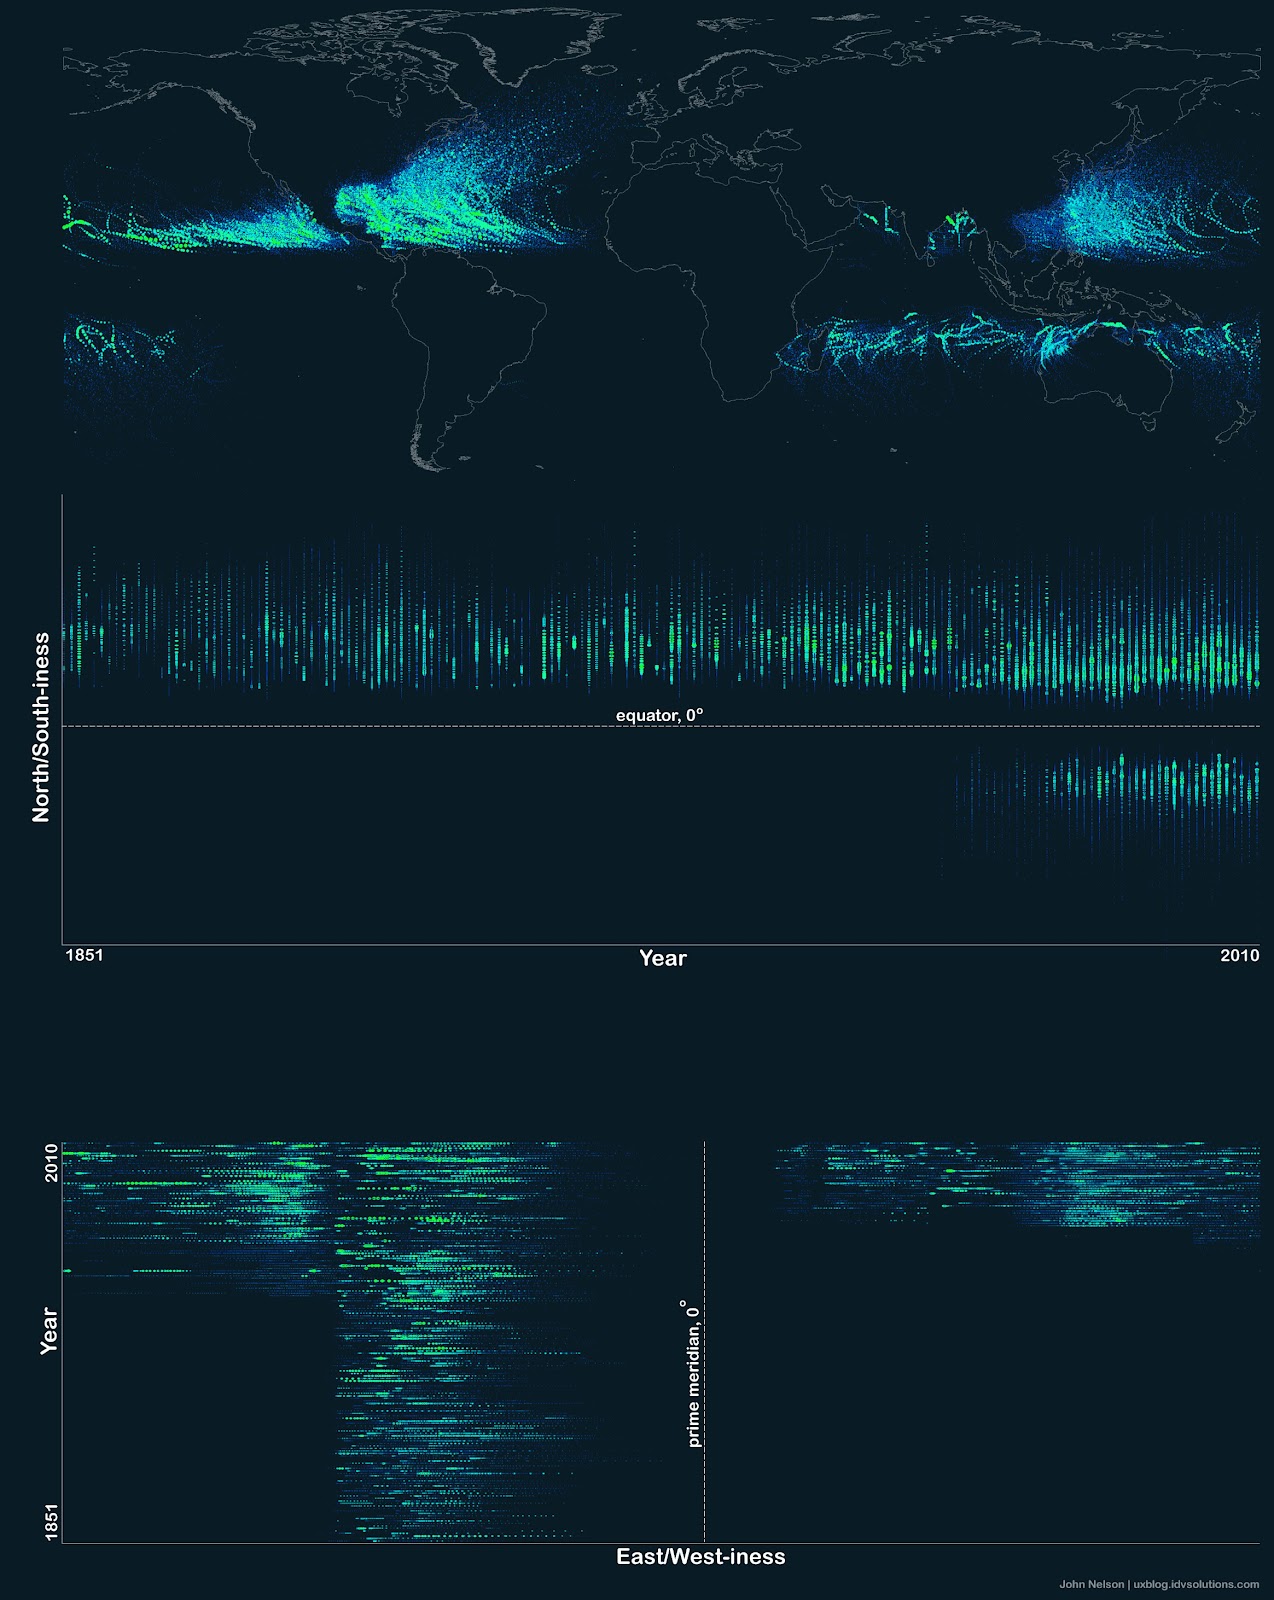
Hurricane Paths on Planet Earth
Image Credit & Copyright: John Nelson, IDV Solutions Explanation: Should you be worried about hurricanes? To find out, it is useful to know where hurricanes have gone in the past. The above Earth map shows the path of every hurricane reported since 1851, Although striking, a growing incompleteness exists in the data the further one looks back in time. The above map graphically indicates that hurricanes — sometimes called cyclones or typhoons depending on where they form — usually occur over water, which makes sense since evaporating warm water gives them energy. The map also shows that hurricanes never cross — or even occur very near — the Earth’s equator, since the Coriolis effect goes to zero there, and hurricanes need the Coriolis force to circulate. The Coriolis force also causes hurricane paths to arc away from the equator. Although incompleteness fogs long term trends and the prevalence of hurricanes remains a topic of research, evidence is accumulating that hurricanes are, on the average, more common and more powerful in the North Atlantic Ocean over the past 20 years.
==============================================================
The explanation is fine, until you get to the “more common” section, which links to a 2005 NPR story talking about Dr. Judith Curry’s husband, Peter Webster, and a paper he wrote then.
You’d think NASA could get more up to date facts to support their claim, or even use a trusted source, such as an actual paper, rather than the highly biased National Public Radio. The interview is telling for NPR’s advocacy:
Mr. WEBSTER: At all the other ocean basins, their hurricane number has sort of stayed around much the same or decreased slightly in the last 10, 15 years.
HARRIS: So there has been no increase in the total number of hurricanes, but there have been more strong hurricanes and fewer weak ones in the past decade.
Mr. WEBSTER: In all of the basins, including the Atlantic Ocean, the number of Category 4 and Category 5 hurricanes since 1995 have doubled compared to the 1970s and the early ’80s.
HARRIS: Webster says there’s a plausible reason for this. Hurricanes draw heat out of the oceans as they build, and the sea surface temperature in the tropics has warmed by 1 degree since 1972. That may sound like a very small number, but it represents a huge amount of energy.
Mr. WEBSTER: And the interesting thing about when the sea surface temperature gets warmer, it’s like the octane level of the fuel becomes higher and higher because, as you get warmer, you start to evaporate more and more moisture.
HARRIS: Because of this, some scientists have predicted that the biggest hurricanes will become even bigger, with faster and more ferocious maximum winds.
Mr. WEBSTER: We’re not seeing that, at least in the satellite observations that we have.
HARRIS: Still, Webster says that he is seeing a global increase in big storms. It’s not just a regional trend. So he suspects there’s a global cause, and that would be global warming heating up the surface of the world’s oceans. But Roger Pielke Jr. at the University of Colorado is worried about making that link.
Yes, “global increase in big storms”, even though just moments before, Dr. Webster says he’s not seeing any evidence of bigger storms.
To their credit, they do give Pielke Jr. some time, and he’s right to be concerned.
The quote of the week in this week’s Climate and Energy News Roundup from SEPP is fitting for this NASA blunder:
In God we trust; all others bring data! – Motto of the Apollo Space Team
Indeed, and we shall. From Dr. Ryan Maue’s Tropical web page:

Figure: Historical North Atlantic tropical storm and major hurricane frequency since 1970 from the HURDAT best-track dataset. Since 1970, there have been 465 tropical storms including 102 major hurricanes (22%). Since 1995, the ratio is slightly higher (26%) or 64 major hurricanes out of a total of 250 storms. Data File

Figure: Historical North Atlantic tropical storm Accumulated Cyclone Energy (ACE) since 1970 from the HURDAT best-track dataset. It is clear from the ACE metric that the active-era since 1995 in the Atlantic is well described with a marked step increase. This is partially due to a preponderance of long-lived Cape Verde origin major hurricanes that have higher intensity and longer duration which means more ACE. ACE is the convolution or sum of the reported wind speed squared (in knots) over the lifetime of the storm. Data File
So yes, there is a slightly higher ratio of storms since 1995, but as the accumlated Cyclone Energy shows, since 2005, the “more powerful storms” meme has evaporated, much like Al Gore’s influence.
The increase in the number of storms is easy to explain, with much of the increase due to better reporting and newer technology. There’s keen interest i the North Atlantic due to U.S. interests, and the U.S. has the best hurricane tracking program in the world.
Dr. Patrick Michaels points out last Friday in this excellent essay on hurricanes:
It’s been 2,535 days since the last Category 3 storm, Wilma in 2005, hit the beach. That’s the longest period—by far—in the record that goes back to 1900.
Quite a drought. He adds:
Aren’t there more whoppers—the powerful Category 4 and 5 monsters that will mow down pretty much anything in their path? As is the case with much severe weather, we simply see more than we did prior to satellites and (in the case of hurricanes) long-range aircraft reconnaissance. As the National Hurricane Center’s Chris Landsea (with whom I have published on tropical cyclones) has shown, if you assume the technology before satellites, the number of big storms that would be detected now is simply unchanged from the past.
There’s a pretty good example of this spinning in the remote Atlantic right now, which is Hurricane Kirk, far away from shipping channels, land, and nosy airplanes. Kirk is compact enough that it would likely have been completely missed fifty years ago. If it spins up into a Category 4 (which is currently not forecast), that would be another biggie that would have gotten away, back in the day.
There’s another reason that the increase in frequency is more apparent than real: “shorties”. That’s what Landsea calls the ephemeral tropical whirls of little consequence that are now named as storms more because of our detection technology than anything else. There’s also probably an overlay of institutional risk aversion in play, as it is now recognized that seemingly harmless thunderstorm clusters over the ocean can spawn decent floods when they hit land.
There is another driver for an increase in Atlantic hurricane frequency that isn’t operating elsewhere. In 1995, a sudden shift in the distribution of North Atlantic temperatures increased hurricane frequency. Landsea predicted—at the time—that the Atlantic would soon fire up from its hurricane doldrums of the previous two decades, which it did. This type of shift has occurred repeatedly in the last century, both before and during (modest) global warming from greenhouse gases.
The influence of technology on storm reporting is something I’ve talked about in great detail before:
h/t to WUWT reader Mike Leckie for pointing out NASA’s APOTD blunder.
Are the paths shown Hurricanes only, or a combination of Hurricanes and their preceding Tropical Storm paths?
Earth is a planet, so it seems like a good idea to talk about it wrt astronomy…
…until one realizes the whole era of NASA’s decline has coincided with its newly-fangled ‘Mission to Planet Earth’ desparately seeking to remain policy-relevant.
Funny how that reminds me of another sad story..
Good post, Anthony.
Holy cow! I wonder what this bit of junk cost?
I dislike the wording in the caption . . .
“. . . which makes sense since evaporating warm water gives them energy.”
It is the latent heat in the evaporated water, also known as vapor, that provides energy. A subtle change, I know, but clarity is improved.
And not that WUWT folk much care, but “since” is incorrectly used. It is ‘cause’ not ‘time’ that one looks for here, and so the word should be ‘because.’
If you want to talk hurricanes, I’d say you might want to interview a hurricane person. I remember when Katrina came thru and a hurricane expert was asked how much of an effect a warming of
several degrees would have. He said that the incidence of hurricanes would not change, since
ocean temps are not a dominating factor in their creation,and further, that wind speed increases due to considerable global warming might amount to 5 MPH. To me, that was the end of any concern about global warming’s effect on hurricanes, either their number or their strengths.
http://apod.nasa.gov/apod/astropix.html says:
Credit is give to:
John Nelson’s page says “Occupation – User Experience Lead”, IDV solutions is:
He does have some interesting stuff on his blog, but he needs to know a bit more about astronomy and meteorology.
Umm. Umm. Please point me to a hurricane that formed over land….
I think a hurricane could cross the equator and keep its spin. It would be a bit harder, and the outermost fringes might get disrupted, but the core forces are much stronger than the Coriolis force. The ITCZ provides an out to prevent hurricanes from forming near the equator, and it’s steering currents that get storms moving north. Or making loops.
Right, just like the last active period from the late 1930s to 1950s. Except the northeast hasn’t been clobbered yet like it did the last time around. John would do well to look at global trends.
NPR is basically a wholly-owned broadcast subsidiary and propaganda outlet. It offers a steady, incessant drumbeat of climate alarmism that ought to be embarassing to anyone with any pretensions of journalistic balance.
Of interest to WUWT, today’s featured climate propaganda piece is on the topic of Urban Heat Islands:
http://www.npr.org/2012/09/04/160393303/as-temps-rise-cities-combat-heat-island-effect
Those running UniverseToday must be contaminating APOTD (most of my saved astronomy pics come from APOTD).
And SE Asia has less tropical activity than the sw N Atlantic/Gulf?!?!? Right…..
Hammering apod for a link to a relatively balanced NPR story is a bridge too far, wish you had not posted.
REPLY: My personal experience from NPR is different than yours , YMMV. NASA shouldn’t use news stories as references when papers are available – Anthony
Interesting. In neither of your graphs is there any obvious naked eye “trend” — but there DOES seem to be a very obvious naked eye split. Before 1995 things were quiet. Then, suddenly, 1n 1995 they heated up and have stayed that way.
Am I just seeing things? It looks so blatant. If there had been ANY sort of major event in 1994/95 (comet passing nearby, major volcano, Madonna joining a convent, Clinton telling the truth, … ANYthing…) we’d probably be pinning the pre- and post- periods on that event.
But the biggest thing I remember from that period was this one really cute… er.. hmm… never mind! She wasn’t hurricane level in any event.
– MJM
NASA needs to look up, not down.
Interesting that the North Atlantic track appears to continue into the North Pacific.
Hurricanes generally don’t track from one ocean to the other, so the nearly perfect continuation between the Atlantic and Pacific suggests there is something poorly understood driving hurricane formation.
John Garrett says:
September 4, 2012 at 6:37 am
> NPR is basically a wholly-owned broadcast subsidiary and propaganda outlet.
They may be getting better. Yesterday they had a program about dreadful life has become due to the decline of unions, but had to grudgingly admit unions aren’t providing much in the way of services. One caller said he lost his job at a union shop, but got a new one at a non-union shop and will never go back. His most telling comment is that communication with management is great.
Today I heard a report on a Stanford study that concluded organic produce has not observable health benefits. While the reporters express shock, surprise, and awe they did report.
In my state, NHPR did a good job covering our get out of RGGI debate last year. (The northeast cap and trade scheme.)
beng says:
September 4, 2012 at 6:38 am
> And SE Asia has less tropical activity than the sw N Atlantic/Gulf?!?!? Right…..
Call that another APOD blunder. Check the source, the Pacific data is only from 1978 or something like that. APOD says ” The above Earth map shows the path of every hurricane reported since 1851, Although striking, a growing incompleteness exists in the data the further one looks back in time.” That’s self-inconsistent and inaccurate.
omnologos says:
September 4, 2012 at 6:28 am
NASA’s decline has coincided with its newly-fangled ‘Mission to Planet Earth’
=====
How true. NASA’s GISS is climate science. Money that should have gone to the development of new technology has instead gone into building a global temperature record and computer models maintained by global warming zealots. Paid for by the American Tax Payer.
Want to retire? Forget about it. Quantitative easing transferred the value in US pensions to the banks to finance the debt. The politicians bought your vote using your own money.
The Climategate emails and documents released in Nov 2009 caused NASA much grief, with many faithful supporters of NASA and the space program now questioning if they have been used and deceived.
Well telescopes in space can point up and down. Some time ago, like thirty years, Eli and a friend were talking about using Hubble to point at near Earth orbit things, and you could not do it, because it would burn out the sensors. Since the revealation that the NRO had several extra Hubbles, Eli guesses a) they had a different sensor suite and b) they had some of them in orbit. The ones they are offering NASA were obviously the spares.
If you guys have some time, you might try and FOIA the images:)
REPLY: and there’s Joshua Halpern of Howard University, defending the indefensible again. Of course if I posted such an assertion well, that would be a different story and the attack bunnies would come out.
Hey screwy wabbit, it isn’t a telescope image.
Seeing your latest blog hate fest, I’ve decided to give you the boot. You aren’t welcome to comment here anymore Dr. Halpern. I’ve reached my tolerance limit with you. BTW, your TOBs claim is about to go down in flames. – Anthony
Warmist rule #1: Any and all possible evidence of warming must be heralded as evidence of catastrophic anthropogenic global warming.
For the warmists, the trends, however they are explained away, is obvious: after ’95, the potential storm damage to man and property has increased. Mathematically it may be that since ’05 the trends are down, but visually they are just moderated and still higher than in the ’70s. The key is the step change from a DOWNWARD visual trend prior to ’95: global warming does not explain that.
If all global science were settled and the outcomes, certain, we wouldn’t be having this discussion. The un-settledness and un-certainty of the actual science and situation of global warming allow any side with an agenda to find evidence, be-it through fact or observation bias. Here, like the CO2-before-temperature rises, confirmation bias allows a time discrepancy to float in the error bar due to “natural” variability. A step-function, it could be said, is just the end of a natural cooling episode combined with pent-up heating forces.
Nothing will be settled wrt policy moves until either the temperatures jump or drop 0.3C or more. An “up” will have Gore, the Euros and Aussies screaming; a “down” will get Inhofe on national TV (finally exposing the scam).
To get an elephant’s attention you have to whack ‘im pretty hard. We need a strong signal – either side, when the rhetoric has been as high as it has been. Quiet Sun, Silent Gore: a future Chinese fortune cookie saying.
I notice that the south Atlantic hurricane from March 2004 which made landfall in Brazil did not make it into the NASA figure.
As cool as the picture is in general, it isn’t a very good resolution. Lots of ground tracks over land are missing. For example, the 1900 Galveston Hurricane was so strong, it was a cat one almost to Oklahoma. It was a tropical storm for a while over Kansas.
The resolution is a little low as south Atlantic hurricane is visible on the flickr image. Click “above Earth map” link.
@ ferdberple says:
September 4, 2012 at 7:20 am Stark verities on potentially political subjects usually wake the trolls.
Felix Scholl says:
September 4, 2012 at 7:43 am
> I notice that the south Atlantic hurricane from March 2004 which made landfall in Brazil did not make it into the NASA figure.
Yes it did (though it is not a NASA figure). It was only Cat 1, look at the fullsized image and look near southern Brazil. I mentioned it on his blog.
In the UK, prior to Newton’s Principia Mathematica, it was essential at the end of every scientific paper to show how the findings conformed to the teachings of the Anglikcan Church. Nowadays, it is essential to show how similar findings of any relevant paper conform to the religion of CAGW. Shades of Tom Lehrer’s Vatican Rag. “Genuflect, genuflect, gemnuflect, genuflect”
There is a major error with the image. Where are are all the typhoons? The western Pacific records an average of 31 tropical cyclones, nearly three times that of the Atlantic basin. To look at the image you’d think that the Atlantic basin had the most tropical cyclones. After reading the statement “hurricanes are, on the average, more common and more powerful in the North Atlantic Ocean over the past 20 years” I wonder if the statement and map actually reflects their parochialism-that if doesn’t affect the US it doesn’t count.
Any idea why there are no tropical cyclones in the southern Atlantic?
Eli Rabett says:
September 4, 2012 at 7:25 am
“Well telescopes in space can point up and down. ”
That doesn’t make it astronomy. Words mean things.
1933 had 20 tropical storms and hurricanes in the Atlantic. That was the old record 2005 beat. The charts we see never seem to go back that far.
Frankly, I’m a bit nervous about this. I have read that global wind patterns respond to the temperature difference between equater and poles. A warming planet reduces global winds and resulting hurricanes but a cooling planet causes increasing winds and hurricanes. I have been expecting more hurricanes. My question is are the poles cooling or warming? SH seems to be cooling.
I made a post on asterisk begining with a link to this WUWT page and ending with this observation on representation of uneven data collection.
The very next reply was rather unscientific
Now that’s rather closed minded.
From Eli Rabett on September 4, 2012 at 7:25 am:
http://hubblesite.org/newscenter/archive/releases/1999/14
And on a page “Last Updated: November 30, 2007” (why can’t they put a date on the article?), from NASA:
http://www.nasa.gov/vision/universe/solarsystem/hubble_moon.html
So Hubble can successfully look at the Moon.
Curious side note: The article says:
Yet I found an entry on a blog done by someone called Phil Plait, who claims to have worked on the Hubble for ten years. The actual article was hardly loading, it was very slow and not showing up so I used the Google cache. There he calculated that Hubble couldn’t see the lunar landers because “…Hubble’s resolution on the Moon is about 200 meters!” That’s around three times worse than what NASA itself says is the resolution. WUWT?
@John West…
“Warmist rule #1: Any and all possible evidence of warming must be heralded as evidence of catastrophic anthropogenic global warming.”
Warmist rule #1: Any and all possible evidence of ANYTHING must be heralded as evidence of catastrophic anthropogenic global warming.
There, fixed that for you…
Looking at the picture, it is obvious
1. Its the sun stupid.
2. More in the North because the earth is closest to sun in summer there,(hope I got that the right way round)
3. The Atlantic and East Pacific seem to be part of the same system.
Why didn’t they color code these Hurricanes and Anti-hurricanes, so that we could tell them apart.
What fraction of these severe storms (what is the total number since 1851) are the reverse rotation anti-hurricanes like the ones shown in the cover photograph on Al Gore’s book ?
If a hurricane, or an anti-hurricane, were to follow a path that crossed the equator, how long would it take for the rotational reversal to take place ?
Apparently hurricanes on the sun (sunspots), take 11 years to reverse rotation, but they are much larger.
“””””…..Grey Lensman says:
September 4, 2012 at 10:36 am
Looking at the picture, it is obvious
1. Its the sun stupid.
2. More in the North because the earth is closest to sun in summer there,(hope I got that the right way round)
3. The Atlantic and East Pacific seem to be part of the same system……”””””
Actually Grey, you got it exactly wrong. Earth is closer to the sun in Northern winters; not summers.
Just remember that Antarctic winters are much colder than Arctic winters (for several reasons), and that will help you get it right.
Stephen Rasey said (2 posts up) “Now that’s rather closed minded.”
There are forums for discussing alternative beliefs. The Asterisk isn’t one of them, which you probably know, so why come back here and complain when someone reminds you of the rules?
From Rob Stevenson on September 4, 2012 at 10:50 am:
So science itself is now an alternative belief, with the discussion of scientific theories and evidence, including real-world scientific observations, now relegated to “alternative belief forums”?
Wow! asterisk just scrubbed 5 posts, two of mine, two from Chris Peterson calling WUWT pseudoscience and “denialist”, a reply from a “C in Canada” saying he’d believe something on WUWT before NPR.
Anthony says:
“My personal experience from NPR is different than yours”
Reply:
I said the story was relatively balanced, not NPR.
My concern about the NASA graphics is the way they indicate that hurricanes only hug the coast. Yet in 1954, Hurricane Hazel retained so much wind-force (110 kph winds), not to mention rain, that it caused the deaths of 81 people in Toronto, Canada.
see http://www.hurricanehazel.ca/
@ Garrett
I love this wording, “offers a steady, incessant drumbeat of climate alarmism that ought to be embarassing to anyone ” flowing and beautiful. thanks.
astronomers seem to all be fearful of the big bad boogeyman of climate change. the blog ‘Bad Astronomy’ is filled with rubbish from the resident doctor
More than 90% of the recorded tropical cyclone tracks around Australia are not on the map.
If you want some idea of the real number back to 1906 try:-
http://www.bom.gov.au/cgi-bin/silo/cyclones.cgi?region=aus&syear=1906&eyear=2006&cyclone=all&loc=0
There were many pre 1906 with recorded landfall but not necessarily a known track.
Looks like accumulated cyclone energy has increased since temperatures have decreased. Oh, I forgot, it is still getting warmer.
“Owlice with her admin hat on”
Could just as easily be “Owlice in blunderland”…
I would say that they’re just a half-asterisk site…..
And besides being out of date, Webster’s comparison to octane measure is bogus, bogus, bogus.
Worthy of a day at APOD, these animations a friend did of Gale Crater on Mars are quite interesting. It is disappointing that APOD has begun greening their site.
http://www.youtube.com/watch?v=Xy0yvHblTyA&feature=player_embedded
FAIL:
“… has nothing to do with astronomy or NASA”
Go to NASA web page > About NASA > What does NASA do?
You should know these things without reading the ‘about-page… just sayin’.
George Smith thanks, you said
Quote
Actually Grey, you got it exactly wrong. Earth is closer to the sun in Northern winters; not summers.
Unquote
Absolutely correct, it was late, I was tired but Inspired by the view and the pattern it recorded. I thought dang, If memory has got it wrong, somebody will correct me but that process will open new perspectives on what we see.
Looking at how Mexico seems to be a black brush stroke across a single coherent system really makes me ponder. What if the cause is from above and not below?
The differences between North and South really are striking.
Regarding my earlier post that the image looked wrong-it is. Here is a more accurate picture of the relative frequency of tropical cyclones world wide.http://upload.wikimedia.org/wikipedia/commons/2/23/Global_tropical_cyclone_tracks-edit2.jpg
The Australian Bureau of Meteorology has done an excellent job depicting regional cyclone tracks, here for 1906 to 2006. http://www.bom.gov.au/cgi-bin/silo/cyclones.cgi?region=aus&syear=1906&eyear=2006&cyclone=all&loc=0
The graph is live so that individual tracks bring up details when you hover.
This allows some comparison with the NASA plot in the header. Remarkably different pattern over land.
This was posted on asterisk.apod.com by Chris Peterson » Wed Sep 05, 2012 2:20 am
Over the top. Beyond the pale. Indefencible. [bolding mine]
[1] yes, he really wrote that!
[2] questions: Identified by whom? Once a crank site, always a crank site? Content on the issue makes no difference?
[3] Yes, be skeptical. But APOD deletes, scrubs, and erases. You cannot be skeptical and decide for yourself if you cannot see it.
[4] Now its personal.
[5] Of course politics NEVER plays a part in government institutions or funding. /sarc.
Challenge the ideas, not the messenger. But it is a target rich environment.
Berényi Péter says:
September 4, 2012 at 9:45 am
“Any idea why there are no tropical cyclones in the southern Atlantic?”
Rare, yes. No, not exactly. Reasons here:
http://en.wikipedia.org/wiki/Hurricane_Catarina#Rare_formation
Felix Scholl says:
I notice that the south Atlantic hurricane from March 2004 which made landfall in Brazil did not make it into the NASA figure.
The data used to compile the map appears to have no data from the South East Pacific and South Atlantic.
You’d expect a “band” North of the Tropic of Capricorn to mirror that South of the Tropic of Cancer. Maybe also with many storms going some distance South around Chile and Namibia
It is not evapourating water that gives the heat energy but the condensing water giving up its heat forming clouds. Evapourating water removes heat from the surface of evapouration.
I think I know what Dr. Webster attempted to say. But a higher octane number means a lower flammability. Too sad he did not double-check.
[snip . . OT . . kbmod]
I love APOD. Check it essentially every day. Those guys have some great stuff and have done a tremendous service over the years. There is nothing wrong with highlighting Earth phenomena on APOD, particularly those that might have to do with satellite tracking and such, and there is no point in taking them to task for showing a graphic of hurricane/tropical storm tracks.
However, this is not the first time they have made some CAGW-related comment on APOD, but (mercifully) it is quite rare. Hopefully they will steer clear of CAGW commentary and assumptions in the future and stick to the facts and the pure astronomy-space stuff they do best.