PART1 – (part 2 comes later today is NOW ONLINE HERE)
I’ve been noting with some humor the anticipation of a new Arctic sea ice extent minimum in the Alarmosphere. Yesterday, the frustration that there hasn’t been any major announcement yet bubbled to the surface in the form of a Michael Mann tweet, who was upset that NSIDC is making him wait:

Today though, looking at the NSIDC extent graph, he seems happy, declaring it “official”:

NSIDC made an announcement a few minutes ago, just as I started writing this post (and for that reason I’m publishing this post in two parts, see below):
Arctic sea ice appears to have broken the 2007 record daily extent and is now the lowest in the satellite era. With two to three more weeks left in the melt season, sea ice continues to track below 2007 daily extents.
Arctic sea ice extent fell to 4.10 million square kilometers (1.58 million square miles) on August 26, 2012. This was 70,000 square kilometers (27,000 square miles) below the September 18, 2007 daily extent of 4.17 million square kilometers (1.61 million square miles).
Here’s the plot, annotation mine:

Predictably, Seth Borenstein is already practicing for the big story he’ll be writing any minute now, and, the money quote he uses is just as predictable:
Data center scientist Ted Scambos says the melt can be blamed mostly on global warming from man-made emissions of greenhouse gases.
Neither Borenstein nor NSIDC’s current announcement mentions the massive Arctic storm that broke up huge amounts of sea ice, making this new record low possible. NSIDC said on August 14th:
As of August 13, ice extent was already among the four lowest summer minimum extents in the satellite record, with about five weeks still remaining in the melt season. Sea ice extent dropped rapidly between August 4 and August 8. While this drop coincided with an intense storm over the central Arctic Ocean, it is unclear if the storm prompted the rapid ice loss.
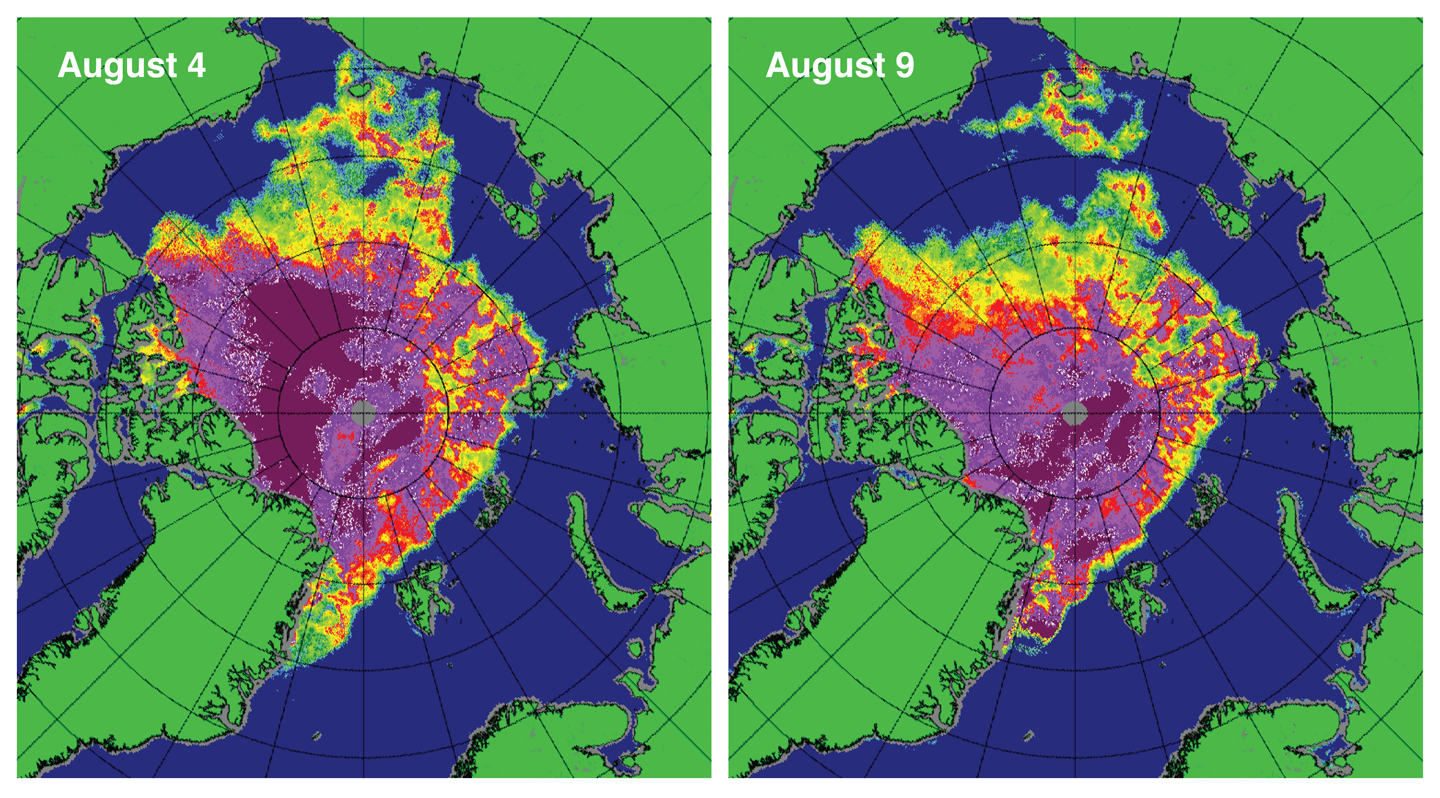
Unclear? Hmmph. Further down they dub it: “The Great Arctic Cyclone of 2012” and provide this before and after image:

Figure 4. These maps of sea ice concentration from the Special Sensor Microwave Imager/Sounder (SSMIS) passive microwave sensor highlight the very rapid loss of ice in the western Arctic (northwest of Alaska) during the strong Arctic storm. Magenta and purple colors indicate ice concentration near 100%; yellow, green, and pale blue indicate 60% to 20% ice concentration.
Credit: National Snow and Ice Data Center courtesy IUP Bremen
Calling the reason “unclear” seems more than a bit disingenuous to me, especially when you don’t mention it again.
It should be noted that in the ARCUS sea ice forecast submitted on August 5th, both NSIDC and WUWT forecasts agreed at 4.5 million sqkm. Clearly NSIDC didn’t expect this storm nor its effects, because if they had, their forecast would have been much lower.
In part two of this post, later today, I’ll share some other interesting things I’ve found that suggests NSIDC and the media aren’t telling you the full story right now.
Well, it is too late now for much more ablation of the ice pack. The melt ponds in the view of the drifting cameras are already starting to freeze over. Surface melt has already stopped so only the underside of the ice pack is melting at this point. The sun angle is too low for any solar melting of the surface. Now it’s just up to the wind and the waves.
An open Arctic Ocean means more moisture availability for the Polar Easterlies!!!
Watch for more “Ocean-Effect” snow to add to Greenland’s snow/ice depth, wiping out the “loss” from the brief early August “melt” so eagerly pounced upon by the AGW crowd!
How about this for a headline: “Arctic Sea Ice recovering since 2012”.
Just noticed the “Death Spiral” myself! Anthony, you said:
Well, of course, the “massive Arctic storm” will be blamed on CAGW, just like the drought, heavy snowfalls etc.
I guess I can blame my dead front lawn on CAGW, but I doubt they will pay to have it resodded!
There is good correlation between the storm and the rapid loss of ice loss in the region, so it’s quite plausible that the storm played some role. But we don’t exactly what role it played and how much of an effect it had. The ice was already quite thin in that region and probably poised to melt out anyway. The storm may have given it a jump start, but much of the ice there would’ve probably melted out without the storm.
One thing one can definitely not say is that without the storm we wouldn’t have set a new record low. We were already tracking below 2007 levels before the storm.
Walt Meier
REPLY: Thanks Walt, but I don’t think your statement of “One thing one can definitely not say is that without the storm we wouldn’t have set a new record low. We were already tracking below 2007 levels before the storm.” can be certain, because as you and many other people noted in the past, Arctic sea ice is at the mercy of the weather in the final days, without that Arctic storm, who’s to say the weather would not have turned more favorable? Can you tell me what the weather will be in the Arctic from now to the equinox and if it will be favorable/non favorable to sea ice extent? – Anthony
Break up the whole ice cap right before it starts refreezing and you ultimately get a solid coverage even bigger than last winter?
http://www.guardian.co.uk/environment/2012/aug/23/arctic-sea-ice-record-low?intcmp=122
I wrote to Vidal pointing out that he hadn’t mentioned that “record” meant “record since satellite monitoring started 30 years ago”.
No response, no edit of the programme.
I then emailed him with various other riders that have been published here and elsewhere indicating how meaningless this “record” is.
No response, no edit of the programme.
This from the paper that likes to claim that
“Comment is free but facts are sacred”.
A line judge needs to whistle this play dead vis-a-vis ‘beating the 2007 low’ and disregarding the part that “The Great Arctic Cyclone of 2012″ played in the ice extent decline …
.
Whenever MSM keep strangely mum about something, you bet there is a full story they aren’t telling….
What? Record? Did you say “record”? Nothing is a record until we decide it is!
Was it over when the Germans bombed Pearl Harbor? Hell no!
Otter: [to Boon] Germans?
Boon: Forget it, he’s rolling.
And it ain’t over now. ‘Cause when the goin’ gets tough… [thinks hard of something to say]… The tough get goin’! Who’s with me? Let’s go…!!!
The weird thing is that in 2007 the last minimum the UK had a dreadful summer, this year we have also had an Awful summer (April and June have set new records for rainfall).
In both years the Jetstream was driven south on both occasions, which is an interesting coincidence.
Since we have entered a subdued period for UV output from the Sun the jetstream also appears to form more Omega patterns than I have ever seen before, which here in the UK also given us the very cold months of January 2010 and December 2010 (the second coldest December on record and the coldest for 100 years).
Less ice seems to give the UK very cold winters, they started in Feb 2008 and apart from last winter (which was like winter 2006-2007) have been the coldest in my lifetime, I wonder if the pattern is about to reload 😮
There’s just been a risible news interview about this topic on the BBC, with Prof Peter Wadhams. He unequivocally laid the blame for the low sea ice extent squarely on CAGW due to CO2 emissions.
He spent the whole piece dispensing alarmist nonsense and disinformation, with a shit-eating grin plastered across his face. His apparent solution was to spray clouds with water vapour.
}:o(
A possible reason?
http://notrickszone.com/2012/08/27/arctic-ice-loss-temperature-or-soot/
Honestly, who cares? Melt the whole cap. Shipping will become a lot easier. People dreamed for hundreds of years of a passage over the top. They may get that dream eventually. It’ll matter as much as it does that we no longer have a 5 mile thick glacier over the area that is now New York city, thanks to the melting since the last Ice Age.
Climate change is dominated by natural oscillations of sun and the Earth’s core. One provides the energy, the other the variability in the absorption and release of the energy. Understanding of the natural oscillations is key not only the climate but other natural events. Here I demonstrate one more of the Sun-Earth relationships.
http://www.vukcevic.talktalk.net/Sun-Earth.htm
With all this record melting, why hasn’t New York City been deluged? Why are the Netherlands still above water?
Replying to Anthony: I agree. We can’t say that we would’ve set a new record even without the storm. But we also can’t say the the storm led to the record – we might’ve set the record regardless of the storm.
A key point is that while the weather helps determine where the final numbers end up, the long-term trend determines whether we’ll be high, average, or low. And a decreasing trend pushes the odds in favor of new records, as we’ve seen. And one reason for this is that the long-term changes makes the ice more vulnerable to a storm like the one that came through in early August. The ice is thinner, more broken up, and more vulnerable to any impacts (waves, ocean mixing, warm air transport) from such storms.
Though a record always gets a lot of attention, which is understandable, more relevant is the long-term trend of over 12%/decade, the fact that we’ve set a new record low 4 times in the last 11 years, and the last 6 years are the lowest in the 34-year record.
Walt Meier
REPLY: Thanks Walt, have you ever considered we may be at/near the bottom of a natural cycle? How can you rule that out without data much beyond 30 years? There’s historical anecdotal evidence of very low Arctic sea ice in the past where you have no data. – Anthony
“REPLY: Thanks Walt, but I don’t think your statement of “One thing one can definitely not say is that without the storm we wouldn’t have set a new record low. We were already tracking below 2007 levels before the storm.” can be certain, because as you and many other people noted in the past, Arctic sea ice is at the mercy of the weather in the final days, without that Arctic storm, who’s to say the weather would not have turned more favorable?”
Was there ever a clearer example of anti-empiricism. Was there ever a clearer example of distaste for present and relevant fact? It is as if the arctic storm had not occurred. This so-called science is totally “a priori” and reveals that the so-called scientists have no empirical instincts whatsoever.
Mann’s tweet is an excellent example of someone who was once eaten alive by confirmation bias and now is an outright activist. All he cares about is the moment that he gets to trumpet the announcement of his victory in record low sea ice extent.
Think of all that energy that can now be released from the Atlantic where there is no longer ice cover.
Expect the North Atlantic to cool quite a bit, this is a negative feedback in the system. I don’t know when Enough energy will be released to start the significant cooling but it will happen.
I’d like to add my thanks to Walt Meier for his openness and honesty, he’s the only one I trust in that place.
DaveE.
To Walt Meier: Just before the big storm, sea ice was tracking exactly on the 2007 record (not below). And you cannot definitely say what would or what would not have happened without the storm (faulty logic).
I don’t know whether this link will work outside the UK. The Met Office provide weather forcasts and background information for the BBC. In this video John Hammond (no, not the Dylan-Springsteen CBS one) from the Met Office even uses the phase ‘global warming’, but does not mention any weather events such as artic cyclones.
“Arctic sea ice melt set to break record”
http://www.bbc.co.uk/weather/features/19362809
We need more windmills and solar panels, the earth is doomed due to man and his destructive nature. Sod houses and bicycles for everyone but the people in China and India. 🙂
Notice that the axis of the graph begins at 2, not zero.
Anthony I think you are missing a key point, it doesn’t matter too much what the weather does anymore. Whether you have persistent unusually high pressure over the Beaufort coupled with low pressure over Eurasia such as in 2007, or this summer that didn’t have as favorable weather as in 2007, but had an early August storm, the ice cover continues to be anomalously low in summer. The ice is thinner than it was 20-50 years ago, so that it melts out more easily in summer.
REPLY: It doesn’t matter what the weather does anymore? Really? I’m sorry but I just can’t accept a statement like that given some of your previous posts on the subject here. And, tell me please, why don’t you report in your public announcements your “much greater accuracy than daily products based on singlesource satellite data.” product, MASIE, that shows extent at 4.7 million sqkm on August 26th?
Why hold back a “new and improved” system? – Anthony
I see Peter Gleick has popped up commenting on Mann’s tweet, maybe Mann could use him as a character witness in his upcoming trial?
REPLY: Thanks Walt, have you ever considered we may be at/near the bottom of a natural cycle? How can you rule that out without data much beyond 30 years? There’s historical anecdotal evidence of very low Arctic sea ice in the past where you have no data. – Anthony
——————-
Anthony, what evidence would that be?
When we track the rate of recovery from this low, I predict the earliest and fastest rate of recovery of the ice pack (early and rapid re-freeze) for the satellite era. If and when, I will proclaim that we are in a new era of colder climate, and have reached an unprecedented “tipping point” for the next reglaciation.. What is good for the goose…
All that ice gone… oh dear. Cuz ice is such a good thing. You can grow food on it for example…. ooops….well I’m sure it must be good for something based on all the wrining of hands over it melting….. If we just know what that something was…..
I know one thing it is NOT good for, and that is warming. Yup, all that ice is part of the thermostat mechanism. Ice gone, what happens? Well a major albedo change for one. Instead of ice that reflects incoming SW back out to space we have water that incoming SW slices right through and gets absorbed at depth. Then there’s the now exposed surface of the water that radiates more LW to space than the snow and ice that no longer cover it did.
So…. the cooling trend begins….
I have a question for the Meteor Ologists (IANAM) relating to the: “The Great Arctic Cyclone of 2012″, and also the great Isaac no show of Aug 2012, which sadly is not going to upset the foreshortened Republican convention in Tampa Fla. Seems like just a few days ago, weather reports said it was going to reach category 4 by the time it got to the mainland. Well it needs to get out of the storm class first.
So ok, these animals are supposed to be driven by, and feed off the hot ocean surface waters.
So just how does one get “The Great Arctic Cyclone of 2012″ out over the Arctic Ocean ? That was a spectacular satellite photo you showed a few days ago, but how does the Arctic ocean feed such a thing, but far warmer sea surfaces don’t ? Do they ever get “cyclonic storms” over the Antarctic Continent ?
The present sea ice crash is spectacular, so it will be interesting to see what happens in the rest of “The Melt Season. ” So we can expect extra arctic ocean evap , so some good future snows somewhere
Hey Walt,
did you happen to notice the maximum extent last winter- higher than in many years?
WUWT?
REPLY: Thanks Walt, have you ever considered we may be at/near the bottom of a natural cycle? How can you rule that out without data much beyond 30 years? There’s historical anecdotal evidence of very low Arctic sea ice in the past where you have no data. – Anthony
After two years of digging into North Atlantic SST, it is obvious to me that the AMO is at top of the cycle.
http://www.vukcevic.talktalk.net/Sun-Earth.htm
Since the AMO is measured south of Iceland it might take a 2-3 years more for the peak of the energy (heat) cycle to reach the Beaufort gyre, so even more scaremongering is the store for few more summers.
Nature will do its thing weather we like it or not.
Julienne Strove, are you arguing that human CO2 emissions are the cause of the current Arctic ice decline? If so, post your evidence, per the scientific method: testable, quantifiable scientific evidence, directly attributable to human CO2 emissions.
Otherwise, the default position must be natural Arctic ice variability, which has happened repeatedly during the Holocene, is happening. That is the null hypothesis. Arctic ice melt has occurred at other times in the 20th Century [in the 1920’s and the 1960’s], and is documented in Royal Navy observations in the 1800’s. The same cycle has happened throughout the Holocene. Why would the current cycle be anything but natural?
Post your evidence of human causation, if you have any.
Climate “scientists” now have a convenient scapegoat for every anomalous weather event (especially those with negative impacts) which occurs in the Northern Hemisphere between now and April 30th. 2013…..
Good to see coverage of the record ice melt on WUWT. This is another example where the IPCC models got it wrong. They predicted a slower decline Arctic sea ice extent than is being observed.. At least the IPCC and climate scientists have been correct in predicting that warming would be much faster at higher latitudes.
REPLY: Thanks Walt, have you ever considered we may be at/near the bottom of a natural cycle? How can you rule that out without data much beyond 30 years? There’s historical anecdotal evidence of very low Arctic sea ice in the past where you have no data. – Anthony
Anthony, we can also go back somewhat reliably until 1953, so are you suggesting that we may be at the bottom of a 60-year cycle? Or longer?
Harrah! Harrah!
The Little Ice Age will soon be over and we will return to a “climate optimum”!
Farming on Greenland! Wine from Great Britain!
Larger fields of “amber waves of grain”!
The end of hunger
(or more food to burn in our cars so we decrease the surplus population)!
….or
so much snow that the new glaciers will start due to the early arctic radiating energy away, and the awol solar cycle 24 max, …
Ooops,
I forgot, Grandpa Baby Boomer knows all: we’re guilty sinners addicted to:
– long life, good health, prosperity, technological progress,
adequate food supplies, internet services, freedom of movement,
protection from environmental threats, etc.
Repent and be saved: get ye back to your cave and starve!
The bosses, with good goberment jobs/grants/medical/retirement, tell you so!
LOL in Oregon
Walt, long term changes? What are they? And please don’t list the symptoms, list the causes. The conflagration of pressure systems, weather, and oceanic conditions today cause today’s land and ice surface temperature as well as today’s ice symptoms. Averaged over the long term, these day to day ice symptoms are only that, symptoms, and they compose your trend. So please tell me how the weather has changed over time, how the oceanic currents have changed over time, how the pressure systems have changed over time. Saying temperature has changed over time is a symptom. Saying ice has changed over time is a symptom. CO2 cannot overcome these parameters. Not enough joules. Can CO2 make them worse? Can CO2 make them occur more frequently? If you say yes, these changes would show up in the measurements of pressure systems, weather and oceanic conditions. Have they? Show where the trend in these drivers, matches the trend in symptoms. That is the first request.
The second request is to show how the trend in CO2 matches these other trends.
The third request is to explain the mechanism. Simple correlation is not enough (for example CO2 and temperature). Two things can be correlated because a third thing is the driver of both.
Let’s get it out the way. The next few years will probably be well above, so we might hear no more about downward trends.
Mind, when next year comes in higher, I expect warmists will say it would have been lower than 2012 if it had not been for the big storm!
BillD, we have a new paper just published: http://www.agu.org/pubs/crossref/2012/2012GL052676.shtml
This paper compares the next round of climate models with the observations. They better represent the mean state of the ice cover than the models in 2007 IPCC report, and they also generally simulate faster rates of decline, though many are still slower than observed. Interestingly though is that the uncertainty as to when an ice-free Arctic may be realized remains about the same in the earlier models.
“””””…..waltmeier says:
August 27, 2012 at 9:39 am
Replying to Anthony: I agree. We can’t say that we would’ve set a new record even without the storm. But we also can’t say the the storm led to the record – we might’ve set the record regardless of the storm. …..”””””
Well Walt, what other non information are you willing to share with us ? You know we really admire your willingness to come here and give us your insights or even opinions; but your response to Anthony surely rates as one of the all time CYA statements. Surely your terraflop computers are able to render an opinion, even if nobody knows whether that is a prediction or a projection, or even a projection of a prediction.
No gold star today Walt.
We have a reclaimed sewage settling pond outside of town that is excellent for fishing summer and winter ice fishing. It is affectionately called the “Turd Pond”. I am going to begin to record the ice thickness and timing of freeze and breakup for it as the Turd Pond ice stats probably have as much relevance in the overall scheme of climate, particularly with respect to AGW, as do the Arctic stats. Other than possible shipping consequences, why should we care?
Smokey says:
August 27, 2012 at 10:03 am
What Smokey said, exactly. And please try to show some interest in empirical fact. Dismissing recent cyclones and their effects reveals a powerful lack of interest in the phenomena under study. We are investigating Arctic sea ice and what affects it, right? I would say that the recent cyclone necessarily falls within our investigation.
hmmmm. Who do we blame the too small to fish with grasshoppers in NE Oregon? They aren’t small for lack of food or water, they are small in size and number because of a cold, cold Spring. And CO2 caused that how?
Just seen this headline oh the BBC news.
Just been one of the coldest wettest summers in 100 years in the U.K.
Its currently cold, wet raining and windy. People remember the forecasts of a long hot summer and hosepipe bans for us this summer.
Its almost that cold we are switching our heating on. It’s August FFS.
Global warming my arse.
When the goin’ gets tough, make lemonade!
Double-check the IP source address; someone has got to be coming in as a ‘ringer’ and posing …
[Reply: No, that is actually a real government climate scientist. ~dbs, mod.]
.
JohnB says:
August 27, 2012 at 9:56 am
How’s this?
Within 5° of the pole & no ice, that’s 300nm.
As I recall Syedoff was frozen in on Dec 18th & free again by Valentines day 1939.
DaveE.
good news for the trans arctic canoeing expedition.
Whatever happened to those guys ?
I remember a previous article on WUWT back in 2008[1] highlighting an article[2] on the Monthly Weather Review for November 1922.[3] In that report a Captain Ingebrigtsen remarked the temperature around Spitzbergen had been recorded at 15 degrees C. and that “last winter the Ocean did not freeze over, even on the North coast of Spitzbergen”.
It is remarkable that the 1922 article says “The warmth of the waters makes it probable that favourable ice conditions will continue for some time”.
The definition of “favourable ice conditions” seems to have changed in only 90 yrs!
Lets see if the Ocean freezes over on the North coast of Spitzbergen this winter, if so it might indicate (as I suspect) that 1922 was warmer (with more favourable conditions) than today in that area.
[1]http://wattsupwiththat.com/2008/03/16/you-ask-i-provide-november-2nd-1922-arctic-ocean-getting-warm-seals-vanish-and-icebergs-melt/
[2]http://wattsupwiththat.files.wordpress.com/2008/03/changing-artic_monthly_wx_review.png
[3]http://docs.lib.noaa.gov/rescue/mwr/050/mwr-050-11-0589a.pdf
Thoughtful Questions:
a) Without the “ice cap” on the Arctic Sea [preventing evaporation], will there be more escaping heat from the sea during winter?
b) If a) above has more heat loss, does the planet cool faster?
c) If a) above has less heat loss, does the planet warm faster?
d) Does less ice or more ice have a greater effect on Weather in Europe?
e) What about the Antarctic region: it has more ice. Is it getting warmer or cooler during winter?
f) What is causing the +10F [4.5C] pool of water east of Japan? Is it warming the Arctic Sea?
g) What happened [or is happening] to the El Nino this year?
h) Most important! In our modern era, is salty ice good for anything other than making ice cream?
JohnB says:
August 27, 2012 at 9:56 am
——————-
“Anthony, what evidence would that be?”
Oh please! This has been discussed so much your implication that there is no evidence is laughable. Start reading with the year 1817 and work your way to now. That 1817 date is 2 years after Waterloo so maybe the melting can be related to the battle – you know, all the big tanks, Humvees, and SUVs burning oil. Maybe not. Edwin Drake’s oil well didn’t come along until 1859. Sort of rules oil out.
Start here:
http://www.john-daly.com/polar/arctic.htm
Paper finds Arctic sea ice extent 8,000 years ago was less than half of the ‘record’ low 2007 level
A paper published in Science finds summer Arctic Sea Ice extent during the Holocene Thermal Maximum 8,000 years ago was “less than half of the record low 2007 level.” The paper finds a “general buildup of sea ice from ~ 6,000 years before the present” which reached a maximum during the Little Ice Age and “attained its present (year 2000) extent at 4,000 years before the present”
http://hockeyschtick.blogspot.com/2012/08/paper-finds-arctic-sea-ice-extent-8000.html
Smokey says: August, 2012 at 10:03
“It has occurred even in the 20th Century [the 1920’s and the 1960’s] and is documented in Royal Navy observations in the 1800′s. Why would the current cycle be anything but natural?”
So Smokey, are you suggesting that this low sea ice extent happened before in the 1920s and in the 1960s? Can you show us the undeniable evidence for that claim please that sea ice extent was just what it is right now in those years.
Scientific evidence please so that I can verify it myself. Not blogs. You are asking (sorry … demanding is a better word here) the same of Julienne Stroeve.
melt baby melt
I think we’re missing Walt’s point here. We cannot say with any confidence that without the storm the new low would not have occurred. Given the trend, a new low is pretty much inevitable.
The trend is LINEAR, just like everything else (e.g., global mean temp and global mean sea level). This is both a strong argument that the globe is warming and a strong argument that it’s not a catastrophe.
The data supports a moderate skeptical position. We should be happy with that and play our hand accordingly.
The ice looked very sparse this spring and many folks back then were concerned that we were set to break the record this year. If we make enough over-the-top arguments, this kind of news can be turned into a defeat for the skeptics position.
So, we’re saying it’s just one storm that made all that ice melt? If that type of storm had hit 30 years ago, would all the ice have melted then, too?
REPLY: Never trust a statement that begins with “So,….” as you know it is disingenuous.
No, we are saying this storm exacerbated the melt underway. And since such things weren’t tracked over 30 years ago, nobody can say with certainty that this is an unprecedented event. Really the conceit that we understand the Arctic and planetary cycles from 30 years of satellite data is laughable.
Have a look at this recent paper: http://hockeyschtick.blogspot.com/2012/08/paper-finds-arctic-sea-ice-extent-8000.html
– Anthony
The BBC are hyping it up as usual. “Could be all gone by next year.. could cause huge releases of methane… which could add to an already overheating planet… 70% definitely caused by humans…” on and on… “Garmany calling, Garmany calling… “
David A. Evans says:
August 27, 2012 at 9:41 am
First, I agree with you about Walt Meier’s openness – in general though, others there and their trustworthness is hard to evaluate – except for one or two others, do names come to mind? Mostly not, but I assume most folks there try to do an honest day’s work.
——————————————————-
On the following blog . . .
http://notrickszone.com/2012/08/25/genius-taz-leftist-paper-arctic-sea-ice-now-600000-sq-km-less-than-2007/#comments
. . . I made a similar statement to your’s about lack of ice (on the Arctic Ocean) being a negative influence on temperature in the N. H.:
I said:
My take on the low ice cover on the Arctic Ocean is this allows for more rapid heat loss from the water to the atmosphere and space. Albedo is high with a small sun angle and a decreasing one as that area transitions to a no-sun winter. TAZ type folks keep telling us the atmosphere (because of a rising CO2 concentration) should be warming rapidly. That seems to have stalled and corresponds time-wise with the lower ice minimums of the last decade or so. If I were a conspiracy type, I would be asking who is paying “climate scientists” to NOT investigate the connection between these two variables.
This old earth was created to die and be destroyed, we are at the end of the life giving cycle. Ever think of that? It’s just as accurate as “it’s been here billions of years and man is destroying it.”
What’s holding back release of ice-extent-estimates based on the pre-1979 military satellites? (Along with sample photos of extremes from that range.)
is this a joke?
That ice was going to melt anyway because it was already at very low concentration as the NSIDC explain in the previous report.
John F. Hultquist says:
August 27, 2012 at 10:29 am
JohnB says:
August 27, 2012 at 9:56 am
——————-
“Anthony, what evidence would that be?”
Oh please! This has been discussed so much your implication that there is no evidence is laughable. Start reading with the year 1817 and work your way to now. That 1817 date is 2 years after Waterloo so maybe the melting can be related to the battle – you know, all the big tanks, Humvees, and SUVs burning oil. Maybe not. Edwin Drake’s oil well didn’t come along until 1859. Sort of rules oil out.
Start here:
http://www.john-daly.com/polar/arctic.htm
————————
I started there, and found: “useful data on ice extent and thickness only dates from the 1950s”
Frederick Michael says:
August 27, 2012 at 10:35 am
Using words that an empiricist might use, you continue to counsel that we ignore this huge recent change in the Arctic, the cyclone. You are counseling that we ignore part of the data. Can you not see what you are doing?
Do not be fooled by a false dichotomy. The question is not cyclone versus radiation driven melt. There are many facts to be explained and the cyclone is just one of them. But to ignore it is to ignore facts and to ignore what might be crucial evidence.
Julienne, can you please cut to the chase here and just answer a simple question? Are you saying we’re supposed to still be in the same climate that we had in the 1960’s and 1970’s?
It seems you all are just beating around this bush but not saying the words. You keep comparing today’s climate to that period through alarming announcements of diminishing sea-ice extent Are we supposed to be in that climate again? Did man alter that pristine cooler 1970’s climate forcing our moderately warmer current climate? Do you believe that humans have brought an abrupt stop the natural cool and warm and cool and warm cycles locking us into a permanent warming? Have we ruined the chances for another Little Ice Age?
I’ve heard some whoppers in my many years but these last two really take the cake … (1) That this past July was the hottest in all history (anyone not born yesterday knows better), and (2) That CO2 is behind the melting of Arctic sea-ice (but somehow ignores every place else!). Where were you 4 months ago when extent hit the long term average (and probably exceeded it but for a suspicious satellite problem once again). Did the CO2 concentration drop 4 months ago and suddenly return to normal at the solstice? Do you in fact believe in whoppers (1) and (2)? Serious question.
BTW, you must know full well that many uneducated people are being tricked by this since they start to believe that permanent ice is gone, not bi-annual water freezing and thawing as it always does when the axial tilt is aiming away from the sun. There are two insidious propaganda angles to this climate pseudo-science seen spread by kooks like Joe Romm, and it looks bad when people like you let it stand. You should be countering their garbage by pointing out that all of the so-called melting in the Arctic is the same water that freezes and thaws annually, and also that nothing about sea-ice affects sea-level. Both these things get confused in the general publics’ mind, and I suspect that Serreze is just fine with that. Are you?
Julienne Stroeve says:
August 27, 2012 at 10:08 am
REPLY: Thanks Walt, have you ever considered we may be at/near the bottom of a natural cycle? How can you rule that out without data much beyond 30 years? There’s historical anecdotal evidence of very low Arctic sea ice in the past where you have no data. – Anthony
Anthony, we can also go back somewhat reliably until 1953, so are you suggesting that we may be at the bottom of a 60-year cycle? Or longer?
——————-
Longer than 60 years, if we are seeing a cycle. A 60 year cycle would show a minimum in the early 1950s. The data we have shows the 1950s and 1960s as maintaining a fairly uniform high level of ice extent, then starting a long term decline in the 1970s.
http://nsidc.org/icelights/files/2010/11/mean_anomaly_1953-2010.png
Regarding the pre-measurement historical record we see a possibility of warmer conditions for the Vikings in the MWP(a 1000 year cycle?) The 1800s consist mostly of optimistic anecdotes by the likes of Parry and Franklin, designed to encourage the Admiralty to keep looking for the North West Passage.
george e smith says:
August 27, 2012 at 10:13 am
Walt is using the false dichotomy of cyclone or radiation melt in his response to Anthony. He fails to address part of the facts to be explained, the recent cyclone and its effects on Arctic ice.
Julienne Strove (or whoever is pretending to be her) says:
Anthony, we can also go back somewhat reliably until 1953…
Julienne, I’m curious. What data collected before the satellite era does the NSIDC consider somewhat reliable?
Also, everyone please be courteous to Dr. Meier. We may not always agree with him, but he has always been a stand-up guy here on WUWT.
REPLY: there’s no pretending, that is actually her – Anthony
Regarding my earlier comment
I recall at the time many of the true deniers saying the reports were a spoof, and they based this on the name of the reporter, one Harold Denny which they took as a variation of deny!
Denny was actually a renowned reporter in the ’30s and many of us found the reports quickly and then linked. The report has since disappeared behind a paywall, I wonder why?
I think Mary Hinge, (The nick is based on a Spoonerism of an old joke,) was one of the disparaging commentators. Not seen Mary for some time.
Would be interesting to know how much of this year’s melt was due to the warm water from the 2010 el nino event finally making its way to the Arctic.
I found these two links a day or two back. The first describes a gradual reduction in the amount of cold water accumulating on the Antarctic sea bed (the AABW). The second describes a possible link between reduced AABW and superwarming episodes in the Arctic during past interglacials. These reached temperatures several degrees above current levels.
Whether caused by natural variation, or triggered by cAGW, consider the hypothesis that we are moving into a superwarming episode.
http://www.noaanews.noaa.gov/stories2012/20120320_antarcticbottomwater.html
http://www.dailykos.com/story/2012/06/22/1102148/-Shocking-Interglacial-Shift-to-Hot-Arctic-Tied-to-Rapid-Antarctic-Ice-Melt
Louis Hooffstetter says:
August 27, 2012 at 11:08 am
Julienne Strove (or whoever is pretending to be her) says:
Anthony, we can also go back somewhat reliably until 1953…
Julienne, I’m curious. What data collected before the satellite era does the NSIDC consider somewhat reliable?
————————-
Here it is again.
http://nsidc.org/icelights/files/2010/11/mean_anomaly_1953-2010.png
Anthony, you probably understand that when the ice cover is thicker, storms like what happened this August, or the summer dipole anomaly may cause a change in ice volume, but it won’t be reflected in a change in ice extent (and actually storms tended to have the opposite affect on the ice extent – they would actually increase the ice extent). That is the point you seem to be missing. For a thinner ice cover, the same storm, or the same dipole anomaly pattern will not only translate into a loss of ice volume, but also a loss of ice extent.
Blade, our report is based on the modern passive microwave record which is the most consistent data record out there. We can also go back somewhat reliably to 1953, and efforts have been made to go back to 1900 and in all those efforts the last few summers have had the lowest extents. Also, the winter ice cover will come back like it always does, and there is little correlation between winter extent and summer extent. Even if the winter extent is about normal, the ice that forms in winter is first-year ice that tends to be about 1.5m thick, and a large part of that will melt in summer. The thickness of the winter ice on the other hand is a factor behind what the summer extent will be. So if you are transitioning towards more first-year ice and less multiyear ice (which is what these large ice losses in summer are resulting in), then you will continue to have summers with less sea ice. If you also look at the temperature anomalies in the Arctic over the last decade you will find they are anomalously warm in all seasons. You also find the melt season happens earlier and ends later, which in turn helps to enhance the ice-albedo feedback. It doesn’t surprise me in the least that this summer became a new record low given the climate patterns over the last several years.
Louis, the data set I’m referring to was developed by Chapman and Walsh, and is part of the Had1SST data set. Several publications have referenced that data set, including our recent one I linked to earlier in GRL.
Robbie says:
“…are you suggesting that this low sea ice extent happened before in the 1920s and in the 1960s? Can you show us the undeniable evidence for that claim please that sea ice extent was just what it is right now in those years.”
Sorry, I can’t provide ‘undeniable’ evidence, because you will just reject it as being a lot of inconvenient observations.
Julienne Stroeve says:
“If you also look at the temperature anomalies in the Arctic over the last decade you will find they are anomalously warm in all seasons.”
Julienne, if you also look at the temperature anomalies in the Antarctic since 1957, you will find they are anomalously cold in all seasons.
When discussing global warming, regions such as the Arctic are only a part of the big picture.
John F. Hultquist says
I first made my comments about albedo & energy loss from an ice free Arctic ocean at least 2 years ago, closer to 5 years ago in private conversations with the late Jan Pompe.
My first hypothesising here was probably under the nick DaveE, as I said, about 2 years ago.
DaveE.
Err like I said back in July, we are poised to break the record and if we get bad weather we will crush the record.
http://wattsupwiththat.com/2012/07/03/seat-ice-news-volume-3-number-7-the-next-arcus-sea-ice-outlook-forecasting-poll-for-2012-is-online/#comment-1023687
Simply put. Given the volume of Ice in July, assuming a normal influx of heat (look at SSTs and heat flux into the arctic region), assuming a normal amount of solar radiation during the season, we were poised to set a record. The only way we could not set a record was if we got abnormal weather. The weather we got helped to beat the record that was already in the cards from day 1. Given the state of the ice ( as I explained before the storm hit ) the record which was already in the cards, was bound to get smashed.
As for this being part of a natural cycle? Yup. more heat means less ice. utterly natural.
Now, comes the question, why is it warmer? So, yes warmer weather in the long past may have melted the arctic cap to where it is now. The question is why is it warmer now.
TSI hasnt increased.. what could it be? grelims?
Lets roll tape: We can all make fun of Zwally. Check out what other folks said.
http://wattsupwiththat.com/2012/08/04/sea-ice-news-volume-3-number-9/#comment-1052637
Heres someone who said the ice wasnt thin.
http://wattsupwiththat.com/2012/08/04/sea-ice-news-volume-3-number-9/#comment-1052752
here is somebody who thinks the storm wasnt that rare.
http://wattsupwiththat.com/2012/08/04/sea-ice-news-volume-3-number-9/#comment-1052815
here is somebody who thinks that falling below 4M km is not likely.
http://wattsupwiththat.com/2012/08/04/sea-ice-news-volume-3-number-9/#comment-1052842
here is jeez.. betting
http://wattsupwiththat.com/2012/08/04/sea-ice-news-volume-3-number-9/#comment-1052961
here is bill again calling the storm normal.. thats ok. I like that logic. normal storm rips up the ice. not so normal.
http://wattsupwiththat.com/2012/08/04/sea-ice-news-volume-3-number-9/#comment-1053138
Soot makes a return. It was the soot that dun it! err. not in past I suspect.
http://wattsupwiththat.com/2012/08/04/sea-ice-news-volume-3-number-9/#comment-1053461
Watch volume. as the volume goes, so goes the ice. If the same volume spreads out to the same extent.. watch out, you will be in for surprises if normal or abnormal weather hits.
you will know you’re a fake skeptic if you try to struggle with the fact of their being less ice in the arctic. You will know your are struggling with that fact if you.
1. start to question every metric you’ve relied on in the past.
2. change the topic to the south pole.
3. Blame things that cant melt ice ( like wind). heat melts ice.
4. search around feverishly for one chart that supports your position.
5. Forget your own mistakes and focus on others.
A real skeptic would shrug his shoulders and say.. “Sure there is less ice, sure warmer temps plays a role, but we have no knowledge about why its warmer” That’s at least a defensible position. No knowledge is a standard skeptical position. But if you find yourself twisting and turning to reject the fact that there is less ice, well then..you might want to consider.. what would you say if there was zero ice. You better think about that argument because you’ll have to make it in the not too distant future.
Frederick Michael says:
August 27, 2012 at 10:35 am
“I think we’re missing Walt’s point here. We cannot say with any confidence that without the storm the new low would not have occurred. Given the trend, a new low is pretty much inevitable.
The trend is LINEAR,”
The satellite era trend is plausibly linear but that is over a short duration. The linear decline does not look so convincing if the years 1973 to 1979 as shown IPCC FAR WG1 are added to the chart. In this chart, 1974 appears to be at least 1.6 million km2 below the 1979 peak extent. Hardly the stuff of a linear trend. At least NSIDC qualifies the announce as lowest of the satellite era though they never extend the qualification by mentioning that the starting date 1979 was a local peak in Arctic ice extent with periods of lesser extent evident prior to that starting date.
Smokey says:
August 27, 2012 at 11:27 am
‘undeniable’ evidence
—————————–
If we had undeniable evidence this debate would not be happening. Statistical information such as 95% conficdence limits gives us some idea of the reliability of our measurements and laboratory studies and models can help us understand the process behind them.
Once we go back beyond the time periods covered by our measurement record we have to use proxies, anecdote and other less reliable information.
In science peer review and replication act as quality checks, which is why peer-reviewed papers tend to be taken more seriously (and why Watts.2012 will need to pass peer review). Cheating usually shows up because it fails to fit in with later work by others.
For non-specialists, it comes down to making what independant checks we can, and to the settings on our own B.S. filters.
I’m not going to start worrying until the same thing starts happening to the Antarctic sea ice. Until then, it’s not part of a global phenomenon, it’s merely an interesting local one.
Julienne Stroeve says:
August 27, 2012 at 11:26 am
…………..
Your paper is beyond ‘pay wall’, not all of us are AGU members.
I am puzzled by your claim :
Pointing to strong impacts of internal climate variability, 16% of the ensemble member trends over the satellite era are statistically indistinguishable from zero. (abstract)
Natural variability would suggest at least 3 years and possible up to one more decade of low Arctic summer ice coverage. I base this on study of the North Atlantic SST
http://www.vukcevic.talktalk.net/Sun-Earth.htm
Perhaps I am expecting too much of you to make the paper available, but it wouldn’t be unreasonable to ask for expand on the ‘natural variability-anthropogenic factor’ ratio.
Smokey says:
August 27, 2012 at 11:37 am
Julienne, if you also look at the temperature anomalies in the Antarctic since 1957, you will find they are anomalously cold in all seasons.
———————————-
This is why you are not taken seriously, Smokey. The data are avaliable, here for example.
Browse among the data for a while and then bring us back something to convince us that you are correct
Entropic,
I posted a chart that is based on raw temperature data. The fact that you wish to reject it indicates a closed mind.
Steven Mosher says:
August 27, 2012 at 11:41 am
Good post up until the last sentences.
Mosher says:
“what would you say if there was zero ice. You better think about that argument because you’ll have to make it in the not too distant future.”
If Mosher were a “real skeptic” he would not display 100% confidence in the linear death spiral meme. The satellite era is just too short to rate 100% confidence in such predictions even where one presumes AGW.
CRS, Dr.P.H. says:
August 27, 2012 at 9:17 am
Just noticed the “Death Spiral” myself! Anthony, you said:
Neither Borenstein nor NSIDC’s current announcement mentions the massive Arctic storm that broke up huge amounts of sea ice, making this new record low possible.
======================================================
http://news.yahoo.com/arctic-ice-melts-record-low-us-researchers-171243395.html
“Mark Serreze, director of the center, said that the record was all the more striking as 2007 had near perfect patterns for melting ice, but that the weather this year was unremarkable other than a storm in early August.
“The ice is so thin and weak now, it doesn’t matter how the winds blow,” Serreze said in the statement.”
The ice is sooooooooooooooooooooooooooooo thin and weak…….
Let’s feed the ice !!!!!
Steven Mosher says:
August 27, 2012 at 11:41 am
The question is why is it warmer now.
TSI hasnt increased.. what could it be? grelims?
No ‘grelims’ Steven, too cold up there for them.
It is very simple, as I outlined in my post at
http://wattsupwiththat.com/2012/08/27/sea-ice-news-volume-3-number-10-part-1-new-arctic-extent-record/#comment-1065927
I suspect you wouldn’t bother with it.
However, I invite you to look at the bottom graph here:
http://www.vukcevic.talktalk.net/Sun-Earth1.htm
.
Why the silence on the new IMS ice data which shows 2012 ice melt unremarkable and still way above the 2007 low? (See WUWT sea ice page).
There is a HUGE discrepancy between the new IMS (International multi-sensor) Arctic ice trace and all the others i.e. IARC-JAXA, Norsex and DMI. These others all show arctic ice in free-fall below 2007 levels, well into record territory, while IMS shows 2012 ice to be within the pack similar to the last 6-7 years, albeit today at the bottom of the range. But still way above the 2007 minimum.
Which is right? Or are criteria different? In previous years the arch-warmist RGates was always saying “wait till we have the IMS – this will give us the true picture”.
tomwys says:
August 27, 2012 at 9:11 am
An open Arctic Ocean means more moisture availability for the Polar Easterlies!!!
Watch for more “Ocean-Effect” snow to add to Greenland’s snow/ice depth, wiping out the “loss” from the brief early August “melt” so eagerly pounced upon by the AGW crowd!
____________________________________
I was thinking the same thing.
Anchorage Alaska had record snows last winter and the snow was not melting out.
It would be ironic if thanks to this “Ice Free” Arctic we get a polar express jet stream locked in place, and the USA gets blasted with severe cold and snow the first week of November.
I am in mid NC and it was a chilly 64F (18c) last night and 59F (15C) the night before. August is supposed to be HOT.
vukcevic, if you email me at stroeve at nsidc.org I will send you a copy of the paper.
[Address edited to avoid automated spam seekers. Robt]
Steven Mosher says:
“A real skeptic would shrug his shoulders and say… ‘Sure there is less ice, sure warmer temps plays a role, but we have no knowledge about why its warmer’.”
I think that is what most of us here are saying. The planet is still emerging from the Little Ice Age, but we don’t know all the reasons why, or why the LIA occurred in the first place. It was one of the coldest times of the entire Holocene. Why? We are not certain why.
The actual error is on the side of the climate alarmist crowd, which assumes that human activities are causing global warming. The fact that they have no scientific evidence to support their assumption seems to be irrelevant to them. Thus, their belief is no different than a belief in witch doctor juju. They cannot explain it, and they have no evidence for it. They simply believe it.
Julienne Stroeve says:
August 27, 2012 at 11:23 am
“Anthony, you probably understand that when the ice cover is thicker, storms like what happened this August, or the summer dipole anomaly may cause a change in ice volume, but it won’t be reflected in a change in ice extent (and actually storms tended to have the opposite affect on the ice extent – they would actually increase the ice extent). That is the point you seem to be missing. For a thinner ice cover, the same storm, or the same dipole anomaly pattern will not only translate into a loss of ice volume, but also a loss of ice extent.”
Well, at least you are willing to address the matter of storms. But you are unwilling to address the particulars of the storm in question. Everything you assert in this paragraph amounts to no more than a rule of thumb. I must say that you, too, lack all instinct for the empirical. Have you done some research on the facts of this particular storm? If so, I do wish that you would share them.
Is there a plotting issue again? I seem to remember that 2012 was much closer to average at one point this spring. Now it appears to be nowhere near the average.
Hi Anthony,
Since you are blaming the record ice loss in the arctic sea, to the storm.
Can you please answer and me this simple question : How did a “tropical cyclone” end up in the Arctic Sea in the first place?
Roger Harrabin on the BBC news:
Consider geo-engineering e.g. spaying the Arctic atmosphere with ‘particles’ …..
Theo, we don’t have the data/analysis in at this point to say exactly what the storm did (i.e. what sizes of floes did it break the ice-pack up into, what were the SSTs, how far were the ice floes transported, how much thick the ice was when it was broken up, how much melt happened as the ice pack spread out, etc. etc. What we do know is that the winter ice was thinner than last winter (from Cryosat) and that immediately after the storm, ice concentrations were already low in that region prior to the storm, and SSTs were colder than normal immediately after the storm, with warm water below. Then the SSTs increased later in the month.
I can’t quite understand the desire to ignore the fact that the ice is thin and prone to melting out. If you remember, 2002 was dominated by cyclones all summer. So why didn’t all those storms result in ice extent below 5 million sq-km?
What’s worse is that I wasn’t up there to make a margarita out of that slushy ice. Hell, it even came with salt. What’s not to like?
I see Mosher trolling in the comment threads again. Sorry Steve, if heat is causing the Arctic to melt, then the Antarctic should also be melting. The fact is we can’t account for this change. In any case, there’s no evidence to suggest that the loss of the sea ice pack will be anything but beneficial. If it is an indication of a permanent shift towards ice-free summers, this will be a boon to the shipping industry, reducing fuel costs (and emissions) by decreasing travel distances. It will also open up the sea floor to oil and gas exploration and mineral extraction.
The big melt this year occurred in 3 waves. The first in late-April, the second in early-June and then in early August when the storm hit lasting until today really.
The melt rate appears to be going back to average.now but these 3 big abnormally long melt periods are the reason the sea ice is so low.
Daily melt rate versus the average for Jaxa and NSIDC.
http://s18.postimage.org/h817h2e4p/NH_SIE_Daily_Ch_Aug26_12.png
Suffer no fools.
The ice extend graph is not very consistent with the Mean Temperature above 80°N graph showing constant below zero temperatures and also the webcams showing refreezing for a while…
Gail Combs says:
August 27, 2012 at 12:10 pm
Anchorage Alaska had record snows last winter and the snow was not melting out.
—————————
I do not have isobar charts handy for the US this year, but I did encounter a reference to Notherly winds giving Washington and North California a cooler Summer. The same airflow may have given Alaska its unusually cold weather.
With the jetstream locked at high latitude over the Eastern US and at low latitude over Europe for much of 2012, did Alaska and the US West coast get stuck with a low latitude jetstream and the colder weather to match?
Jim P. says:
August 27, 2012 at 12:34 pm
I see Mosher trolling in the comment threads again. Sorry Steve, if heat is causing the Arctic to melt, then the Antarctic should also be melting.
————————————
It is. The GRACE satellite data records a loss of 246Gt/yr and rising.
http://ess.uci.edu/researchgrp/velicogna/files/increasing_rates_of_ice_mass_loss_from_the_greenland__and_antarctic_ice_sheets_revealed_by_grace.pdf
JohnB says:
August 27, 2012 at 9:56 am
REPLY: Thanks Walt, have you ever considered we may be at/near the bottom of a natural cycle? How can you rule that out without data much beyond 30 years? There’s historical anecdotal evidence of very low Arctic sea ice in the past where you have no data. – Anthony
——————-
Anthony, what evidence would that be?
+++++++++++++++++++++++++++++++++++
Stuff like that is one reason most geologists laugh at the CAGW crap. Here is a Greenland graph.
A WUWT article on another paper link
And here is a paper Temperature and precipitation history of the Arctic
And another
And another
@DaveE – “Within 5° of the pole & no ice, that’s 300nm.
As I recall Syedoff was frozen in on Dec 18th & free again by Valentines day 1939.”
The article you link to says that the Syedoff had been frozen fast in polar ice for fourteen months, meaning some time about the beginning of October, 1937. They had been drifting – locked in polar ice – ever since. They were 300 nautical miles from the pole – in ice. They had to worry about being attacked by polar bears, which had not swum across open ocean to within 300 miles of the pole.
This article says nothing about extent of Arctic Ocean ice in the late 1930s, unless you can plot where the ship froze in, back in ’37. You now have one data point for 1937. Error bars? It isn’t science without error bars…
Julienne Stroeve says:
August 27, 2012 at 10:11 am
BillD, we have a new paper just published: http://www.agu.org/pubs/crossref/2012/2012GL052676.shtml
This paper compares the next round of climate models with the observations. They better represent the mean state of the ice cover than the models in 2007 IPCC report, and they also generally simulate faster rates of decline, though many are still slower than observed. Interestingly though is that the uncertainty as to when an ice-free Arctic may be realized remains about the same in the earlier models.
Thanks Julienne: it’s good to know that scientists are able to keep up with the speed of the ice melt. Sometimes reading climate blogs, one gets the impression that climate scientists and the IPCC are exagerating the rateof climate change and warming, not underestimating it. On the other hand, good scientific estimates are likely to be too high in some instances and too low in others.
To Gail @ 8/27, 12:10PM:
“I was thinking the same thing.”
It gets worse! Open Arctic also means “Ocean Effect” albedo enhancing snow in Northern EurAsia; somewhat less in Northern Canada for geographical reasons, but snow nonetheless.
Result? 70% of lingering sunlight (and its energy content) before it gets totally dark, gets reflected off the Earth. The Polar high pressure system gets colder and larger, and when parts of it sweep through North America and EurAsia, Gulf, Atlantic, & Mediterranean moisture sweeping into it falls as albedo enhancing snow.
Polar temperatures drop by 10 degrees F (as they did in winter 2007-2008) and Arctic ice will appear to recover next year as a result. But the 4 & 5 year Multiyear ice is gone and won’t come back, so watch for succeeding repeat performances in the future.
The die has already been cast, and CO2 was not calling the roll, as you can see by following:
http://www.colderside.com/Colderside/Temp_%26_CO2.html
Ewing and Donn figured it out a half century ago. Soon many more will!!!
Timing of abrupt climate change: A precise clock
Many paleoclimatic data reveal a ∼1,500 year cyclicity of unknown origin. A crucial question is how stable and regular this cycle is.
—————————
Mr. Watts, your last link describes a 1470 year periodicity in which 12 successive events occur quite evenly spaced. According to Figure 1, each shows a rapid increase in temperature, followed by a slightly slower decline back to normal. The last, 10,000 years ago, showed a rapid increase as before, but then a sustainded rise continuing to the present. Something has changed.
In my August 27, 2012 at 11:19 am comment I suggested a connection between Antarctic melting and the superwarming your links describe. Can you suggest possible candidates driving these changes, beyond the vague “natural variability” so beloved of sceptics writing here.
Has this WUWT article been cited yet?
http://wattsupwiththat.com/2012/05/02/cache-of-historical-arctic-sea-ice-maps-discovered/
It’s worth remembering the Arctic ice has been melting much quicker than the models predicted over the past decade, therefore with global temperatures not increasing during the same period this is very likely down to a change in the distribution of energy around the planet. This can therefore only be blamed on the natural cycle when distribution of energy (internally) over time periods are concerned. When the outgoing radiation and ingoing radiation hasn’t changed. Hence, this behaviour has not shown to be caused by CO2.
Smokey says: August 27, 2012 at 11:27 am
I see Smokey: Newspaper articles is real science, isn’t it?
You are demanding from Julienne Stroeve evidence “per the scientific method (testable, quantifiable scientific evidence)” and you only come up with a bunch of newspaper articles as “proof” for your own claims.
http://www.ngu.no/en-gb/Aktuelt/2008/Less-ice-in-the-Arctic-Ocean-6000-7000-years-ago/ (from the link in your first comment I replied to)
“However, the scientists are very careful about drawing parallels with the present-day trend in the Arctic Ocean where the cover of sea ice seems to be decreasing.
“Changes that took place 6000-7000 years ago were controlled by other climatic forces than those which seem to dominate today,” Astrid Lyså believes.”
It looks like you can’t even read either. Now what does Astrid Lyså think which forces could be responsible for the current trend in the Arctic Ocean?
Mosher, The Gremlin you search was pointed out by Vukcevic.
http://www.vukcevic.talktalk.net/Sun-Earth.htm
I would think that multi year ice will be removed more effectively by warmer sea temperatures from below than by warmer air temperatures from above.
I can see plenty of benefits to an ice free Arctic. Lets harvest those clathrates.
Entropic Man. And yet temperatures have been declining in the Antarctic for years. Perhaps you’re thinking that the present cool / ice house multi million year climate phase is coming to the end of it’s cycle, to be replaced by the hot house phase for the next 30+ million years.
Ray says:
August 27, 2012 at 12:37 pm
“The ice extend graph is not very consistent with the Mean Temperature above 80°N graph showing constant below zero temperatures and also the webcams showing refreezing for a while…”
If you click on the graph it will take you to another page with a chart of all the graphs starting in 1958. Looking at each year, the Mean Temperature above 80N is almost the same every year. If the temperature has been almost the same each year since 1958 obviously it is not the temperature that is the main cause of more ice melt. Must be something else. Perhaps Vuk is right after all.
David A., aka DaveE
@11:39
Sorry, David, I did not mean to imply or suggest the idea was original with me, nor did I mean to not give credit where and if due.
My main point was to agree with your comment about Walt M.
The rest I added as sometimes an idea expressed in a different wording may help the argument along. Also, I think P.G.’s “notrickzone” is a nifty site with an emphisis on German and European activities – he translates a lot of things from German to English, thus making it available to a wider audience – well, me anyway.
—————————————-
JohnB says @ 11:02
“I started there, and found: “useful data . . .” ”
[Until you can measure something and express it in numbers, you have only the beginning of understanding. Lord Kelvin]
Let’s assume I’m cutting firewood on the edge of my property and a mountain lion is watching me from the riparian zone not far away. My neighbor sees both of us but doesn’t bother to tell me so because she doesn’t know if it is one cougar or 2 or 3, doesn’t know its age, or sex, or when its last meal was. And she doesn’t know if I have seen the cougar and don’t care. She’s got no “useful data!”
In any case, others have pointed to many places for you to look. Maybe you can see something useful there.
Has the ice melted or has it simply spread out more so that more of it is excluded from the 15% calculation? I don’t know and I suspect none of the scientists know. It is a breathtaking assumption to say that it has melted from the evidence available, especially given the likelihood that the storm would contribute to a spreading of the ice components.
If this had occurred earlier in the year then there would have been a good chance that this reduced concentration of ice would be more vulnerable to melting, but given the lateness of the season the chances are that it won’t.
For what it is worth, my opinion is that we will see a much quicker increase in the total ice extent once the freeze sets in because of the greater extent of less concentrated, but still present, ice.
Entropic man says:
August 27, 2012 at 1:07 pm
…..
No mystery, temperature changes in the seas north of Greenland – Scotland ridge is not determined by short summer irradiation or CO2, but by the warm currents inflow. In the open seas warm inflow raises air temperature and in the iced area melts ice from below.
Temperature of the inflow is determined by the AMO (N.Atlantic SST) which happens to be at the multi-decadal peak , and may stay at high values for up to another decade (has 9 year short cycle) but it is expected than to fall back due to medium term 64-5 year cycle. Is there a longer centuries long cycle, it is not known.
Don’t worry guys. There will be a new record…
Tomwys. you said “But the 4 & 5 year Multiyear ice is gone and won’t come back, so watch for succeeding repeat performances in the future.”
But only if you ignore the fact that the AMO is still in a warm phase and will go to a cold phase in a few years. You also ignore the fact the sun is currently at or near it’s low maximum and is expected to have a long slow decline over the next few years.
The combined effect will put paid to Arctic alarmospherism. Get your crampons ready, you may be able to walk from Greenland to Iceland.
Tom in ice free Florida says:
August 27, 2012 at 1:39 pm (responding to)
Ray says:
August 27, 2012 at 12:37 pm
“The ice extend graph is not very consistent with the Mean Temperature above 80°N graph showing constant below zero temperatures and also the webcams showing refreezing for a while…”
If you click on the graph it will take you to another page with a chart of all the graphs starting in 1958. Looking at each year, the Mean Temperature above 80N is almost the same every year. If the temperature has been almost the same each year since 1958 obviously it is not the temperature that is the main cause of more ice melt. Must be something else. Perhaps Vuk is right after all.
What is the final link to that composite graph of the DMI data?
Anthony and others concerned about this summer’s storm, do you recall the storm of summer 2008 around the same time of year? On 29 July a storm originated in northern Siberia and slowly moved into the Chukchi and Beaufort seas. It reached a maximum intensity of 976 hPa (this year it was 964 hPa). The storm lingered over the Chukchi Sea along a closed track and during its weakening phase moved into the Beaufort Sea along the ice edge and eventually into the central Arctic where it dissipated. SSTs decreased as the storm moved into the region, the maximum decrease was as much as 2C in the coastal waters of the southern Beaufort Sea. No significant SST response was seen in the area covered by sea ice. The vertical mixing was enhanced by high winds associated with the storm that brought cold water to the surface in the coastal Beaufort Sea. In addition, the increased vertical mixing increased the mixed layer by about 5m. During the storm, the extent didn’t show the large changes it did this August. Satellite ice thickness show thinner ice this year than in 2008 – a reason why the August 2012 storm could impact the ice like it did.
All I can say is ice holes!
http://psc.apl.washington.edu/northpole/NPEO2012/WEBCAM2/ARCHIVE/npeo_cam2_20120729123519.jpg
http://psc.apl.washington.edu/northpole/NPEO2012/18.jpg
Entropic man says:
August 27, 2012 at 12:38 pm
…. With the jetstream locked at high latitude over the Eastern US and at low latitude over Europe for much of 2012, did Alaska and the US West coast get stuck with a low latitude jet stream and the colder weather to match?
__________________________________
I farm and am outside a lot and pay close attention to the weather both on the radar (Wundergound) and while outside. Normally the weather is from the west. In the last few years it has changed from being mostly from the west to all over the place. This is consistent with a change in the jet stream patterns from zonal to meridional flow. The blocking high over Russia in 2010 that caused a heat wave and the blocking high this year over the US midwest are typical of the meridional flow. This would seem to indicate the Dust Bowl of the 1930’s was also a time of meridional flow.
Vukcevic shows the AMO was in the same spot in the cycle graph in the 1930’s as it is in right now. The PDO however is in a different part of the cycle: graph from ftp://eclipse.ncdc.noaa.gov/pub/ersstv3b/pdo/pdo.1854.latest.situ.v3b.ts
A discussion on the PDO.
So perhaps S. Wilde is correct and it is driven by the change in the amount of energy into the tropical oceans from the sun.
@Matt G:
I’m glad you agree that Arctic ice has been melting and melting very quickly. Even a quick analysis of the ice volume dataset shows this pretty unequivocally.
The second part of your paragraph, however, is misleading. It depends on your definition of “global temperature”. Averaged global surface temperature does show a continued increase if 2012 and 2011 are included. But much more important, if ocean temperatures are included then the “global mass averaged temperature” is definitely increasing.
Finally, your last sentence is not correct. CO2 forcing on a complex system like the climate is not so simple. As you allude to earlier, internal modes are extremely important. And those internal modes are causing significant ocean heating and increased storm action. Since much of the ice thinning is due to subsurface melt, the ocean temperatures cannot be dismissed so casually.
Roger Harrabin has just been granted prime time News at Ten to tell the world that this is incontrovertible proof of CAGW. Apparently we are all doomed unless we give the UN all our money.
You might almost think he had been chatting with his ‘friends’.
All I can say there ain’t no global warming there hasn’t been any for 16 years check out AMSU satellite temps 600mb compare all years, So how in hell is global warming causing NH ice to melt.? Soot maybe yes may play a part so we will concede that one to the environmentalist
Dear me, predictions come in all sizes and types. In fact 4 out of the 5 key objections here were predicted back on August 12 and like pavlovs dogs, WUWT gladly ranted their hearts out.
The only prediciton which did not get fulfilled was sensor failure…. I must admit I’m a little surpised as WUWT always claims that DMI sensors have failed every time it drops like a stone. Funny satellites those which fail and then start working perfectly when eggshell thin ice re-forms very rapidly very late in the season….
However Anthony you are bending the truth, yet again. NSIDC is almost the LAST record to fall. Not the first or the only. But, of course, you had to wait until the situation settled enough before you could start spreading your poison so it would be believable.
I see a trend here. People on the board keep saying we’re recovering from the little ice age and so there should be a melt. Yet there is a second and almost constant thread which says that ice is recovering. These two opinions are diametrically opposed yet everyone here seems to think they make the case in two different ways.
WUWT has been making constant noise about how the ice is NOT melting yet the WUWT submissions for SEARCH have dropped by 1msqkm between 2007 and now.
Pinnoccio methinks your nose is growing.
As the weeks go on and the ice does not recover, you will, again, say absolutely nothing. You will only perk up again when the temperature drops to -100 for a week and generates 6 inches of flash frozen ice in a sudden spurt. Then again it’ll be a sudden and “unprecedented” re-freeze of the ice. Never mind the fact that the ice will not reach the 2006/9 low ice winter levels. The fact that the average winter temperatures around Greenland will be 30C – 40C higher than normal over a period of weeks, no let’s ignore all that.
Only on WUWT could the arctic sea loose heat all winter but not gain heat in the summer, creating a net effect of cooling which will then melt even MORE ce the following year.
Escher had nothing on the logic of WUWT. But of course it’s not logic is it. It is simply making any claim which could possibly be believed by anyone so that an incredible and impossible claim can be upheld.
True to form and true to type. Eeven more so as the whole site lacks logic so badly that nobody can see the basic inconsistency of the position. One key message I use to make people wake up and understand the position is the basic inconsistency of the denailosphere arguments. Argue one thing one day and another the day after. Never cross check to see if you are making sense, what good would that do? Belive me you make my case much more focibly than I could. All I have to do is point out the basic inconsistency of sites like this and I have people convinced.
What thousands of graphs and billions of lines of data will not do for the common person, WUWT does for me perfectly.
Keep it up. It helps me enourmously.
Julienne Stroeve says:
August 27, 2012 at 12:32 pm
“Theo, we don’t have the data/analysis in at this point to say exactly what the storm did (i.e. what sizes of floes did it break the ice-pack up into, what were the SSTs, how far were the ice floes transported, how much thick the ice was when it was broken up, how much melt happened as the ice pack spread out, etc. etc.”
Thank you. That is exactly what I wanted to know. When some important facts about the storm’s effects are known then we can have a delightful scientific discussion of them. Until then any discussion of the present ice melt is based on an incomplete set of facts.
Entropic man says:
August 27, 2012 at 1:07 pm
Timing of abrupt climate change: A precise clock
Many paleoclimatic data reveal a ∼1,500 year cyclicity of unknown origin. A crucial question is how stable and regular this cycle is.
—————————
Mr. Watts, your last link describes a 1470 year periodicity in which 12 successive events occur quite evenly spaced. According to Figure 1, each shows a rapid increase in temperature, followed by a slightly slower decline back to normal. The last, 10,000 years ago, showed a rapid increase as before, but then a sustainded rise continuing to the present. Something has changed.
_____________________________
It is called an interglacial. Remember? The Holocene is about 10,000 years old.
10,000 year Greenland Ice Core Graph
15,000 year Greenland Ice Core Graph
For the layman, E. M. Smith goes into the 1500 year cycles during the Holocene in detail in several articles accessed here. (Click on the titles for each article)
Kodos and thanks to Walt Meier and Julienne Stroeve for joining the discussion at WUWT!
When the cycle turns and we begin to get more ice, not less, will those so eager to jump on this as “proof” of AGW return to ‘fess up that they got it wrong? I doubt it somehow, but I do hope they prove me inaccurate. It’d be nice to see some adults the warmist crowd.
Moser: “You better think about that argument because you’ll have to make it in the not too distant future.”
No, Steve, it’s you alarmists who are claiming there is a problem and must FIRST show evidence of such problem! Get to work, Steve!
This is science, it’s unfortunate that I, a non-scientist, understand it’s underpinnings better than you.
New Oxford Dictionary: “problem”
“1 a matter or situation regarded as unwelcome or harmful and needing to be dealt with and overcome : ….”
There is no problem with the melting ice but the normal ones. There is only money, politics and a government-suckling culture. Climates go through periods of change AND STABILITY and ALWAYS HAVE. The very words “Climate Change” it should simply be “Climate”; change goes without saying. Like Wet Water.
Also, I note that your writing skills improve when you are talking about yourself.
Did I just read a fully paid up govt scientist poo-poo the idea we need 60+ years to see potential earth system cycles? Really? Jesus wept.
Smokey says:
August 27, 2012 at 12:02 pm
Entropic,
I posted a chart that is based on raw temperature data. The fact that you wish to reject it indicates a closed mind.
————————————
Smokey, there are two problems with your argument, the chart itself and its context.
This is your chart.
http://img141.imageshack.us/img141/3241/spannualkq5.png
The linear trend drops from -49.3 to -49.6 from 1958 to 2008, a decrease of 0.3C and a rate of change of 0.006C per year. By eye, I would estimate the 2 sigma boundaries at about =/-1.5C, a range between -47.95C and -50.95C . This is the range of variation from year to year which would be regarded as normal, regardless of any trend.(Always show these error bars if your software can generate them. If you include error bars, your charts are more likely to be taken seriously). With the error bars so much larger than the trend you are trying to demonstrate, your claim is not justified by the data.
You claim that if the Arctic is warming , the South Pole should be warming. The two are not comparable.
The Arctic is an ocean, partly surrounded by land. It interacts strongly with the Atlantic, the Pacific, Europe, Asia, North America and Greenland.This links it closely with weather, seasonal and climatic changes elsewhere.
The South Pole is the centre of a continental ice sheet 3000 metres thick, surrounded by ocean. It is isolated from outside influences by the winds and currents of the Southern Ocean, by the Polar Vortex, by its high latitude and by its high altitude. This is the last place on Earth likely to be affected by any climate change( though the West Antarctic Peninsula and some other coastal margins are showing signs of change).
Some history on Arctic warming.
Of note, the Arctic has been warming since the mid to late 19th century. Warming was particularly strong in the 1920/30s based on actual measurements.
http://www.colorado.edu/geography/class_homepages/geog_4271_f11/readings/week_12_13_serreze_barry_arctic_amp.pdf
The minimum wouldn’t have looked half as scary if the books hadn’t been cooked to stop the line crossing normal earlier this year.
I’ve been concerned for a while about the propaganda benefits for warming proponents that would ensue from any further reduction of Arctic ice below 2007.
They have been on tenterhooks for some years because of the failure of it to happen sooner.
I felt it was perfectly possible that it might happen on one or more occasions before the oceans shed the accumulated energy from the 20th century reduction in cloudiness , zonal jets and high solar activity.
What does surprise me is the recent closeness of the Arctic ice trend to the ups and downs of ENSO ten years previously.
1997 was a powerful El Nino year and 2007 was a high melt season.
1997 to 2001 was mostly La Nina and from 2007 to 2011 Arctic ice generally recovered a little.
2002 was another El Nino year and 2012 we have another high melt season.
So, for the future:
If the correlation holds then we have La Ninas in 2003 and 2004 so I’d expect an Arctic ice recovery for a couple of years then another dip to close to 2012 levels in 2015 which is ten years after the last real El Nino spike in 2005.
From 2005 to 2012 La Nina became more dominant so we should see a proper ice recovery from 2015 onwards perhaps encouraged by what will by then be a weakening AMO.
All we can do is wait and see.
Bookmark this post for future reference.
Just curious: how is the thickness? In 2007 we saw a “record” minimum sea ice by surface area but over the summer there was actually increasing thickness in the area that remained covered — a result of the high winds that caused the reduced surface area: the ice essentially stacked up. So satellite images showed less ice, whereas the total volume was close to “normal”, just concentrated in a smaller area.
I think this is an important consideration, and I’m personally a bit tired of seeing area figures bandied about in isolation from this more meaningful context.
Glaciers maximum in Norway last 11.000 years was aprox around 1750.
Glacier maximum at Svalbard last 11.000 years was aprox around 1910-20.
If the cooling in the LIA was not synchronized, why must the warming since be?
The BBC News at 10:00 pm laid it on pretty thickly. Apparently we can blame 30% of the ‘warming’ on ‘natural causes’; the rest of it…shock horror…is down to us. Hmmm.
Gail Combs says:
August 27, 2012 at 2:33 pm
It is called an interglacial. Remember? The Holocene is about 10,000 years old.
10,000 year Greenland Ice Core Graph
15,000 year Greenland Ice Core Graph
For the layman, E. M. Smith goes into the 1500 year cycles during the Holocene in detail in several articles accessed here. (Click on the titles for each article)
—————————————
Fair enough for the Holocene change10,000 years ago.
My main puzzling thought was that the 1500 year cycle which brings the temperatures up to interglacial levels briefly every 1500 years odd shows up well in the glacial period, but shows up much less clearly in the Holocene record.
I wonder what causes it. I cannot recall a 1500 year periodicity in any of Earth’s orbital parameters, or in the solar system’s dynamics. If it is a 1500 year cycle of solar activity, why does it warm glacial Earth by 5C and interglacial Earth by less than 1C?
BTW….Alarmosphere…I like it.
Why does the NSIDC graph bottom out at 2 million square kilometers? It should be 0.
Visually, the ice graph looks worse with the bottom y axis set to 2.
question says:
August 27, 2012 at 2:11 pm
Not really,
Including 2012 over the past decade average surface and troposphere global temperatures don’t show an increase.
http://www.woodfortrees.org/plot/uah/from:2002/plot/rss/from:2002/plot/hadcrut3gl/from:2002/plot/hadsst2gl/from:2002/plot/uah/from:2002/trend/plot/rss/from:2002/trend/plot/hadcrut3gl/from:2002/trend/plot/hadsst2gl/from:2002/trend/plot/gistemp/from:2002
This period included a few record low Arctic ice minimums, yet the majority overall show a decline in overall global temperatures.
Ocean temperatures during the same period using hadsst2 are decreasing both globally and in the NH and SH.
http://www.woodfortrees.org/plot/hadsst2gl/from:2002/plot/hadsst2nh/from:2002/plot/hadsst2sh/from:2002/plot/hadsst2gl/from:2002/trend/plot/hadsst2nh/from:2002/trend/plot/hadsst2sh/from:2002/trend
On the last point, internal modes are extremely important and can be mainly determined using ocean cycles and global albedo. It still stands with ingoing and outgoing radiation not changing; CO2 is not having any noticeable overall affect during this period. An internal energy change includes the oceans, so it has not been left out. The surface energy left over from an El Nino eventually moving towards the Arctic contributed towards the melting. Looking at DMI over recent years melting from below the ice would have to be the main factor. The AMO already mentioned on previous posts is also a significant candidate.
One word: pathetic.
Get over it, guys.
Please, let’s all move on to the real debate: what to do about this problem?
Only one and a half MILLION SQUARE MILES of sea ice left!
Do I look bothered?
Elizabeth says:
August 27, 2012 at 2:24 pm
All I can say there ain’t no global warming there hasn’t been any for 16 years check out AMSU satellite temps 600mb compare all years, So how in hell is global warming causing NH ice to melt.?…
_________________________________
I would agree with Vukcevic. The ice is melting from the bottom due to a warm AMO. The actual air temperatures are not really high enough for much melting. link The only other options are sublimation from a more energetic sun or a break-up of the ice by storms and then the ice being transported out of the pole areas to melt as happened in 2007.
No one bothers to tell the public that the summer sea ice is not like a frozen lake you can skate on in the winter. Instead it is ICEBERGS. They are looking at Ice where there is 15% or more icebergs. Note second line under the title in this graph
Arctic Sea ice extent 30% or greater (DMI) graph
This graph gives you an idea of how much of the arctic is solid ice and how much is actually icebergs floating in the sea. link and this satellite photo of August really brings it home link (this is sea ice thickness for the last winter link )
Note that NONE of the Arctic Sea Ice experts who posted here have bothered with this simple explanation. Instead we are lead to believe it is a solid sheet of ice that has been broken up by the storm because it was so thin.
And this comment:
The IMS sensor is able to supply sea ice charts for 2007 and 2012 on a like for like basis.
Is there similar 2007 maps as a suitable comparators for the other charts ?
Has there been any change in sensing techniques that might cause such a pronounced divergence ?
rogerknights says:
August 27, 2012 at 10:54 am
Anthony, we can also go back somewhat reliably until 1953, –Julienne
What’s holding back release of ice-extent-estimates based on the pre-1979 military satellites? (Along with sample photos of extremes from that range.)
Roger the data are available. NSIDC only has the ESMR-SMMR-SSMI-AMSR data, but Had1SST has the data back to before 1900. Anyone can access the data.
Robbie says:
“…you only come up with a bunch of newspaper articles as ‘proof’ for your own claims.”
Yes. Newspaper accounts and direct observations are what we have. And TonyB has posted extensive accounts of global warming and cooling going back to Greek times.
On the other hand, you have nothing in the way of scientific evidence to support your CO2=CAGW belief system.
I note that neither you, nor any other climate alarmist has posted any scientific evidence showing that human emitted CO2 is the cause of global warming. When your belief is based on ZERO testable evidence, doesn’t it make you wonder if you might be wrong?
Nah, probably not. Beliefs are comfortable things.
• • •
Entropic wins the 2012 Joel D. Shore Award for his non-stop complaints about charts I post. If it wasn’t the error bars, he would complain about something else.
[Background: A year or two ago Joel Shore complained about a chart I had posted, so I found fifty (50) more charts that showed the same thing, from about 40 different sources, and posted them. Joel Shore found fault with every one of them! Some folks just don’t like what the real world is telling them. So, Entropic, carry on…]
Its great that WUWT is still running the
Arctic Sea Ice Nearly Disappears September 22nd, 2012 – 26 days to go.
story – clearly designed to try and poke fun at a date specific prediction.
Lets hope the story stays up and is revamped for the next few years, because the spiral of decline in area, extent and volume towards zero looks set in.
The comments some have made in this thread that this arctic sea ice decline is “local” are ignorant of the fact that:
“Notably, it was the warmest July on record for the Northern Hemisphere, where the majority of Earth’s land mass is located. This is the fourth month in a row that the Northern Hemisphere has set a new monthly land temperature record”
http://www.ncdc.noaa.gov/sotc/global/
As I posted previously, if current trends continue we can expect to see the north pole become ice free before the whole arctic becomes ice free in late summer. The thickest ice remains along the Greenland and Ellesmere Island coasts.
Comparing with September 2007, then ice remained locked on to the islands on the Siberian side of the arctic, but this year there is open water there and currently there is a developing area of open water and weak ice penetrating towards the pole from the Siberian side.
http://arctic.atmos.uiuc.edu/cryosphere/deetest/deetmp.19546.png
Steven Mosher’s post was spot on – if it does go to zero, what will the “anything but warming” camp come up with to explain it ?
A “screaming arctic” is a bit over the top, but maybe a better analogy is an alarm sounding. Its sensible to check to see why an alarm is sounding rather than try to ignore it or dismiss it because of misplaced belief that “it cannot be for real”.
Entropic man says: @ August 27, 2012 at 1:07 pm
Timing of abrupt climate change: A precise clock
Many paleoclimatic data reveal a ∼1,500 year cyclicity of unknown origin….
____________________________
Gail Combs says: @ August 27, 2012 at 2:33 pm
It is called an interglacial. Remember? The Holocene is about 10,000 years old…..
—————————————
Entropic man says: @ August 27, 2012 at 3:04 pm
Fair enough for the Holocene change10,000 years ago.
My main puzzling thought was that the 1500 year cycle which brings the temperatures up to interglacial levels briefly every 1500 years odd shows up well in the glacial period, but shows up much less clearly in the Holocene record.
I wonder what causes it. I cannot recall a 1500 year periodicity in any of Earth’s orbital parameters, or in the solar system’s dynamics. If it is a 1500 year cycle of solar activity, why does it warm glacial Earth by 5C and interglacial Earth by less than 1C?
________________________________
I think you get the broad swing during the glacial and a much lesser swing during an interglacial because the earth’s feedback mechanisms put an upper limit on the high temperature.
The paper itself points to something completely outside of the earth as the “clock” Dr Nir J. Shaviv comments on The Milky Way Galaxy’s Spiral Arms and Ice-Age Epochs and the Cosmic Ray Connection So I would hazzard a SWAG that there is something in our galactic neighborhood that is effecting the earth’s climate on a 1470 year period. A comet maybe?
It is obvious we are still collecting all the factors that effect the earth’s climate. I do not thing saying X% is due to the sun or CO2 or H2O or Cosmic Rays or Geomagnetic variations can be done until we know all the factors first.
Smokey,
You have a very large bowl of cherries at your disposal, but that does not stop them being cherries. I have seen your 50 or more charts, and each one is a cherry pick: too long so as to mask the relevant effect, too short so as to hide it in a different way, too localised, inappropriate y-axis, or superimposed with a linear trend when a different trend would be a better fit. Cherries, evey one.
And regarding beliefs, it is you, Smokey, who ignores all scientific evidence in favour of newspaper articles and the like, simply because they appear to confirm your wishful-thinking-inspired beliefs.
John
Gail Combs says:
August 27, 2012 at 3:13 pm
…….
It is just plain common sense. Floating sea ice is 90% under surface, and 10% in the air, not to mention huge heat capacity of water in comparison to puny one of the atmosphere.
Has any ‘atmosphere ice melting scientist’ asked ‘why icebergs do turn over on regular basis?
Well, because it melts from underneath, becomes top heavy and then rolls over.
hey, ‘scientist’ did you notice below water line melt section.
Smokey says:
August 27, 2012 at 12:15 pm
Steven Mosher says:
“A real skeptic would shrug his shoulders and say… ‘Sure there is less ice, sure warmer temps plays a role, but we have no knowledge about why its warmer’.”
I think that is what most of us here are saying. The planet is still emerging from the Little Ice Age, but we don’t know all the reasons why, or why the LIA occurred in the first place. It was one of the coldest times of the entire Holocene. Why? We are not certain why.
The actual error is on the side of the climate alarmist crowd, which assumes that human activities are causing global warming. The fact that they have no scientific evidence to support their assumption seems to be irrelevant to them. Thus, their belief is no different than a belief in witch doctor juju. They cannot explain it, and they have no evidence for it. They simply believe it.
==========================================================
Dittos
Gail Combs says:
August 27, 2012 at 3:39 pm
I think you get the broad swing during the glacial and a much lesser swing during an interglacial because the earth’s feedback mechanisms put an upper limit on the high temperature.
The paper itself points to something completely outside of the earth as the “clock” Dr Nir J. Shaviv comments on The Milky Way Galaxy’s Spiral Arms and Ice-Age Epochs and the Cosmic Ray Connection So I would hazzard a SWAG that there is something in our galactic neighborhood that is effecting the earth’s climate on a 1470 year period. A comet maybe?
It is obvious we are still collecting all the factors that effect the earth’s climate. I do not thing saying X% is due to the sun or CO2 or H2O or Cosmic Rays or Geomagnetic variations can be done until we know all the factors first.
—————————
1) We are probably not at the top of the curve at present. The superwarming episodes observed during this and previous interglacials give us another degree or two of at least temporary warming. I would expect to see a stronger signal than we do.
2) We have a very good idea of what’s around us for a number of light years. Anything likely to affect us from outside the solar system should have been noticed. A long period comet would have left a detectable debris trail around its orbit, and anything much heavier in the solar system would have shown its orbital influence. I know that “absence of evidence is not evidence of absence”, but that’s usually the way to bet.
3) We probably have all the major climate drivers spotted. They are the ones showing detectable influence on the short or long term record. There may be others, like your 1500 year peridicity, but if they are influencing our current climate they would show in the energy budget as unexplained peaks or gaps in insolation, back radiation or the emission spectrum.
There is a story of the Stealth fighter development. A model of the aircraft was mounted on a plinth and illuminated with a radar. The engineers saw no return signal, making the aircraft effectively invisible. One engineer said “its gone”. HIs young son pointed out the window and said
” No it hasnt, I can see it.”
Your hypothetical unknown variables would leave a signal somewhere. That they do not suggests that they are absent, insignificant or at best intermittent.
Some European says:
August 27, 2012 at 3:10 pm
One word: pathetic.
Get over it, guys.
Please, let’s all move on to the real debate: what to do about this problem?
________________________
Drop all the politicians who are after our wealth in the Arctic sea to feed the Poley Bears?
Oh, and since when is warmer a problem? History tells us it is COLD weather that causes civilizations to colapse. Of Time and Temperatures
The Greenland ice core graph shows a slow descent during the Holocene into the next big ice age.
NASA Scientists Predicted a New Ice Age in 1971 Dr. S. I. Rasool came to his chilling conclusions by resorting in part to a new computer program developed by Mr. Hansen that studied clouds above Venus.
This was the same time period that the Milankovitch cycle theory was being investigated.
A refinement of this work (actually a clearification of info that was lost) is discussed in this article with links to the paper: In defense of Milankovitch by Gerard Roe
A discussion about the end of the Holocene by a a California Licensed Professional Geologist and former Certified Environmental Auditor (and former global warming proponent) with links to several papers is here.
The return to Ice Age conditions is a given and that should be the biggest concern. Killing off our civilization under those conditions at the tail end of the Holecene is sheer idiocy.
RACookPE1978 says:
August 27, 2012 at 1:54 pm
“What is the final link to that composite graph of the DMI data?”
http://ocean.dmi.dk/arctic/meant80n.uk.php
David A. Evans says:
August 27, 2012 at 10:24 am
JohnB says:
August 27, 2012 at 9:56 am
REPLY: Thanks Walt, have you ever considered we may be at/near the bottom of a natural cycle? How can you rule that out without data much beyond 30 years? There’s historical anecdotal evidence of very low Arctic sea ice in the past where you have no data. – Anthony
——————-
Anthony, what evidence would that be?
How’s this?
Within 5° of the pole & no ice, that’s 300nm.
Only if the Russians could walk on water! Read the article, they were drifting in the ice not open water. (like the Fram)
vukcevic says: @ August 27, 2012 at 3:54 pm
Gail Combs says: @ August 27, 2012 at 3:13 pm
…….
It is just plain common sense. Floating sea ice is 90% under surface, and 10% in the air, not to mention huge heat capacity of water in comparison to puny one of the atmosphere….
________________________________
Another one of those inconvenient little facts that are never mentioned especially in the press.
Your graph of the AMO and the NAO (delayed X years) shows the warming/cooling cycle of the Atlantic Ocean bottoming out in the early 1970’s and topping off in the last few years. The peak look like it is around 2005 – 2007.
So there is a perfectly logical explanation for the sea ice melt being greater now than in the 1970’s.
Graph 1 and Graph 2 and Graph 3
Gail Combs says:
August 27, 2012 at 4:16 pm
The return to Ice Age conditions is a given and that should be the biggest concern. Killing off our civilization under those conditions at the tail end of the Holecene is sheer idiocy.
———————-
We WERE due to go back into a glacial period. Up until 1880 we were cooling at 0.6C per millenium, barring the odd Maunder Minimum.Then we started warming at better than 0.6C per century, for reasons we’ll probably be arguing about indefinately.
The planet will warm or cool and not notice. As a civilization living mostly on coastal plains we will end up with one of four outcomes.
1) We try to mitigate climate change, reducing its effect when it comes.
2) We try to mitigate climate change and it does not come. We look silly.
3) We do nothing about climate change and it comes. We get hammered.
4) We do nothing about climate change and it does not come. We win.
I feel a bit like Pascal. To summarise Pascal’s Wager:-
God may exist ,or he may not.
I may believe in him or I may not.
If I believe in him and he exists, I go to Heaven.
If I believe in him and he does not exist I have lost nothing.
If I do not believe in him and he does not exist I have lost nothing.
If I do not believe in him and he exists, I go to Hell.
I will therefore believe in him to minimise my risk.
I am inclined to accept climate change to minimise my risk.
I thought the Arctic ice was increasing:
Except of course when there’s no trend:
Happily, the resolution to these conflicting ideas comes from the same source:
JohnB says:
“And regarding beliefs, it is you, Smokey, who ignores all scientific evidence in favour of newspaper articles and the like, simply because they appear to confirm your wishful-thinking-inspired beliefs.”
•
JohnB, may I once again point out the plain fact that there is no scientific evidence showing that human CO2 emissions cause global warming. None. Not even a little bit of evidence. It is all just your baseless belief.
But there is scientific evidence showing that changes in CO2 follow changes in temperature. On all time scales, from years to hundreds of millennia. Faced with solid scientific evidence, and having zero scientific evidence to support your belief, you give the typical alarmist response.
•
Kevin MacDonald,
You make no sense. But it sends a tingle up my leg to see that you’re saving my comments from years past.
Let me point out that what I wrote in 2010 was valid for 2010. The fact that conditions have changed does not seem to have occurred to you. So let me end with a quote from Leon Trotsky:
Everyone has the right to be stupid, but comrade MacDonald abuses the privilege. ☺
Gail Combs said
“The return to Ice Age conditions is a given and that should be the biggest concern. Killing off our civilization under those conditions at the tail end of the Holecene is sheer idiocy.”
Well yes it is of course a concern, but not our biggest concern. The timescales are completely different. The next major glaciation is not due for thousands of years – Houghton says 50,000 years.
The affects of human induced climate change on the other hand are being felt now and will impact fully on scales of hundreds of years.
And who said anything about “killing off our civilization” ?
A few hundred years back the height of transport and industrial technology was steam power. We are currently at the start of the next industrial revolution which will, over decades, deliver most of our power from renewable resources.
The “biggest concern” is how much more carbon we put into the atmosphere before we start to seriously switch to renewables and high efficiency.
kramer says:
August 27, 2012 at 3:08 pm
Why does the NSIDC graph bottom out at 2 million square kilometers? It should be 0.
Visually, the ice graph looks worse with the bottom y axis set to 2.
Try this one:
http://ocean.dmi.dk/arctic/meant80n.uk.php
Why does the y-value start at 235 K and not Zero?
There are two sorts of answers:
One is that the programs doing the drawing use automatic scaling:
http://asymptote.sourceforge.net/doc/graph.html#automatic%20scaling
Two is that the designers of the graph never expect it to get as low as that beginning number. In the ice graph case they apparently do expect it to go to zero. Thus, answer #1 it is.
If the ice loss was due to the storms at the pole then the refreeze should quickly restore it. But here is a question I have – the drum beat from the alarmists is the ice loss represents loss of albedo which is seen as a positive feed back. But if you look at the polar cloud cover the albedo problem appears to be a red herring. Part II of that is that if the sea is exposed to the sky as is one would think with such low levels of ice, the polar ocean is losing heat through radiation at epic levels. That is a cooling event, not a warming event at this time of year.
Entropic man says:
August 27, 2012 at 4:14 pm
…..Your hypothetical unknown variables would leave a signal somewhere. That they do not suggests that they are absent, insignificant or at best intermittent.
________________________________________
First during the last 450 kyr BP, the temp swing has been ~ 10C Graph That includes 5 interglacials with peaks about +/- 1C of each other.
Scientists have already said they have no idea what is causing the 1,470 yr cycle Dansgaard-Oeschger events. In the paper I linked to the scientists think it is caused by outside influence. In this paper, Were Dansgaard-Oeschger events forced by the Sun? Braun and Kurths suggest
This paper: Controls on the tropospheric oxidizing capacity during an idealized Dansgaard-Oeschger event, and their implications for the rapid rises in atmospheric methane during the last glacial period looks at CH4.
And The Azimuth Project
So there is a known cycle that is quite prominent in the Greenland ice cores and in the history of the rise and fall of various civilizations and no one agrees on what the devil is causing it. (In some cases it is not temperature but precipitation that changes. E. M. Smith elaborates on the D/O Bond events in this WUWT comment )
You may also recall the infamous quote from Kevin Trenberth.
“The fact is that we can’t account for the lack of warming at the moment and it is a travesty that we can’t,”.
When a scientist declares everything is known about a subject, then you know he is lying.
Steven Mosher says:
August 27, 2012 at 11:41 am
=============
Ask any pilot, gremlins are real.
Entropic man says:
August 27, 2012 at 5:06 pm
“I am inclined to accept climate change to minimise my risk.”
Except that you are asking the rest of us to finance your acceptance.
“1) We try to mitigate climate change, reducing its effect when it comes.
2) We try to mitigate climate change and it does not come. We look silly.
3) We do nothing about climate change and it comes. We get hammered.
4) We do nothing about climate change and it does not come. We win.”
How silly. We all know the climate will change, so #2 and #4 are wrong. Your assumption that climate change (whichever direction) will always be harmful is unfounded, so #1 and #3 are also wrong. In addition, your assumption that whatever humans do will be beneficial just demonstrates that you are filled with self importance. But alas, all dictators are that.
Blast. This is really annoying, because:
A.) A couple of my pet theories got trashed this summer. But at least I can admit I was wrong.
B.) The Global Warming fraud will be able to limp on a bit longer before paying the piper, called Truth. The aging fools most responcible for this fraud might even be able to milk a final trip to Bali from the delay. Meanwhile the honest scientists, who have stood up for Truth and taken some lumps, are likely to take a few more lumps, rather than gaining the praise and rewards they truly deserve.
I’d like to note a few minor details:
1.) Rather than tilting and sinking, the “North Pole Camera” shows meltwater pools starting to freeze over.
2.) If you look at the map at http://nsidc.org/data/seaice_index/images/daily_images/N_bm_extent_hires.pngt
you will notice Siberian bays that are usually ice free still have some ice, even this late in the summer.
3.) Entering winter with this much open water will allow far more heat to be lost to the polar night (and outer space) than would be lost if the arctic ocean was sheltered by ice. Think of an igloo. If you wanted to stay warm, whould you lie in the igloo, sheltered by ice, or lie out in the open?
I would like to sit back and wonder and marvel and study the weather patterns that having so much open water are like to show us. It really spoils my enjoyment when the beauty of nature is dirtied by the grunge of politics.
James Abbott says:
August 27, 2012 at 5:18 pm
Others say not. There is a lot of links at this discussion of The End Holocene, or How to Make Out Like a ‘Madoff’ Climate Change Insurer
you get this
Sure sounds like the scientist really do not know. Also there has been the recent update to the Milanchovitch cycles and now the match is excellent, link therefore an abrupt end of the Holocene can not be ruled out.
Sorry but that is absolute Bull Feces. The current temps and climate are neither unusual or nasty. There is a good reason it is called the Modern Optimum and that is because the climate is very nice right now.
The goal is an ~85% reduction in CO2 (not carbon) The EU’s road map reflects the stated goal by European governments to reduce emissions by 85-90 percent by 2050, compared to 1990 levels. I ran through that analysis a while ago see comment It will put us back to the level of civilization in the early 1800’s. Wind, biofuel and solar are not energy dense enough to sustain anything close to our current civilization it is just that simple. It is also the reason for shifting from wind and biofuel to coal in the first place. China India and Russia of course will do very well since Australia and the USA will be shipping them our coal and The World Bank will be providing the funding for the building of all the new coal plants.
So you are correct only the free western civilization will be killed off. The areas where individual human rights are trod on with combat boots will be allowed to prosper.
The corporations and bankers really do want a captive work force and if you read between the lines that is what “sustainability” is all about. Shove everyone in cities composed of tiny dormitory style housing. Restrict travel to bikes and walking. Ban any and all farming, gardening and small independent businesses.
When ever the corporate owned media and politicians are pushing hard for something better dig to find out how benefits because it certainly is not going to be the little guy.
My favoured explanation for the D-O events is ocean cycles based on the thermohaline circulation (1000 to 1500 years long) drifting in and out of phase with solar variations (1000 years for a full cycle).
When in phase they combine to give severe climate swings such as observed during glaciations, when out of phase they tend to offset one another for smaller climate variability such as seen during interglacials.
In fact I suspect that they would have an influence on the timing of the shifts into and out of glaciations whilst the Milankovitch cycles operate in the background.
Severe downward swings would tend to give rapid ice build up on the northern continents that would not all melt in the next upswing.
Small downward swings giving less ice build up which more easily melted in the next upswing.
The ratio between glaciations and interglacials being about 9 to 1, I suspect that the current northrern hemisphere landmass distribution allows fast enough ice build up during downswings to keep us in glaciations for 90% of the time.
“Everyone has the right to be stupid, but comrade MacDonald abuses the privilege. ☺”
History has shown that Leon Trotsky was the stupid one. Comrade MacDonald is still doing just fine.
Well I’m pretty sure you didn’t answer any of the questions. Here, I’ll just repost them all back to back with all other commentary stripped:
Julienne, Are you saying we’re supposed to still be in the same climate that we had in the 1960’s and 1970’s? … Are we supposed to be in that climate again? … Did man alter that pristine cooler 1970’s climate forcing our moderately warmer current climate? … Do you believe that humans have brought an abrupt stop the natural cool and warm and cool and warm cycles locking us into a permanent warming? … Have we ruined the chances for another Little Ice Age? … Where were you 4 months ago when extent hit the long term average (and probably exceeded it but for a suspicious satellite problem once again)? … Did the CO2 concentration drop 4 months ago and suddenly return to normal at the solstice? … Do you in fact believe that this past July was the hottest in all history? … Do you in fact believe that CO2 is behind the melting of Arctic sea-ice (but somehow ignores every place else!)? … Both these things (the so-called melting in the Arctic is the same water that freezes and thaws annually, and also that nothing about sea-ice affects sea-level.) get confused in the general publics’ mind, and I suspect that Serreze is just fine with that. Are you?
After re-reading your ‘answers’ it occurs to me that it all supports my inference that you and your fellow AGW believers specifically worship two separate hockey sticks. It can all be concisely explained …
(1) The Mannmade stick with a straightened handle (wiping out the MWP,LIA and other variations) and an upturned blade (for human caused thermal runaway) to scare the bejeezus out of everyone.
(2) A northern hemisphere summer sea-ice minimum extent hockey stick with a straightened handle (equalizing all extent from the 1970’s backwards to 1900 according to you) and a downturned blade (for Serreze’s death spiral) of summer extent.
These two concepts illustrate the entire body of evidence from the AGW hoaxsters. It also identifies just how flimsy this house of cards really is. If either stick is considered as a handle + blade, then either or both hockey stick is falsifiable by locating errors in their handle *or* blade which irrefutably transforms the hockey stick into something completely the opposite.
I’ll cut to the chase now, neither of these hockey sticks will be around much longer. It was a fool’s errand to try to elminate the MWP and LIA, and now many people are unearthing and compiling supporting documentation. The blade portion for temperature is also crushed by many people like McIntyre, not to mention the common sense of expected post-LIA moderate warming (Duh, what should it be doing?).
The other stick is even more fragile because the handle is anything but straight and the effort to use the 1970’s as a starting point for icy death spirals, and then further compound this as being representative back to 1900 defies all reason. Historical newspaper accounts show the thing changing all the time, and each time there is a bunch of hoaxsters making grand pronouncements of impending disaster. The downturned blade portion will be fixed all by itself within a couple of years as mother nature works her magic and frustrated alarmists like Romm, Serreze, and now Mosher are heard babbling and stuttering excuses for anyone still listening.
The only thing that real scientists and skeptics need to do is keep a close eye on the foxes guarding the chicken coops full of sea-ice and other data, making sure Hansen style corruption cannot occur, and that apples are no longer compared to oranges.
Several people here assert that the Arctic Sea Ice extent is linear.
Unfortunately, a linear fit of Sept min sea ice extent, even over the limited satellite record (33 years) has to be discarded as a viable hypothesis of Arctic Sea ice decline, since it leads to a completely unrealistic 5 million km^2.
Even the WUWT ARCUS poll was well below that number, so apparently WUWT voters do not believe in a linear decline either.
The best fit over the satellite record is the Gompertz fit :
http://neven1.typepad.com/blog/2011/04/trends-in-arctic-sea-ice-extent.html
and
http://rankexploits.com/musings/2011/connelly-dekker-bet-actually-robs-got-a-very-good-chance-of-not-losing/
Gompertz fit is attractive since it matches the satellite record better than linear and quadratic and other trends, but also because it matches the “soft” landing that results from running simulations in GCMs :
http://www.realclimate.org/images/seaice10.jpg
Besides that, the onset of a Gompertz curve is exponential (and thus quadratic in the second factor), which matches with what one would expect for a system response with amplifying “positive feedbacks” (such as albedo feedback) in the Arctic climate system, as is also shown in the GCM results.
The only difference with GCM runs at this point is the timeframe on which they pan out : reality shows a much faster decline than climate models (although I understand that Dr. Stroeve’s new paper presents improved results there).
Still, using Gompertz fit, NSIDC Sept minimum extent in 2012 should be around 4.3 million km^2 :
http://neven1.typepad.com/blog/2012/06/naive-predictions-of-2012-sea-ice.html
Since the minimum this year will likely be shattering the 2007 record, and likely end up below 3.8, even the non-linear Gompertz fit seems overly optimistic at this point.
Needless to say that claims here of a ‘linear’ decline during the satellite record (or even a linear decline since the LIA as some suggest) leads to unrealistic numbers and thus is refuted by simple statistical analysis of observations over the past 33 years.
Hi Anthony,
I can understand why sea ice extent is impacted by the vagaries of weather (e.g., wind shifts, the presence of blocking highs etc.) and proximity to deep oceanic basins and continental land masses, but the current and sudden melt-back of the Arctic ice sheet seems somewhat odd, given that:
(1) Arctic sea ice extent and area during the 2011-12 winter season approached the mean for the period 1976 and 2006;
(2) The ocean temperatures across the entire Arctic Ocean and, in particularly, the Beaufort and Chukchi Seas, have been unremarkable throughout 2012;
(3) The ice sheet to the north of Nunavut (Canada) has remained relatively thick and intact. and
(4) The rate of melt-back in the Beaufort and Chukchi Seas has seemingly accelerated over the past month.
Prior to the start of May, things were proceeding along ‘normally’. The Siberian side of the Arctic (a region with an extensive land mass and relatively shallow and wide continental shelf) became free of ice well before the Northwest Passage started to open up – as it always does. However, at the start of May the Northern Hemisphere Jet stream started to fragment and has remained in this condition throughout the subsequent summer season.
Several questions for your climate and meteorological boffins:
(a) Why does the earth appear to be entering a cooling phase, with cooling greatest in the tropics (have a look at temperatures in Northern Australia, SE Asia, Hawaiian Islands etc.) followed by the mid-latitudes (e.g., southern Australia, southeast USA, South Africa), yet the Arctic region of the earth are experiencing well above-average temperatures?
(b) Given the above observations, why have the Beaufort and Chukchi Seas been stripped of their sea ice so quickly this year, yet the ice pack above Nunavut (which has thickened dramatically in the last couple of years) is experiencing little, if any, melt-back?
(c) What is disrupting the Jet Stream? Is this a cyclical (perhaps annual) event?
(d) What on earth is going on in Alaska and Northern Canada to account for the differences in summertime melt-back rate of the Arctic ice sheet?
It’s almost as though the earth is cooling from the equator (actually plane of the ecliptic). Could this be a further vindication of Svensmark’s hypothesis (e.g., an proportionately greater increase in low level cloud cover in the tropics than in higher latitudes)?
Regards,
Greg B.
It appears that my website is experiencing some difficulties, no idea why (?!).
My apology to anyone who could not access quoted links.
No, you’re confused, as I demonstrated in my previous post, it is you that makes no sense.
Even if we were to accept that you’re conflicting claims that Arctic sea ice was increasing in 2010 and that there was no Arctic Sea trend in 2010 were both valid and not the arrant nonsense it patently is, your defence is precluded by your own words:
You attribute the 2012 Arctic sea ice loss to an ongoing, but unspecified and unevidenced, warming trend that started at the end of the LIA. Unless you contend the LIA ended in 2011 conditions have not changed.
This must be your favourite goto ad hom when called on a particularly specious piece of reasoning:
You apologised for resorting to ad hom on that occasion, but it appears your apologies are as worthless as your predictions.
vukcevic says:
August 27, 2012 at 1:43 pm
Entropic man says:
August 27, 2012 at 1:07 pm
…..
No mystery, temperature changes in the seas north of Greenland – Scotland ridge is not determined by short summer irradiation or CO2, but by the warm currents inflow. In the open seas warm inflow raises air temperature and in the iced area melts ice from below.
Temperature of the inflow is determined by the AMO (N.Atlantic SST) which happens to be at the multi-decadal peak , and may stay at high values for up to another decade (has 9 year short cycle) but it is expected than to fall back due to medium term 64-5 year cycle. Is there a longer centuries long cycle, it is not known.
————————-
Blaming the whole melting on the AMO is a useful hypothesis in the short term, but would require previous warming /cooling cycles to appear on the same timetable. The previous AMO peak would be in the 1950’s and the record should show low ice in the 1950s. Unfortunately the record shows sustained large extents.
http://nsidc.org/icelights/files/2010/11/mean_anomaly_1953-2010.png
Based on data from icebreaker observations to PIOMAS models, scientists have been reporting for years that the quality and volume of Arctic ice are declining faster than area or extent, so the latter measures understate the downward trend of arctic sea ice. WUWT writers and readers regularly dismissed or ridiculed such statements (PIOMAS is “only a model”; Barber’s description of “rotten” ice was absurd). But if this August storm so strongly affected the ice area, that gives yet another confirmation that PIOMAS, Barber and most arctic scientists were right all along, while WUWT was wrong. Arctic ice has been weakening faster than even the exponential decline in area suggested.
Entropic man says: August 28, 2012 at 3:48 am
Blaming the whole melting on the AMO is a useful hypothesis in the short term, but would require previous warming /cooling cycles to appear on the same timetable.
Hey slow down, this is not melt of one year ice only, there is also multidecadal factor.
For the 1950’s melt (lower layers) were built up in previous decades since 1920s which were colder than 1970s from which some of the present ice may date.
N. Atlantic SST on average was 0.2C higher in 1970s than in 1920s, and same is now SST in 2010s is 0.2C higher than in 1950s. We know about 9 year and very probable 64-65 year cycle, but it is not known if there is some longer term natural oscillation.
In next 30+ years we could expect the SST to drop by about 0.5C to bring it to 0.2C above 1970’s level, and then again in following 30+ years i.e. around 2075 to be a 0.2C above present values.
If you are concerned about future you should be more concerned about prospect of 0.5C fall in the next 2-3 decades, than a rise by 0.2C in 65 years time. The AGW believers recognize the existence of the AMO cycle, but to their peril they ignore its consequences.
What happens when ice over underlying warmer water get broken up by a strong storm and is transformed into ice slush?
It cools down the temperature of the water. Heat content doesn’t increase.
http://pulverizedtonearpower.wordpress.com/2012/07/12/pulverized-to-near-power/
Gneiss says:
August 28, 2012 at 4:49 am
The problem is, the leap to “Co2 and fossil fuels are the cause” happens to be over a shark.
Entropic man, your analogy statement re: belief in God is not appropriate in this debate and earns you no marks for the effort. You could restate the series of sentences with “snake oil” instead of God and “not get healed”. Read that way you get my meaning of why the belief in God statement does not fit the current debate in any way that would earn marks.
Building backyard underground nuclear shelter fortresses popular in the 40’s and 50’s would make a good analogy. And we all know how that turned out. The vast majority of folks did not build shelters but the government had nuclear signs all over the place and had school children hiding under their desks during drills designed to simulate a nuclear bomb emergency. Wonder why they did all that now that we know the real risk of such an attack was knowingly way over-stated by said government.
What happened to my post? It may be in the junk bin because of my mention of nuclear emergencies.
David Ball writes:
“The problem is, the leap to “Co2 and fossil fuels are the cause” happens to be over a shark.”
For as long as I’ve watched WUWT, people here have been confidently predicting global cooling, or arctic ice recovery, warning sternly about cycles and the danger of a coming ice age.
Most scientists have been predicting further greenhouse-induced warming, led by arctic amplification.
Warming has continued, led by arctic amplification. Who jumped the shark?
Gneiss:
For as long as I’ve watched
WUWTRealClimate and its clones, people there have been confidently predicting catastrophic runaway global warming, or complete arctic ice disappearance, warning sternly about the danger ofa coming ice agehuman-caused thermageddon. [There. Fixed it for you.]The difference is that WUWT allows all points of view, while the alarmist blogs censor the views of scientific skeptics. Thus, they are feeding their echo chamber readers false alarmist propaganda. But as readers here know, ALL the scientific evidence supports the skeptical position. NONE of the scientific evidence supports your false climate alarm. Only your discredited belief system keeps you going. That is not science, that is mindless partisan advocacy. You’re good at it. But it is about as scientific as Scientology.
Gneiss says:
August 28, 2012 at 10:27 am
………
Not necessarily, I wouldn’t be surprised if there is another AMO mini-cycle of 9-10 years of warm water inflow into the Arctic ocean, which could mean even lower Arctic summer ice coverage (since the old ice is now melting too), after that the AMO will be on its way down, and the new ice will increase rapidly.
Humanity would more benefit from less summer ice in the Arctic than from a permanently frozen one.
Smokey writes:
“The difference is that WUWT allows all points of view, while the alarmist blogs censor the views of scientific skeptics.”
Untrue, I and many others have been censored on WUWT, as you well know.
But a real difference between WUWT and the science blogs is that so far as I know, only on WUWT is a moderator’s sock puppet one of the highest-volume posters.
Gneiss,
Quit misrepresenting. You’re not very believable as it is.
There is a big difference between having your comment snipped or deleted for violating site Policy, and the outright censorship that RealClimate, ClosedMind, tamina, and similar blogs practice. The reason that WUWT leaves them in the dust is exactly because WUWT does not censor contrary points of view. As we see in your comments here.
Of course the Arctic sea ice is going to recover. That’s why all the major oil companies are investing billions of dollars in prospecting for oil and gas in the arctic ocean.
Please pull you head out of the sand…
Entropic man says:
August 28, 2012 at 11:41 am
The record shows there was no 1950s melt.
Do you have records going back to 1920s, or are you saying that prior to 1950 the Arctic ice was always constant regardless of the SST?
If so, than your reasoning does not make much sense. Even the ‘hockey stick’ Mann recognizes fact that 1920s SST was 0.5 -0.6C lower than in 1945
http://www.vukcevic.talktalk.net/AMO-recon.htm
noticeable higher than my own reconstruction would have it, but then he went ‘nuts’ with his reconstruction in the late 1980s.
I wander how the Lord will spin this in his presentations. It has been in the past “arctic ice extent is just fine: steady for a decade”, perhaps it will change to “Arctic ice is just fine, returning to its normal 73.2 year cycle level”.
@ Smokey
I have been reading your posts on this thread to also other people. You are constantly talking about science and the scientific method:
“But as readers here know, ALL the scientific evidence supports the skeptical position.”
Tell me where are your scientific sources when people ask you to proof your claims. You haven’t been able to show us one shred of scientific evidence for your claims so far. And the “proof” you give us contradicts your claims as I have clearly shown you.
Once again: What does Astrid Lyså think which forces could be responsible for the current trend in the Arctic Ocean? Please show us the scientific evidence that the current trend is entirely natural and that Lyså has it all wrong?
Robbie,
I guess I will have to hand-hold you. Here is solid, empirical evidence showing conclusively that changes in CO2 follow temperature changes. That chart is much more than a “shred” of evidence; it deconstructs the entire CAGW myth. Effect cannot precede cause, therefore that chart is scientific data-based evidence proving that rises in CO2 are the net result of warming, not the cause. And that same cause and effect is seen on all time scales, out to hundreds of millennia.
You can reject all such real world evidence. But if you do that means you are operating on belief, not on science.
Finally, neither I nor most scientific skeptics are claiming to know all the causes of Arctic ice fluctuations. You simply have it backward: it is the alarmist crowd that is claiming that human-emitted CO2 is the cause of Arctic ice declines. Since that is your conjecture, prove it. Or admit you don’t know the reasons, either.
Smokey writes:
“I guess I will have to hand-hold you. Here is solid, empirical evidence showing conclusively that changes in CO2 follow temperature changes. That chart is much more than a “shred” of evidence; it deconstructs the entire CAGW myth.”
Smokey, the reason you are not a “scientific skeptic,” and your condescending polemical style gets no respect at more science-aware sites, is that you have no knowledge of or interest in the actual scientific research, which does not consist of waving internet graphs and blog talking points.
The feedbacks between temperature and CO2 suggested by paleo data, including those antarctic ice cores, have been analyzed and discussed by scientists in many research papers. If you knew that you would also know that scientists have not rejected the antarctic data, and its findings in no way challenge the evidence for modern greenhouse-driven change.
Very briefly: other things beside greenhouse gases affect the climate. Volcanic, solar, orbital and geographic factors can be important as well, which all scientists know. Those factors cannot account for the rapid modern change, but certainly played roles in past change (such as ice ages). Once climate starts warming for any reason, greenhouse gas release (from ocean degassing, permafrost thaw, for example) tends to kick in as a positive feedback, so there is more warming than orbital etc. factors could produce alone. In some paleo episodes, massive greenhouse release apparently was the kickoff factor; in other instances it simply followed and extended warming that initially began for other reasons.
Steven Mosher said
You will know your are struggling with that fact if you.
1. start to question every metric you’ve relied on in the past.
2. change the topic to the south pole.
3. Blame things that cant melt ice ( like wind). heat melts ice.
4. search around feverishly for one chart that supports your position.
5. Forget your own mistakes and focus on others.
A real skeptic would shrug his shoulders and say.. “Sure there is less ice, sure warmer temps plays a role, but we have no knowledge about why its warmer” That’s at least a defensible position. No knowledge is a standard skeptical position. But if you find yourself twisting and turning to reject the fact that there is less ice, well then..you might want to consider.. what would you say if there was zero ice. You better think about that argument because you’ll have to make it in the not too distant future.
————————–
The strange thing is that i have also said for the past few years that there is less ice and also I don’t know what causes it, possibly man made CO2 helps, and yet, although i am just interested in ice melt, because i post that people claim I am an AGW activist and then put spin on my words.
I have a liking for scientists. I think they do a good job, I find it great with the web and them posting on web sites lots of charts and posting on blogs, so when I defend them on allowing me to partake in a little hobby then once again I am an AGW alarmist.
I really resent that.
Andy
Gneiss says:
“…there is more warming than orbital etc. factors could produce alone.”
Absolutely, provably false. And cherrypickig “orbital factors” is a typical strawman fallacy: I never wrote about orbital factors. But you set that strawman up and knocked him right down, you brave strawman killer.
The natural warming observed today is very mild by Holocene standards. The planet has warmed – and cooled – <imuch more in the past, when CO2 levels were much lower. Thus, CO2 is not the cause. I have posted scientific evidence showing conclusively that changes in CO2 always follow changes in temperature, while you have only posted your personal beliefs.
And I liked your “kickoff factor”. Where’d you get that, from a comic book? The fact is that nothing observed today is any different from past observations. Therefore the reasonable explanation is the null hypothesis: what is happening today is what has happened in the past. Your true belief in “carbon” as a cause is just that: a belief. It has no credible scientific evidence to support it. But beliefs do not need evidence. The belief is fully sufficient in itself.
Finally, you do not even understand what a scientific skeptic is, therefore you have no authority to label anyone else. Skeptics simply say: “Prove it.” Or at least provide solid, verifiable and testable scientific evidence showing that human produced CO2 causes global warming. Your abject failure in that regard is evident in the lack of scientific evidence supporting your beliefs. But as I pointed out, beliefs do not require evidence.
“ALL the scientific evidence supports the skeptical position. NONE of the scientific evidence supports your false climate alarm.”
Really? Out of all the thousands of paper’s that have been published on the subject, not a single one contradicts your position? Such blind certainty must be comforting.
Let’s ignore the obvious non sequitur (just because increasing temperatures cause CO² levels to rise, it does not follow that Increasing CO² levels cannot cause temperatures to rise – a thing can be both a forcing and a feedback – you might as well argue that because eggs are a product of chickens, chickens cannot be a product of eggs) and ask a question:
IF, as you contend, rising CO² levels are a product of increasing temperatures AND, as you also contend, there has been no warming for 15 years, THEN, bearing in mind your “solid, empirical evidence” does not show any 15 year lags, HOW do you explain CO² levels rising for the last 15 years?
Black carbon linked to half of Arctic warming
Oh, soot!
New Earth-Moving UN Study Says Half Of Arctic Warming Caused By Soot (And Not CO2)!
Impure as the Driven Snow
*sigh*
Such moaning about the melting ice cubes. Such whining about Smokey and others being unscientific and ignoring the literature for not admitting the Arctic sea ice loss is due to greenhouse gases, as in CO₂ (with its positive feedbacks).
So many moaners and whiners who won’t accept or even recognize the literature showing the importance of soot in the Arctic sea ice losses. If there is a “tipping point” causing increased losses, soot is it, pushing the Arctic off of what would otherwise be the natural cycles.
Except soot is largely only a temporary problem, that’ll mostly go away when Russia and Asia clean up their emissions from fuel burning, leading to much more favorable conditions for sea ice accumulation.
But the narrative is human GHG emissions are to blame, namely CO₂, and costly alterations to society, losses to freedom, and massive wealth transfers are immediately required to save the entire planet.
So the moaners and whiners will come here, ignore the scientific literature laying the blame on soot, and claim we are the ones rejecting the science.
Oh well. Guess I’ll just write it off as a tribute to the popularity of this site that they consider it worthwhile to come here to attempt to proselytize the heathens into the CAGW faith. Hooray for us.
John Haythorn,
Papers are not scientific evidence. “Evidence” is raw data, and empirical records such as the Vostok ice core record or the CET temperature record. Evidence must be testable, per the scientific method. People often confuse peer reviewed papers for evidence. They are not. And comments purporting to claim there is evidence are nothing but opinions.
Kevin Macdonald says:
“Let’s ignore the obvious non sequitur (just because increasing temperatures cause CO² levels to rise, it does not follow that Increasing CO² levels cannot cause temperatures to rise.”
Grashopper, listen and learn: there are many sources of CO2. Some produce more CO2 than others, and at different times. Due to the various sources, CO2 is emitted more, or less, at any specific time. Thermohaline circulation is one example of a CO2 source that is responding to the temperatures of 800 – 1000 years ago. That was during the global warming episode known as the Medieval Warming Period.
And as I have regularly pointed out, net CO2 emisssions follow temperature changes, on all time scales out to hundreds of millennia. There is irrefutable scientific evidence verifying that fact. But there is no scientific evidence showing that CO2 leads temperature or that human CO2 emissions cause measurable global warming.
Conclusion:global warming causes rising CO2. Not vice-versa.
David A. Evans says:
August 27, 2012 at 10:24 am
JohnB says:
August 27, 2012 at 9:56 am
REPLY: Thanks Walt, have you ever considered we may be at/near the bottom of a natural cycle? How can you rule that out without data much beyond 30 years? There’s historical anecdotal evidence of very low Arctic sea ice in the past where you have no data. – Anthony
——————-
Anthony, what evidence would that be?
How’s this?
Within 5° of the pole & no ice, that’s 300nm.
As I recall Syedoff was frozen in on Dec 18th & free again by Valentines day 1939.
_______________
I believe that your interpretation of this article is deficient. What is being discussed is an in-ice-pack drift, not a free water drift. This is even implied in the article:
Note that the article is also deficient in a number of other areas. One easy to check area is the section that claims:
A relatively simple googling of “spitzbergen cod” led quickly to the bookNorwegian Spring-Spawning Herring & Northeast Arctic Cod: 100 Years of Research and Management, which notes:
Clearly, if the fishery off Spitzbergen in 1878 was well enough known that scientists were examining the fish (to determine spawning locations), then they are not new to the area in the 1938 timeframe of the news article. Another point is the correlation between Cod Liver Oil and Norway’s ownership of Spitzbergen after WW1 – See this newspaper article from the Milwaukee Sentinel, Dec. 14th, 1926 for more information. This is not proof positive, but does imply the link between Spitzbergen and cod.
Likewise, the discussion of Cod off Spitzbergen as found in “The Zoologist: A Monthly Joournal of Natural History”, Third Series, Vol. VI, pg 417 (published in1882) also shows that cod were known to be present much earlier than the implication in the article.
If you want to offer proof, I suggest finding a better example.