Over at Tallbloke’s Talkshop, moderator Tim Channon wondered about this regularly hot station reported in the news:
An often appearing name in the BBC news as the hottest place in the country is Gravesend but the true location of the Met Office thermometer is a mystery. By chance I followed up today and discovered a new snippet of information.
From the BBC – 2003: Britain swelters in record heat
Britain has recorded its hottest day ever as the temperature soared to 38.1C (100.6F) in Gravesend, Kent.
The record has actually been broken twice today. The first place to beat the previous record of 37.1C (98.8F), set in Cheltenham in 1990, was Heathrow Airport where the temperature earlier today registered 37.9C (100.2F).
Then an even higher temperature was recorded in Kent, making today the hottest day since records began about 130 years ago in 1875.
Here’s another example: Gravesend sizzles in late September sun
It’s definitely time to get that sun screen out as Gravesend is officially one of the hottest places in the UK today.Temperatures reached 28.6C this afternoon, making it Kent’s warmest September 30 ever!
Clearly, it is a leading hot spot.
So what does the Met office say about how official weather stations should be sited? They have it right here:
http://www.metoffice.gov.uk/learning/science/first-steps/observations/weather-stations

And what does the officially hottest station in the UK at Gravesend look like?

The process of discovery of this station was a long one, aided by a global discussion at Tallbloke’s Talkshop. This Bing Maps aerial view I found and posted at TB’s confirmed to me that there was in fact a Stevenson Screen there:

Source: http://binged.it/RqV8Cv
And that lead commenter “Caz” to make the discovery of the photo:
Caz says:
The Bing Link cracked it for me. It was obvious looking at the shadows that the weather station, transmitter and radar tower were sat on a level depression protected on three sides by banking ie they had their own micro climate.
I then selected Ordnance survey mapping and confirmed that this was indeed a place with a micro climate as the banks are clearly marked on the OS map. But it gave one other vital piece information, the location is Broadness Salt Marsh.
Just a few steps later and a Google of Broadness Salt Marsh and I had the picture and all the information required to see that this weather station is a dud. Note the banking, brick power building with ventilation equipment and the weather station.
http://commons.wikimedia.org/wiki/File:Broadness_Radar_-_geograph.org.uk_-_48941.jpg
The Met Office should hang their heads in shame and also the BBC for reporting the temperatures recorded by this station. Well done chaps I hope you can get the message out to the wider world. If anyone lives in that area the site looks easily accessible.
Getting the message out to the wider world is what we do here at WUWT, happy to help.
Now here’s the interesting thing about this station, it has a trifecta of siting issues, and not just from the air conditioner and brick building. Look at the location located by Tim Channon:
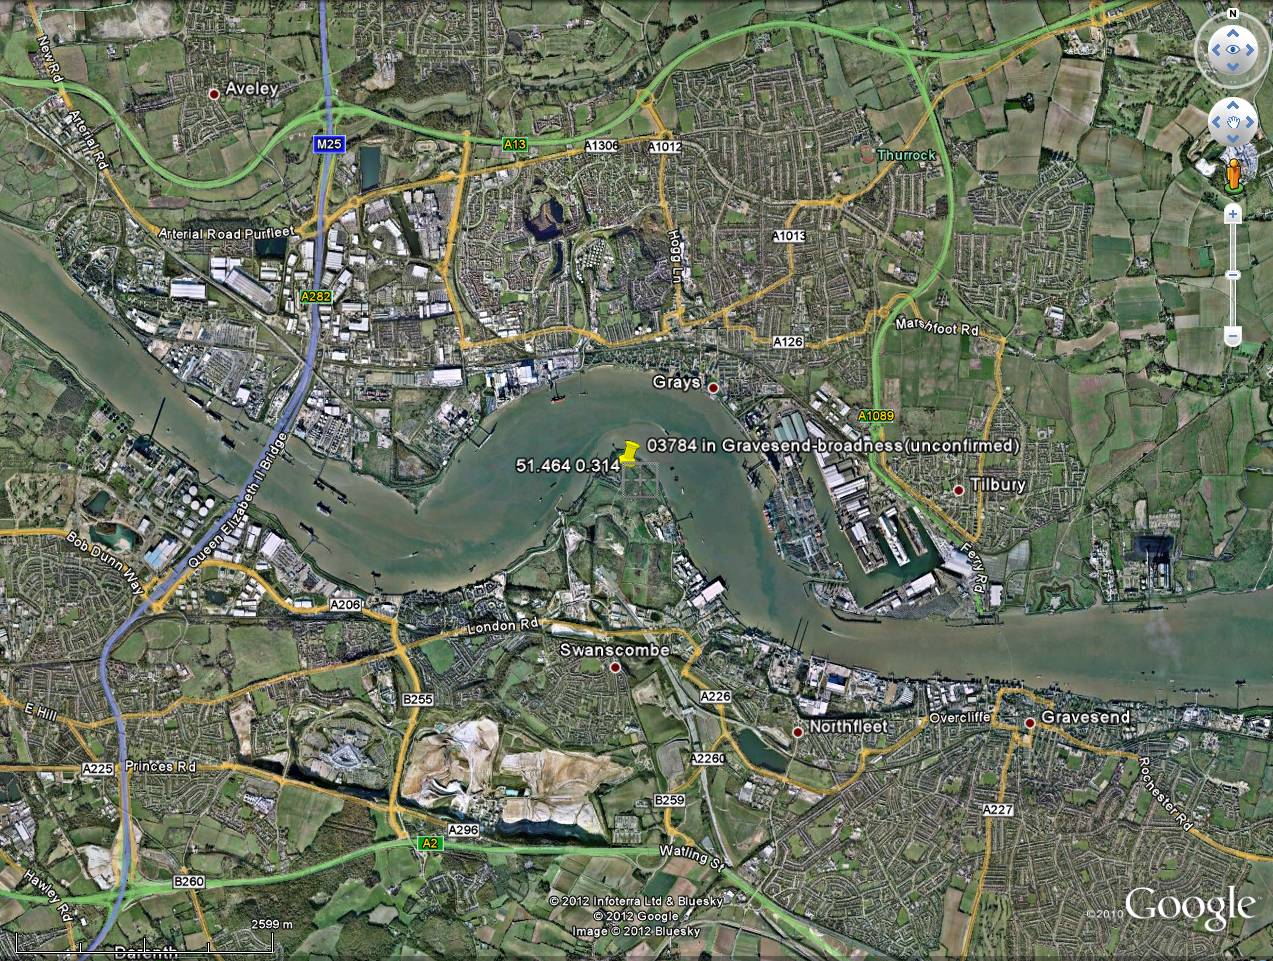
That spit of land juts into the Thames. What is nearby? Channon writes:
This is east of London, is the tidal lower Thames close to the estuary. It is going to be permanently humid, including any effect from the elevation of the temperature of the Thames, heat from London.
Industrial activity is obvious as is close dense residential.
Go towards London (left) and within 5 km is the non-motorway section of the M25 London orbital “motorway”, blue on the map. This is 8 lanes all told with queues a lot of the time, is a toll road. Queen Elizabeth bridge southbound and the Dartford tunnel northbound. Both expel heat into the air, a bridge and ventilated tunnel. South side to the left of that see the bright circles? Heavy oil storage tanks, river pontoon for fuel delivery tankers. Next across is the RWE Littlebrook power station. Being oil is probably not run continuously, about 1.4GW output and has additional gas turbine generator sets. This will eject circa 2GW of waste heat, up prevailing wind. RWE web page on station, head photo is looking east toward bridge and weather station.
Next to the left is a wee and poo plant, also tends to be warm stuff. I expect the sludge is tankered into the outer estuary for disposal. (used to be the case)
Little Reach Sewage Treatment plant, run by Thames Water. Photo looking west, can see the edge of the power station.
Is that all?
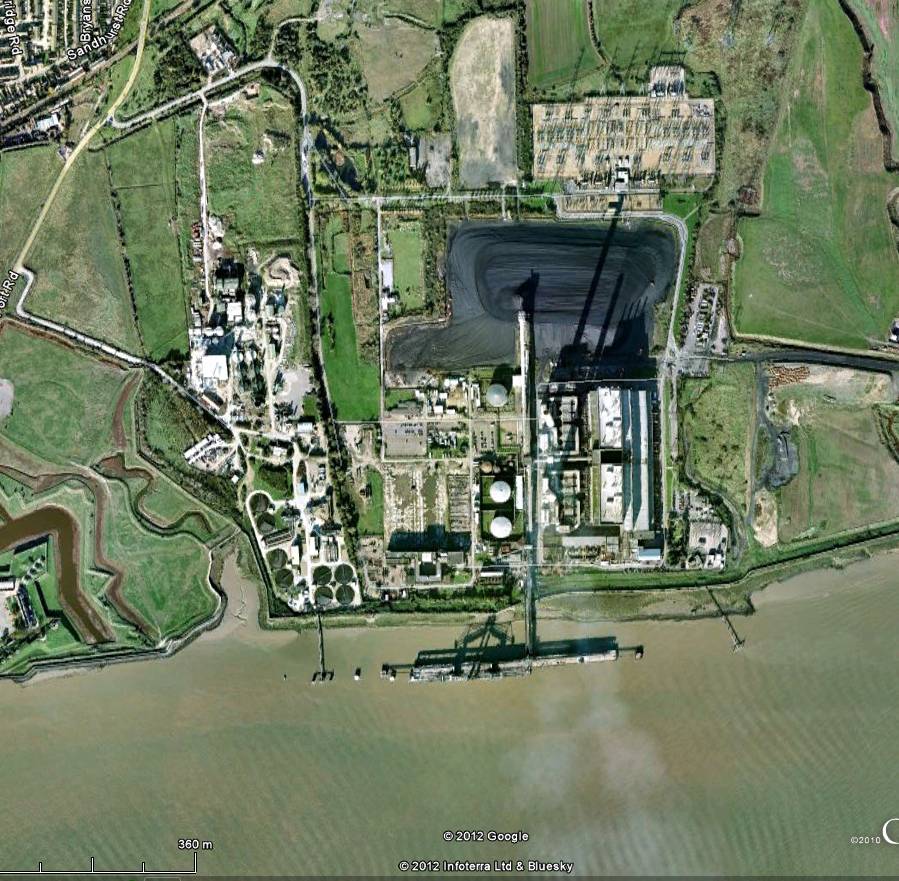 Figure 3
Just off the right of the previous image, north side of the river is… another power station. Top of image here is the electricity output site.
RWE Tilbury Power station, coal fired, hence the pontoon for delivery and black stuff but the RWE web page says the site is being converted. Looks like another 2 to 3GW of waste heat, east winter winds or blocking highs have this one upwind. I notice the RWE photo doesn’t want to show much.
Converting to biomass? I bet the conversion efficiency is lower than conventional fuels, therefore even more waste heat.
There are other power stations a little further away, at least two major ones to the east. (there because of the river, coal delivery)
All this sparkery, I’ve not reached the end yet.
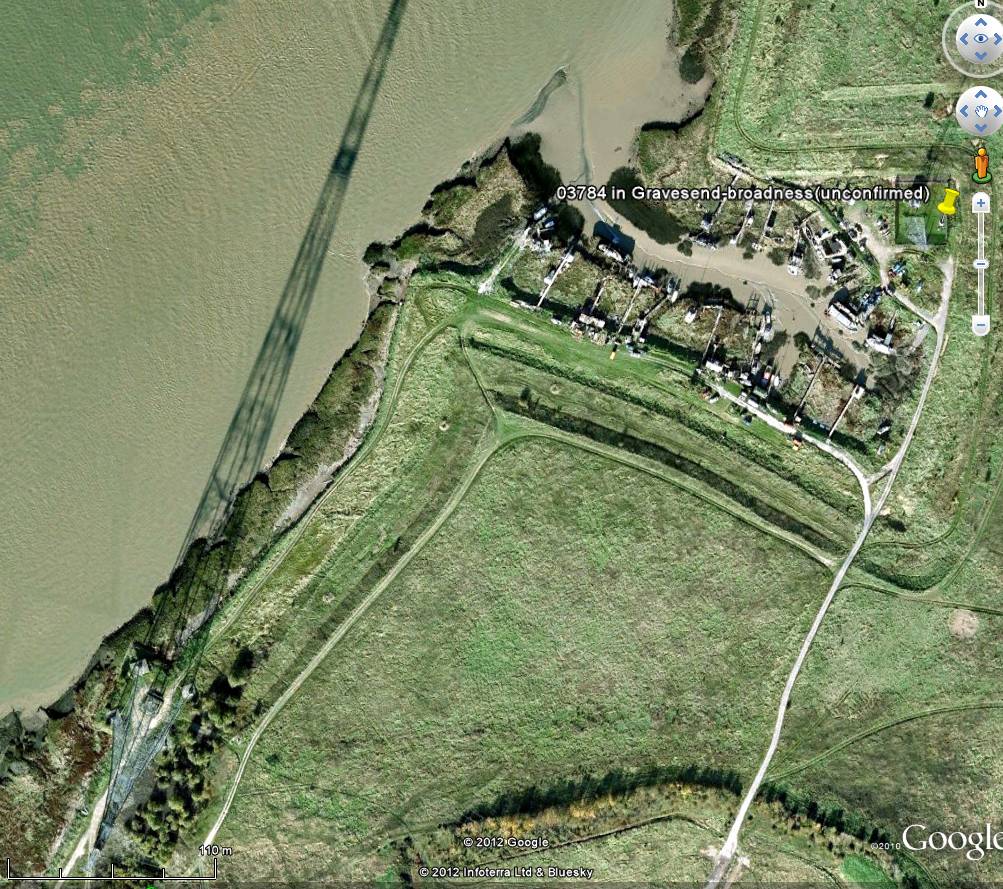
Figure 4
So what is that? Met site is top right. Four piles at the base, is a large power grid pylon, can look bizarre from an aircraft (these are aerial photos, not satellite).
Electricity transmission is not 100% efficient, the lines get hot, are a compromise. Actual lines are aluminium with a steel core. The alignment, this is a river crossing.
Other side are several sites
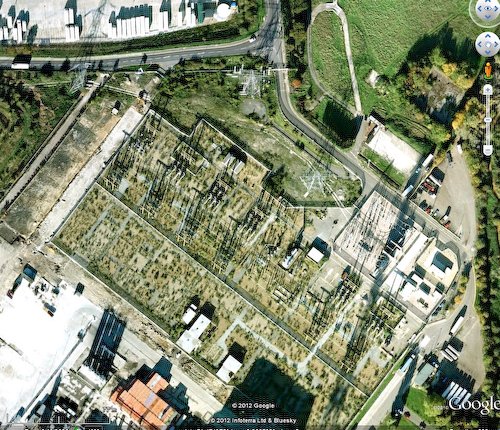
I pointed out that:
It may be that the station is affected by heated water discharge from the power plant and the sewage plant into the river. Being on that spit of land it has water on three sides.
Only some water temperature measurements will tell for sure.
But another commenter pointed out:
Scute says:
Following up on Anthony’s comments, I have been digging a little, using Tim’s links. The Littlebrook power station just to the west of the QE Bridge does discharge warm water from its condenser into the Thames. The intake and outflow are the two circles in the Thames, visible in the Bing ariel view if you scroll left. The PDF document on the site that Tim linked says:
“The condensate is pumped back to the boiler for reuse and the cooling water [i.e. now warm water] is returned to the river.”
This must be several hundred megawatts at least, given the fact that it is cooling something approaching 800kg of condensate per second at full operating capacity. This would be in addition to the heat lost up the chimney during oil combustion which may or may not drift over the station in question. What is certain is that a large portion of the condenser outflow ends up bathing the station on three sides. Even if there is some convective/turbulent mixing, the mixed water will retain this heat energy quite well at or near the surface albeit as lower grade heat. Since water has a specific heat capacity four times that of air and the mass of air directly above the Thames is much less than the now-mixed surface layer, it means that the water surface can heat the air above it to the same temperature without dropping in temperature itself, or at least by a negligible amount. This amounts to a very reliable, permanently elevated heating source, one which is likely to be elevated further when the power station cranks up in the evening….I noticed that Thursdays temperature graph for Gravesend showed an anomalous rise at 6PM. I was waiting for today’s 6PM update to see if it happened again but as of starting this comment it hadn’t come through. It might warrant monitoring over the next few weeks or months- though tides will dull or enhance the effect I should think.
Speaking of tides:
tchannon says:
Scute,
Hundreds of MW, probably upper, however, oil is an unusual fuel so I suspect this is peak times only. They mention gas plant but seem to casually throw this in without detail. Presumably a similar power and the thermal efficiency is a little better.
More subtly, I mentioned this is lower reaches, the Thames is a small river with low flow: it is tidal.
For this reason any cooling outfall from the station nominally downstream will flow back upstream… and cooling upstream will stagnate in a pool of water.
Goodness knows the effect, for all I know, none.
So, I decided to have a look at that tidal issue. Again Bing aerial view is our friend:

Source: http://binged.it/NblzVn
Note the exposed dark mudflats. What sort of natural surface has the lowest albedo, and thus absorbs the greatest amount of solar radiation?

Dark and wet…like a mudflat on two sides of the station as seen in the Bing aerial view.
The new “hottest ever” record set in the UK was on August 1o, 2003.
I downloaded the tide data for the outlet of the Thames, Sheerness for that day from the UK National Oceanography center. Times are local to the station, +1 GMT.
21217) 2003/08/10 00:00:00 4.356 0.081
21218) 2003/08/10 00:15:00 4.101 0.063
21219) 2003/08/10 00:30:00 3.840 0.048
21220) 2003/08/10 00:45:00 3.581 0.038
21221) 2003/08/10 01:00:00 3.325 0.032
21222) 2003/08/10 01:15:00 3.065 0.018
21223) 2003/08/10 01:30:00 2.825 0.018
21224) 2003/08/10 01:45:00 2.592 0.015
21225) 2003/08/10 02:00:00 2.372 0.013
21226) 2003/08/10 02:15:00 2.168 0.013
21227) 2003/08/10 02:30:00 1.983 0.014
21228) 2003/08/10 02:45:00 1.824 0.022
21229) 2003/08/10 03:00:00 1.690 0.035
21230) 2003/08/10 03:15:00 1.567 0.040
21231) 2003/08/10 03:30:00 1.469 0.051
21232) 2003/08/10 03:45:00 1.385 0.057
21233) 2003/08/10 04:00:00 1.308 0.053
21234) 2003/08/10 04:15:00 1.245 0.044
21235) 2003/08/10 04:30:00 1.196 0.029
21236) 2003/08/10 04:45:00 1.173 0.016
21237) 2003/08/10 05:00:00 1.186 0.011
21238) 2003/08/10 05:15:00 1.235 0.010
21239) 2003/08/10 05:30:00 1.325 0.015
21240) 2003/08/10 05:45:00 1.458 0.028
21241) 2003/08/10 06:00:00 1.610 0.025
21242) 2003/08/10 06:15:00 1.805 0.037
21243) 2003/08/10 06:30:00 2.011 0.038
21244) 2003/08/10 06:45:00 2.228 0.037
21245) 2003/08/10 07:00:00 2.461 0.046
21246) 2003/08/10 07:15:00 2.686 0.046
21247) 2003/08/10 07:30:00 2.909 0.047
21248) 2003/08/10 07:45:00 3.134 0.053
21249) 2003/08/10 08:00:00 3.350 0.054
21250) 2003/08/10 08:15:00 3.577 0.067
21251) 2003/08/10 08:30:00 3.791 0.068
21252) 2003/08/10 08:45:00 4.011 0.075
21253) 2003/08/10 09:00:00 4.226 0.079
21254) 2003/08/10 09:15:00 4.436 0.082
21255) 2003/08/10 09:30:00 4.645 0.095
21256) 2003/08/10 09:45:00 4.842 0.110
21257) 2003/08/10 10:00:00 5.019 0.127
21258) 2003/08/10 10:15:00 5.171 0.149
21259) 2003/08/10 10:30:00 5.290 0.173
21260) 2003/08/10 10:45:00 5.365 0.196
21261) 2003/08/10 11:00:00 5.387 0.212
21262) 2003/08/10 11:15:00 5.358 0.226
21263) 2003/08/10 11:30:00 5.272 0.230
21264) 2003/08/10 11:45:00 5.125 0.218
21265) 2003/08/10 12:00:00 4.942 0.207
21266) 2003/08/10 12:15:00 4.718 0.187
21267) 2003/08/10 12:30:00 4.475 0.171
21268) 2003/08/10 12:45:00 4.213 0.153
21269) 2003/08/10 13:00:00 3.937 0.133
21270) 2003/08/10 13:15:00 3.670 0.128
21271) 2003/08/10 13:30:00 3.404 0.127
21272) 2003/08/10 13:45:00 3.140 0.126
21273) 2003/08/10 14:00:00 2.882 0.126
21274) 2003/08/10 14:15:00 2.630 0.122
21275) 2003/08/10 14:30:00 2.394 0.121
21276) 2003/08/10 14:45:00 2.172 0.116
21277) 2003/08/10 15:00:00 1.969 0.110
21278) 2003/08/10 15:15:00 1.791 0.107
21279) 2003/08/10 15:30:00 1.628 0.097
21280) 2003/08/10 15:45:00 1.508 0.109
21281) 2003/08/10 16:00:00 1.397 0.112
21282) 2003/08/10 16:15:00 1.302 0.114
21283) 2003/08/10 16:30:00 1.223 0.116
21284) 2003/08/10 16:45:00 1.156 0.113
21285) 2003/08/10 17:00:00 1.110 0.112
21286) 2003/08/10 17:15:00 1.084 0.108
21287) 2003/08/10 17:30:00 1.094 0.111
21288) 2003/08/10 17:45:00 1.141 0.116
21289) 2003/08/10 18:00:00 1.231 0.126
21290) 2003/08/10 18:15:00 1.360 0.135
21291) 2003/08/10 18:30:00 1.528 0.147
21292) 2003/08/10 18:45:00 1.720 0.151
21293) 2003/08/10 19:00:00 1.946 0.164
21294) 2003/08/10 19:15:00 2.187 0.177
21295) 2003/08/10 19:30:00 2.436 0.189
21296) 2003/08/10 19:45:00 2.684 0.197
21297) 2003/08/10 20:00:00 2.928 0.201
21298) 2003/08/10 20:15:00 3.180 0.213
21299) 2003/08/10 20:30:00 3.433 0.225
21300) 2003/08/10 20:45:00 3.685 0.235
21301) 2003/08/10 21:00:00 3.930 0.236
21302) 2003/08/10 21:15:00 4.178 0.237
21303) 2003/08/10 21:30:00 4.425 0.237
21304) 2003/08/10 21:45:00 4.670 0.238
21305) 2003/08/10 22:00:00 4.902 0.236
21306) 2003/08/10 22:15:00 5.133 0.250
21307) 2003/08/10 22:30:00 5.337 0.261
21308) 2003/08/10 22:45:00 5.507 0.273
21309) 2003/08/10 23:00:00 5.637 0.287
21310) 2003/08/10 23:15:00 5.715 0.299
21311) 2003/08/10 23:30:00 5.741 0.313
21312) 2003/08/10 23:45:00 5.695 0.310
As you can see from the data, the low tide was about 1.08 meter at 5:15PM local time.
I looked for historical data for Gravesend, which has a tide gauge according to the London Port authority, but I couldn’t find any actual data. So I had to rely on a tide prediction program. Given that Gravesend is well upstream from Sheerness. one would expect the tide to be lower, since it has an higher elevation difference, which is why the Thames flows east. I downloaded the wxtide32 program since it had a location for Tilbury dock, not too far away from Gravesend.
The tide prediction for Tilbury Dock for 8/10/2003:
Tilbury Dock, Thames Rvr

Sheerness, England - READ flaterco.com/pol.html

  + Corrections: High(+0:20 +1.50) Low(+0:20 -1.00)

Units are meters, initial timezone is CUT

August 2003 low is 0.2m, high is 6.2m, range is 6.0m.

Predicted historical low is -2.1m, high is 8.4m, range is 10.6m.

  Sunday     Monday    Tuesday   Wednesday   Thursday   Friday     Saturday

   07-27      07-28   New 07-29     07-30      07-31      08-01      08-02

L0523  1.0 H0001  5.7 H0043  5.9 H0123  6.0 H0203  6.1 H0245  6.2 H0327  6.2

H1140  5.6 L0606  0.9 L0646  0.8 L0726  0.7 L0808  0.7 L0852  0.6 L0934  0.7

L1753  0.9 H1220  5.8 H1258  5.9 H1335  6.0 H1413  6.1 H1453  6.2 H1533  6.2

           L1837  0.7 L1918  0.5 L2000  0.4 L2043  0.3 L2126  0.3 L2207  0.3

   08-03      08-04   FQtr 08-05    08-06      08-07      08-08      08-09

H0409  6.1 H0452  6.0 H0537  5.8 L0014  0.7 L0111  0.8 L0221  1.0 L0344  1.0

L1014  0.8 L1054  0.9 L1136  1.0 H0629  5.6 H0735  5.4 H0856  5.4 H1010  5.6

H1614  6.1 H1656  6.0 H1743  5.9 L1228  1.1 L1333  1.2 L1452  1.2 L1622  1.0

L2248  0.4 L2328  0.5            H1840  5.7 H1959  5.5 H2129  5.6 H2241  5.8

   08-10      08-11   Full 08-12    08-13      08-14      08-15      08-16

L0500  0.9 L0600  0.8 H0034  6.2 H0121  6.2 H0204  6.2 H0244  6.1 H0321  6.0

H1112  5.8 H1206  6.0 L0648  0.7 L0730  0.7 L0809  0.8 L0844  0.8 L0918  0.8

L1734  0.7 L1830  0.4 H1253  6.1 H1336  6.1 H1415  6.1 H1451  6.1 H1524  6.0

H2341  6.0            L1918  0.3 L2001  0.2 L2041  0.2 L2119  0.3 L2153  0.4
The plot for Sunday 8-10-2003:

The low tide of 0.7m was reached late in the afternoon, about 5:34PM.
Here is what an aerial view of the station and the point looks like at low tide of similar magnitude:

As you can see (if you click image for the closeup) the boatyard to the SW is completely dry. Mudflats are around the station every direction except SE.
So, depending on wind direction that day, combined with the low tide, the station may have picked up some heated air from the mud flats. Unfortunately the station does not record wind data. Given the nearby stations (such as London City) show a shift of wind direction to northerly after about 5PM local time on that date, it is quite possible though:

All news reports I read said the high temperature in Gravesend occurred in late afternoon on Sunday August 10th. The historical data available from the Met Office is rather slim. So if somebody knows where to find the exact time the high temperature was recorded, that would help solve this mystery.
One final thing, this IR map shows that area of Kent near Gravesend to be one of the warmer places around London, warmer even than the cityscape of London itself:

So to summarize the surroundings of this station:
- City UHI nearby
- Industrial area surrounding it
- River with heated water from power plant and sewage plant dumped into it nearby
- Surrounded by water on three sides
- Surrounded by low albedo (high solar absorbing) mudflats nearby with low tide near time of Tmax
- Sited at a radar station with waste heat exhaust systems clearly visible
- Sited directly next to a sidewalk
No wonder it is consistently a high temperature record breaker! On that day August 10 2003, it was warmer than Heathrow Airport where the temperature earlier registered 37.9C (100.2F).
UK residents: Feel free to add any information you can find that will help. Still looking for the high temperature time on 8-10-2003 at Gravesend.
UPDATE: I’ve located this photo also. What looked to be a sidewalk turned out to be a big chunk of concrete. Heat sink anyone?

This photo is from a Royal Meteorological Society publication, they apparently didn’t want the world to see the other nearby issues related to the radar station.
More on that publication, and how I’ve caught the Met Office in a lie, coming soon.
Thank you! British friends are unconvinced when I point out the variable quality of data on which so much hinges, citing your project, but this is their backyard, they’ve driven the toll road many times…a thing of beauty this post! I shall have to forward it over and over.
Meh. This is just more of that impartial (“ho-ho!”) reporting from the BBC. So what else is new?
Have you ever felt how much heat those towers can give off on a hot day?
and how darn cold they get on a cold day !!!
Well, the site actually obeys the guidelines as written and punctuated.
“No trees; buildings, or steep ground nearby that might influence the measurement.”
In other words, there should be no trees, but there should be buildings or steep ground.
Trees nearby? Nope. Buildings nearby? Check! Just right.
A bit off topic, but here is a calculation I’ve been looking at.. to do with average temp calculations.
Calculation of rural/urban average temperatures
Suppose in a region of size 20000 sq miles there are 3 urban areas of size 250, 500, and 250 sq miles. In this region there are 5 weather stations , one in each of the urban areas and 2 rural stations.
Now, over the past 30 years these stations have seen the following trends:
Uurban1 = 2.1°C, Urban 2 = 2.0°C, Urban3 = 1.5°C, Rural1 = 0.1°C, Rural2 = -0.3°C
If we want to calculate the Average temperature change, and we just apply equal areas to each station, and we get an average rise of 1.08°C.
If, however, we apply the urban stations ONLY to their respective urban areas, and split the rural area equally, we get an average temperature rise of .. ZERO !!!!
Oh, I think the presence nearby of a large and moving body of water is bound to be a cooling influence. …
REPLY: One can always count on Phil Clarke to come to the opposite conclusion while discarding all other evidence. It is his mission here. – Anthony
Good work Scute pointing out the nearby Littlebrook power station. As a “responsible adult” (hah!), accompanying school trips around a power station not far from my home (UK Midlands), I was mildly surprised to learn that every day this one station puts about 20,000 gallons less warm water back into the river than the cold water they take from it. Anywhere near a power station you have (literally) industrial quantities of energy flowing around, not necessarily predictably. Not the place to put a thermometer!
Given the size and population density of the UK about the only weather stations unaffected by UHI effect are likely to be in Scotland.
Is there any information about weather stations in the former Soviet Union – did the collapse of the Soviet Union result in a lot of weather stations no longer reporting ? Just a thought that could have a major impact – remove a significant number of the coolest weather stations from the record suddenly in 1991 and that is bound to create a hockey stick some 9 years later.
I find it inconceivable that weather records continued to be available in the chaos following the split – hell, they had trouble tracking nukes !
Compared to many airport sites, this is not a bad siting. Being surrounded by water on three sides and experiencing the shadow of the tower falling on the instrument shelter at some point during the day would be negative feedback as fas as extreme heat is concerned. Compare this site to many airport sites where the instrument shelter is surrounded by runways and access roads in close proximity and you will see that the airport sites, which make up a good chunk of the longer period climate reporting sites, are even more likely to be contaminated by artificially high temperatures.
REPLY: The tower is to the NW of the shelter, so little if any shadow chances. – Anthony
I’m no expert, but being so close to a radar source must heat the platinum thermometer the UK Met Office uses.
There is another possible source of local heating. The microwave emission from the radar antenna could directly heat up the water molecules in the air in its immediate vicinity. The amount of heating would depend on the power and frequency of the radar, but I suspect it could be substantial in the immediate vicinity of the antenna. Depending on the directional characteristics of the radar antenna, it could also cause heating of metals nearby. Think of a really high power microwave oven…
REPLY:I thought of that, having worked on radar system in the past. Your premise is theoretically possible, but any radar operating in that spectrum wouldn’t have much range due to atmospheric attenuation. Most marine radars are x-band or s-band which don’t get attenuated by significant water molecule absorptions. Microwave ovens operate at a frequency of about 915 MHz—wavelength 328 millimetres. S-band is 2-4Ghz (2000-4000 MHz) and X band is 8-12 GHz (8000 – 12,000 MHz) – Anthony
It’s a few decades ago now but I grew up in that area, in a town called Dartford which is a few miles upstream from Gravesend. As kids we used to get around a lot on our (push)bikes. And naturally, mudflats and water in general were a major attraction. Tim’s analysis fits what I remember.
Latitude: 51° 27’ 51.70”
Longitude: 0° 18’ 40.86”
I will leave others to discuss the surrounding terrain and local UHI.
The two vertical blue boxes on the side of the radar equipment building are probably Liebert process coolers rated for 5-tons(17 kW) cooling / air economizer each. At full load, the heat rejection to the outside would be about 85,000 BTU/H or 25 kW each. Both coolers might be near full load because an additional 1-ton(3.4 kW) condensing unit is also visible on the outside wall. If this is a 24/7 radar installation, the process coolers switch to air economizer/exhaust during cooler seasons. Local prevailing winds could blow this plume of heat toward the temperature sensor. I’ve spec’d many of these units for remote cell/radio transmitters.
BTW, these ‘How not to Measure Temperature’ features are what introduced me to WUWT about 4.5 years ago.
Not sure if this info applies but it is common for large wastewater plants to have anaerobic sludge digesters. These generate methane gas which is often burnt off to the atmosphere. Something to look into for this site.
A couple quickies:
(1) Which bands were used for the false color image? I assume 5,4,1 but I truly have no idea otherwise. Without such knowledge it is impossible to understand just what the satellite image is showing.
(2) While the macroscopic issues of geography, tides, and industry are all roughly understandable I’m more interested in the heat pump on the brick building at the site, and the brick building itself. What is the order of influence that we should expect from these items, at distance to the station, while ignoring all other factors? A rough notion of the error would be highly informative to include in the text.
Actually most concerned about the 5-10 foot berm.
Does that go all the way around? I looks like it is two sides at a minimum. Any thoughts on the other two sides?
A shallow depression of that sort tends to (IMNSHO) have -amazingly- stagnant air.
@Steve C says:
Usually they have cooling ponds somewhere.. which leak warm water into the ground.
That’s ok, won’t make any diff to the temp. 😉
In the UK we have our fair share of badly sited stations. I live near one in a frost hollow, which regularly give the lowest winter night temperatures in the whole region.
The depth and temperature of ground water under that site would also be very interesting.
lol.. Just wondering what sort of reading that set-up would give in say Melbourne or Adelaide in the Australia summer !!! What does the thermometer go up to ???
There’s only one reason that Gardeners go to the trouble and expense of creating a walled garden and that is to protect and warm up their crops within the walls.
What we have here is a walled garden and the Stevenson screen is right in the middle of it, protected from direct solar radiation by its white paint but influenced by local climatic heat build up due to the bunding on three sides and a brick building on the fourth.
Mud flats and salt flats are extremely warm places anyway when subjected to direct sun and zero wind.
Alan S. Blue says:
” have -amazingly- stagnant air.”
And Humid , off the mud flats too.. I can smell it from here !!!
YUCK !!
The UK Met Office have the hottest ever recorded temperature as recorded at “Brogdale” near Faversham Kent, which I think is a bit more rural. http://www.metoffice.gov.uk/media/pdf/q/r/Temperature_Record_-_10_August_2003.pdf
You know, when you see such a “thing of beauty” as LJHills says, then reflect on ALL the surface stations facts that Anthony et al have painstakingly brought to the world’s attention, and then consider the impenetrability of so many minds to the absurdity of it all (think Chris Mooney et al), it just makes you sad. Sad that this is far as we’ve made it as a species, that so many of us could actually be tricked with such nonsense.
I query the Warmista: Drop ~75% of the surface stations since 1990, most of those being high latitude, high altitude and rural stations, leaving us with such as Gravesend. MatheMANNically stitch that up with a very few, very special trees, maybe even process it with upside-down Tiljander ALGOREithms only to end up with model predicted anthropogenic “signals” woefully below any normal climate noise. Virtually inconspicuous in the demonstrated abrupt climate extremes that are so typical at a normal end extreme interglacial. Should I be scared? Really?
But the final act in this Theater Of The Absurd has yet to play out. Strong, much stronger than anything yet predicted, thermal pulses (the minimum maybe 1 at the end of MIS-11) always attend the ends of the extremes. They were from a few years to centuries long. But they always dropped off, over years to centuries, into yet another glacial. In consideration of the vaunted “Precautionary Principle” I find it most humorous that the Warmistas are literally “boxed-in” by their very own arguments. Consider for a moment the argument that CO2 actually is the heathen devil gas it is made out to be. Consider further that you, personally, actually have the CO2 thermostat in your control. You have heard, if you were listening, the complete lack of consensus there is on just how much longer the Holocene has to run.
So, if it was ALL up to you, what would you do? Strip the hated climate security blanket from the possibly late Holocene atmosphere because, somehow, you know that this eccentricity minima extreme interglacial will “go long” like MIS-11 did? MIS-19, the only other post-MPT eccentricity minima interglacial, didn’t “go long”. At best it may have run 10kyrs, or 1,715 years less than the Holocene has so far. So 50/50 odds on that bet. Or would you turn a blind eye while mankind “stacks the ‘climate’ deck” with the blatantly obvious security blanket CO2? You know, just in case you are right…….
Best of luck with that!
Wow! Placing a temperature monitoring station right above a black roof!!! Brilliant bunch of lads.
Anthony, I wonder if you don’t have enough readers here to actually put together surface stations project for other nations? Bet there are some real doozies out there.
If this is a max/min thermometer setup, how do they know the time of day that the max/min was reached? Does this station have an automatic system installed in a Stevenson screen?
REPLY: yes autologging now – Anthony
Brogdale weather station ??
http://www.flickr.com/photos/19339323@N00/493954034/
Gunga Din says:
August 18, 2012 at 3:45 pm
Not sure if this info applies but it is common for large wastewater plants to have anaerobic sludge digesters. These generate methane gas which is often burnt off to the atmosphere. Something to look into for this site.
====================================
Just to clarify since GHGs are so often mentioned here, I don’t mean that the methane may be forming a “mini-green house” but thatthe methane, if is is generated and burnt off here, can make a flame many yards high. (Think as high as a house.) That’s a lot of heat.
http://www.weather-banter.co.uk/uk-sci-weather-uk-weather/121618-brogdale.html
Apparently, the Met office has already fessed up to some of the problems at the Gravesend station.
Further discussion can be found here
http://www.ukweatherworld.co.uk/forum/index.php?/topic/47722-is-gravesend-an-official-station/
‘Even warmer than first thought’
However, according ti the BBC “The Met office later admitted the highest-ever temperature was recorded not in Gravesend, but in nearby Brogdale, near Faversham, also in Kent, where the temperature reached 38.5C (101.3F)”, as some commenters on this thread have already pointed out.
The new record holder is located at an orchard called Brogdale Farm.
This may be it.
http://binged.it/R9frSO
If it is, there don’t seem to be major siting issues other than the high hedges (but I’m no expert on this).
The BBC reported that the Met Office went “to check the equipment and check it was running correctly” but didn’t report them issuing a new screen for the station.
However, I came across several references to a peer reviewed paper by Stephen Burt and Philip Eden, apparently detailing some problems with the Brogdale station, but I didn’t find this online.
Thanks for giving Tim’s post wider exposure Anthony, and for your input as the thread developed.
Just to answer a couple of points raised:
Brogdale college station is not a MET station. Calibration? Dunno.
The berm skirts around the inland side of the station covering around 240 degrees.
The tidal stretch is such that during low summer flow, the water can travel 17km downstream and come back 14 on the rising tide.
You’re telling me that’s the hottest place in England? I don’t believe you.
There’re clearly lots of things to keep the minumum temperature up, but to be hot, it’s got be low(check), dry (cross)and low albedo (Hmmm – it could be worse).
I suspect either the thermometer is reading high, or it’s catching the vented heat from the radar building.
Sorry for your discomfort.
Meanwhile, temps in the Grand Canyon, AZ, are in the cool 80’s daytime, and 50’s at night – they’ll remain so for the next several days as nice cool showers blanket the area during the day.
Go figure.
This in a place that is usually a 106 F. oven (average daytime highs) in August. (A nephew hiking in to camp with his geology class.) Lucky bugger.
Look, I don’t like to piut a dampener on all this but I can’t quite see wgahty the point is.
If Gravesend, say, has recently recorded a record temperature then that is that . It’s irrelevant whether Gravesend is in a rural location or if it is located in central London. It hasn’t suddenly moved from a rural location to an urban location, it’s always been wherever it is currently located.
We know that some stations record higher temperatures than others because of “siting issues”. But that’s always been the case. Urban stations tend to record higher temepratures than rural stations – particularly during hot summer days or cold winter days.
If Gravesend has recorded the highest UK temperature in 2003, say – then it is reasonable to report that fact. Gravesend must have been warmer on that day in 2003 than it was on any day in the 1990s, 1980s, 1970s ….. The chances are that several other places (including rural ones) also recorded their highest temperatures.
http://www.wolframalpha.com/input/?i=gravesend+kent+england+temperature
And some more about the Brogdale site, from climate Audit
Chris Manuell
Posted Jun 7, 2007 at 5:02 AM | Permalink | Reply
I think the situation is even worse than is shown because many of the country
sites are surrounded by trees.
I surveyed the Brogdale Site at Faversham in England: Google Earth 51
17’49.20″N 0 52’40.30″E. This is the site that recorded the highest
temperature ever recorded in England.
The site is in Orchard land crossed by windbreaks with a conifer windbreak on
the prevailing wind side 13 metres from the Stevenson Cabinet. If you google
in “Micro climate in Orchards” you will find a lot of research has been done
to increase crop yields by raising the micro climate temperature because of
less air movement, raising the temperature by “several degrees” both during
the day and night. The night temperature is raised because the higher day
temperatures warm the soil more, which then radiates upwards as the air
temperature cools. Paradoxically it can also cause frost problems because the
cold air near dawn gets trapped within the windbreak area being heavier air
than that surrounding it, unless it can drain away down a slope.
Or maybe the radar maintenance guy chucked his coat over it.
Alan S. Blue wrote:
“Actually most concerned about the 5-10 foot berm. Does that go all the way around? I looks like it is two sides at a minimum. Any thoughts on the other two sides?”
These may be the remains of defensive earthworks at what is a commanding position on the Thames. For comparison, look at the bottom left of figure 3. Any military historians want to comment?
Err no John Finn.
If we are talking about always then it’s obvious that always does not include a triangulation mast, a radar mast, a brick building housing the electronics for these an air conditioning unit discharging its waste heat over the temeperature sensing station.
Then there is the small matter of earth bunding on three sides of the site and a brick building screening the fourth.
This official Met office site breaks all the Met office siting rules because its results can not be relied on, It really is that simple.
Anthony, are you aware of this Met Office beta site?
http://wow.metoffice.gov.uk/tabulardata?&siteID=12010
Won’t let you go back to 2003 unfortunately but has about a year’s worth of data if you want to analyse against with tide times, etc. Click Home for map showing all stations.
Now let us see a night time, night-lights satelite image so we can adjust for UHI, per GISS.
Let’s see. 51°27’51.95″N 0°18’40.97″E
River on 3 sides for >2500 ft. Power substation. Boat Dock. Lawn for 1000 feet to SW,S,SE
using a MOD500 500m pixel, this doesn’t look “built” to me. It might very well be classified as rural. A 1 km night-light — i don’t know. A black spot in a field of light.
See also Chiefio “Golden Juarez”, Nov 1, 2010
Here is an idea for some research on this site.
the power plant needs to be down for multi-day stretches for maintenance.
If we can get the temperature records from the site, then stratify the data as to whether the power station was running that day, we might see a signifant difference large enough to quantify.
The galvanized steel towers located on the site have several tons of steel close to ground level. I’m sure on hot sunny summer days they would be very hot to the touch. The embedded foundations would also absorb heat and then radiate it out. They are heat sinks of consequence located near the instruments. Their contribution would be small but cumulative to all the other problems with this site.
John Finn says:
August 18, 2012 at 5:07 pm
Look, I don’t like to piut a dampener on all this but I can’t quite see wgahty the point is.
…..
If Gravesend has recorded the highest UK temperature in 2003, say – then it is reasonable to report that fact. Gravesend must have been warmer on that day in 2003 than it was on any day in the 1990s, 1980s, 1970s ….. The chances are that several other places (including rural ones) also recorded their highest temperatures.
Well John, piut it this way. As the BBC said, it was the highest max temp recorded since records began in 1875.
But the BBC was being economical with the actualite.
Wgahty if I was to tell you there was no station there until 1995? Such a location just downwind from the capital next to a couple of power stations and some cooling system exhausts was likely to produce a very high max temp.
If I was being cynical I might think maybe that’s why the MET set up a station there.
Phil Clarke wrote:
“Oh, I think the presence nearby of a large and moving body of water is bound to be a cooling influence.”
“Thermal pollution” of waterways by discharges from power stations was a hot environmental topic in the late 60s to early 70s. The power companies conceded that their plants raised the temperature of the water courses. Regulations were apparently introduced even though the environmentalists failed to prove any significant harm. Indeed the rise in temperature was often beneficial for some species of aquatic life.
Thermal Pollution Stirs Big Debate
The Miami News – Jul 9, 1970
http://news.google.com/newspapers?id=ygxgAAAAIBAJ&sjid=4ekFAAAAIBAJ&pg=5580,4230170&dq=thermal-pollution&hl=en
Thermal Pollution Damage Termed ‘Overestimated’
St. Petersburg Times – Jan 11, 1971
http://news.google.com/newspapers?id=JQhSAAAAIBAJ&sjid=s3UDAAAAIBAJ&pg=4890,266774&dq=thermal-pollution&hl=en
Once Hot Issue Cools Off As 2 Attend Hearing
The Milwaukee Sentinel – Sep 14, 1976
http://news.google.com/newspapers?id=zXhQAAAAIBAJ&sjid=4hEEAAAAIBAJ&pg=4378,2204995&dq=thermal-pollution&hl=en
Phil Clarke says:
August 18, 2012 at 3:21 pm
Oh, I think the presence nearby of a large and moving body of water is bound to be a cooling influence. …
The Thames is a slow moving river winding through a flat landscape for many miles. I swam in it as a youngster way upstream at Lechlade one sunny afternoon in the mid seventies. The water was warm.
Near the station in question the low tide Thames is wide, comparatively shallow and slow moving. Plenty of time to soak up the Sun all morning until the high reading at the hottest point of the day at 14.30 We’ll track down some temperature reading for the river at low tide at that time of year during a warm spell to get some idea.
If you go onto this site http://www.old-maps.co.uk/maps.html
you can get maps from the 19th century until the late 1990s of the area.
From what I can see, this area was called the Broadness salt marsh until the 1960s, and it is marked as being \”saltings\”, and it indicates rushes on the maps, and in fact the earliest map (1869-75) shows the whole of the isthmus as being boggy land. The inlet, which in the 19th and early 20th century was much longer, almost bisecting the isthmus in half has shortened over the period since 1960.
The first mention of a structure in the area is on the 1970s map when there is a radar station. (It is not on the previous 1966 map). The sewerage plant, which is south of the station is there much earlier – from the 1938 map onwards – though the pond that looks like it is associated with it was much bigger in the earlier maps.
Post author at the Talkshop comments…
Bemused and a bit embarrassed.
Anthony has done some additional work I’d never have considered and put things into a form better understood. Never mind, a long rule of life is never try and second guess the future.
What is so nice is how others have added unexpected snippets and resources, thank you. Photographs particularly are very telling, as is “I know the area”.
The radar site photographer Glyn Baker has more work http://www.geograph.org.uk/profile/1601 and I think it is good for everyone that usage is allowed.
The concept of the geograph site is interesting, a photo for each Ordinance Survey (official maps) grid square. Personal views of real England. Perhaps here be indexed gems.
The Brogdale photo came as a shock although after a moment’s thought perhaps it is a well orchestrated place, although yesterday I’d never heard of it.
The Met office did an investigation of the Brogdale record temp and concluded it was anomalously warm by 2C, but they couldn’t determine why.
http://www.weather-banter.co.uk/uk-sci-weather-uk-weather/121618-brogdale.html
scroll down to the last post
From what I see, there are three towers in the fenced-in area containing the Stevenson house. One is on the roof of the building, which I assume is the radar transmitter, another taller tower is next to the building, and what appears to be a short tower is affixed to the ground right next to the Stevenson. Any ideas as what the the two ground-mounted towers are for?
The tall tower has comms antennas on the top of the mast so is likely the microwave comms to relay the radar data to the control center. The short tower isn’t clear enough in the picture and the shadow overlaps the fence shadow so no joy on seeing what antennas it might have.
John Finn says:
August 18, 2012 at 5:07 pm
One cannot assume that the intrusive factors that might affect temperature readings are constant. Some of the factors depend on decisions by managers of power generating stations and managers of waste treatment facilities. The air conditioner is clearly a wild card. There are other such factors. One must observe the surrounding area for a considerable time to determine just how spiky the influences on temperature actually are.
Actually, I think the siting looks OK. If you require a weather station to be sited far away from any human activity, then most of the UK gets excluded, and what’s the point of that? The most important thing (after siting it reasonably apart from buildings, etc, as at this site) must be that the siting remains the same over time. We should record local changes due to human activity, anything from farming to urbanisation. Climate research is more than calculating a global temperature.
The Stevenson screen stands on a grey galvanized steel structure.
Isn’t it supposed to be white washed wood?
We also get warm air from the european continent, like at the present, which hits the east coast of Kent first so that could well be another factor causing a higher temperature there than the rest of the UK.
Surely if you’re getting continuous anomalous records at a single weather station it would set an alarm bell ringing somewhere so that they would get someone to check the thing and why there would be such an anomaly? A 1st year, no a 1st DAY stats student would recognise something was amiss with such data.
@Philip Bradley,
You beat me to it with the link to the weather-banter UK forum post. I’d note that the comment at the bottom of the page is by Stephen Burt, one of the authors of the article mentioned in a quote in a comment by David Ross earlier.
He says –
The results of three separate and independent analyses clearly
demonstrate that the maximum reading of 38.5ºC obtained at Faversham
on 10 August 2003 is anomalous (approximately 2 degC too high) and
cannot be easily accounted for meteorologically, climatologically, or
statistically. The authors believe that other reasons must be sought
to explain it*, and that ‘The Faversham Maximum’ cannot be regarded as
sufficiently beyond doubt to justify its continued claim to the UK
national temperature record.”
(Note that this is relation to the Brogdale site, not Gravesend)
http://www.weather-banter.co.uk/uk-sci-weather-uk-weather/121618-brogdale.html
Rational Db8 says:
August 18, 2012 at 4:31 pm
Anthony, I wonder if you don’t have enough readers here to actually put together surface stations project for other nations? Bet there are some real doozies out there.
I recall that, say 2 – 3 years ago, there was discussion here of doing that. I posted a message that I would be happy to do my bit, if needed. My recollection is that there was another post to say it didn’t get off the ground as many weather stations are based on RAF stations and MoD (which is also the parent body of the Met(eorolgical) Office) denied access and photographing permissions for “security reasons.”
Don’t worry, the highest temperature this year was yesterday at 32C give or take.
So that means that in 9 years, temperature has dropped 6 degrees, pointing to a 60 degree drop per century.
That’s how climate science is done, isn’t it??!!
LOL
A fascinating thread that shows just how careful we have to be with temperature records. So much garbage in!
The by-the-way comment from the Met Office, “modern temperature instruments react quickly and record more extreme transitory highs, so we have no idea how to compare these recent temperatures with older highs” is also useful. If that’s the case, then if any adjustment of the temperature record is going to take place then it should be DOWN for recent temperatures. I could imagine that the whole of the supposed warming of the past 30 years is due to a gradual switchover to “modern temperature instruments” that “record more extreme transitory highs”.
I haven’t had time to read it properly yet but –
http://publications.environment-agency.gov.uk/PDF/SCHO0707BNAG-E-E.pdf
This document about UK river temperatures is interesting. See page 49 and add up the temperature totals. The Thames has risen in temperature faster than rivers in the other regions and even faster than national air temperatures over the same period. Caversham Weir is west of London. On page 43 it shows how the different stretches of the Thames have vaired but it’s hard to tell if the east of the Thames (downstream) has warmed differently than the west (upstream). It would be interesting to compare Caversham Weir with Teddington.
I see the Huff Post was blathering about the Olympic temps here…
http://www.huffingtonpost.co.uk/2012/08/19/uk-weather-heat-wave-continue_n_1805150.html?utm_hp_ref=uk
“Most of the UK enjoyed temperatures in the high 20s on Saturday, but at Cavendish, in Suffolk, the mercury reached a high of 32.4C (90.32F), eclipsing the previous high of 31.4C (88.5F) recorded at London’s Olympic Park on July 25.”
The weather bods at ukweatherworld were trying to locate the Olympic weather station to see why it’s reading high after John Mason highlighted a 95F Olympic temp in the Express, I think they found it… located on a black painted roof!
one comment said “…if any of us had instrumentation sited like that, our data would just not be entertained…there would be no reference to it at all and quickly dismissed…..just as any data from this site, if this is where it is coming from, should be. There really should be no reference to it from the Met Office or on any broadcast weather slot.”
Indeed!
http://www.ukweatherworld.co.uk/forum/index.php?/topic/90592-express-alert-express-alert/page__st__360
Owen and tcvaughn: The third tower is the enormous power transmission tower. The shadow is seen in fig 4. This tower and its twin on the opposite side of the river near one of the power stations are much taller than usual to allow tall masted ships to pass safely underneath. Its a pretty long span too so the dip in the cables has to be allowed for.
Peter: I suppose we have to accept that transitory lows are just as extreme?
Somewhat OT, but I’ve just discovered that the UK met office measures daily minimum temperatures of concrete surfaces at many of its sites. I couldn’t find the data or any studies that use it. Rather a pity, because I believe it would have an interesting tale to tell.
http://www.google.com.au/url?sa=t&rct=j&q=&esrc=s&source=web&cd=3&ved=0CF8QFjAC&url=http://www.metoffice.gov.uk/media/pdf/k/5/Fact_sheet_No._17.pdf&ei=axYwUKeWPM6jiQemq4GoAw&usg=AFQjCNFl0PR4ly9euwqtcuITf8npWPTFlA
Gunga Din says:
Not sure if this info applies but it is common for large wastewater plants to have anaerobic sludge digesters. These generate methane gas which is often burnt off to the atmosphere.
It can also be used for CHP. It’s still being burnt, but cuts the plant’s electricity and gas bills. The idea here is to extract heat from both engine cooling and exhaust for parts of the process which require the waste water to be heated.
To go off at a tangent, earlier this year Tilbury power station was the scene of a major fire fighting incident when the stored biomass ignited:
‘It could go on for days’: Fears grow over huge blaze that broke out at Europe’s biggest ‘green’ power station in Essex
“A severe fire that broke out at one of Europe’s largest green power station is now under control but there are fears that the blaze could continue to burn for days.
Around 120 firefighters have been tackling the fire at Tilbury Power Station, which erupted in a fuel storage area at 7.45am.”
Gravesend is a dud as a site, no argument there. The other place that had 100+F temp on the day was Heathrow Airport.
Heathrow Airport is the busiest airport in the world, so that record is a non-runner also.
So we are back to the previous record set in 1990 , which was Cheltenham at 99F. No issues with Cheltenham.
My first thought on seeing transmission towers close to the weather station was that the temperature sensor wiring may be acting as an antenna, and that this could be causing measurement errors. I experienced this myself one time, trying to take temp measurements in a radio station building close to the tower, using an digital temp meter whose probe was on the end of coiled wiring – when I pulled wire straight, the reading went all over the place.
“Given the size and population density of the UK about the only weather stations unaffected by UHI effect are likely to be in Scotland.”
Oh there’s plenty of Britain that remains rural. But you’d have to decide to site weather stations deliberately to be suitable for a disinterested study of climate. Fat chance!
For the Brogdale,
site has anyone got a record of any specific orchard type machinery around the place like nice big truck mounted crop foggers or truck mounted genny/lighting sets for use on dark winter evenings, or tractors and trailers for crop harvesting purposes, just sitting on the track next to the station?
kent is the most southeasterly county in the UK. This is closest to continental Europe and furthest from the moderating effect of the Atlantic. Any geographer would expect the highest UK Summer temperatures to be recorded in this region.
Recycling seems particularly fire prone. Here in Perth, the recycling warehouse for the southern half of the city, and according to reports the size of 10 football fields, burned down last month for the second time in 2 years.
@Another Gareth
I bet it smells lovely around there…
This is a brilliant and outstanding post. Well done! Night after night I watch with dismay as the BBC gives the headline “highest” temperature of the day for UK to be in London, while all around the capital the temperatures shown are typically an average of 10% lower.
It’s a microwave oven with all those megawatta of microwave energy spraying around!
Do I see a heat pump exhaust on the side of the building?
Philip Bradley, here in Canberra, our stocks of recyclables burn down all the time as well. They are serious fire hazards.
Still, better that than contribute to pollution! 🙂
Fascinating Research!
I too research and I want to share my findings.
The meanings behind the BBC “Flagging” of this area is William the Conquerer overtook/mis-ruled the country from Barking Abbey. That’s why on BBC East Enders the camera follows the Serpent Isis down to the Abbey area > GRAVES_END > East Enders
So look to your past for the answers behind their charades
‘Norman’ Barons were by blood “Vi-kings”
hint East-Enders is a form of SAGA
N-joy
There appears to be a British version of Surface Stations that previously identified the location of the Gravesend site at:
http://weather.gladstonefamily.net/site/03784
They have the arrow right on the Stevenson Screen, but they do not have the nice picture of Broadness Radar from wikimedia.
“Kelvin Vaughan says:
August 19, 2012 at 7:12 am
Do I see a heat pump exhaust on the side of the building?”
Yes it’s a condenser (of maybe a reversible). When running will chuck out a few kW but at that distance I very much doubt it reaches the screen except under freak circumstances.
Possibly more important is thermal radiation from the building (and banks), one of the reasons why there must be no structures anywhere near a screen.
Exposure is one of the most critical factors, it means an open sky in all directions to a very low elevation above the horizon.
The effect of the use of Thames water for cooling purposes by power stations alone is said to be about 3 degrees C since 1920.
Out of interest, since when were the BBC the experts on British climate records? If you believe the media you deserve the ridicule it brings you.
On the other hand, should reported temp reflect what was actually experienced? And as I hope we all know, if a site is typically over exposed by 2c then over time the record it produces is equally valid as one which is not over exposed (if you don’t get that, do back to school). Trends are about comparing like with like.
“Taphonomic says:
August 19, 2012 at 8:36 am
There appears to be a British version of Surface Stations that previously identified the location of the Gravesend site at: …”
Useful, made me look at when I reported the location to get the marker moved. Didn’t realise it was that long ago.
As the author of the original article, from an email December 2008. Quotes because this is from a handshake email.
“> Unconfirmed, located using GE.
> Information elsewhere says site is at Port of London Authority
> transmitter site.
> This site is suspected of anomalous high temperature readings. ”
Similar to surfacestations project? Different objective.
“The Citizen Weather Observer Program (CWOP) is a public-private partnership with three main goals: 1) to collect weather data contributed by citizens; 2) to make these data available for weather services and homeland security; and 3) to provide feedback to the data contributors so that they have the tools to check and improve their data quality. In fact, the web address, wxqa.com, stands for weather quality assurance.”
if it is located in a depression wouldn’t that make it COOLER ????????
If an accurate, properly-screened thermometer records a temperature in a given area, that is the actual temperature at that spot, but other external factors may, obviously affect it. The Brogdale reading for 10 August 2003 is, I believe, as accurate as can be reasonably expected. Brogdale is an orchard, far from an urban site, in the area chosen by Henry VIII for his cherry orchards in the 16th century, given its warm climate.
Stephen Burt apparently felt that the Brogdale temperature was anomalous but considered the urban Kew Gardens, London, readings to be accurate although there are heat emitting greenhouses in the park and a wooden fence around the screen. I have readings for several sites in Kent on 10 August 2003, and my own taken every half hour and they are certainly unusual. On 9 August 2003 almost 400ft above sea level in a breezy garden on the hills of east Kent I recorded 89.4f (31.9C) with a south-westerly breeze gusting to 11mph. On 10 August 2003 the temperature jumped to 96.8F (36C) at 3.30pm with a south-westerly breeze backing south-easterly (warm air off the European mainland?) touching 10mph. On 11 August 2003 I recorded 89.5f (31.9C) with a north-easterly touching 22mph. All readings were taken conventionally in a Stevenson screen and with Davis equipment.
The Brogdale (Faversham) area, sheltered by the Isle of Sheppey, is probably the warmest area in Britain and I have no reason to doubt the reading given that it would have experienced the same surge of warm air from the European mainland as I recorded.The Gravesend site is well known but the readings from there are unlikely to be any less meaningful than those from urban London which do, after all, reflect the temperature in which people are living and working. A temperature of over 100f was recorded in the 19th century in west Kent but later discounted. I believe the Cheltenham reading may have been taken at an old airport.
Just an anecdote about waste heat being put into waterways having a real effect…. As a boy growing up in the Wirral, I used to love to go fishing. One of the spots was downstream from a Power Station (hope it wasn’t nuclear…) and as people are wont to do, unwanted pet fish had been thrown in the water over the years. The fish had naturally sorted themselves out by degree of Tropicality and heat needs, such that the further downstream you went, the less tropical the fish. I still remember line-catching a large Angel Fish (put it back of course, this was Coarse Fishing, not Game!)
@David re weatherstations UK
I had a look at the weather records for a number of RAF bases some time ago. Looking back over 20 years or so, the mean temperature had increased – in the daytime. Which I presumed was down to more tarmac sitting in the sun, more flights etc.
I even asked if I could come to RAF Brize Norton to look at the weather station. They sort of said yes, after a few weeks, but I never bothered…
Would be interesting to look at how the RAF bases (the majority of UK weather stations) have changed over the years.
The weather data for UK stations is available and easily extracted back to about 1854 but only become hourly sometime after 1970s.
@David
Also, you probably don’t need to photograph the weather station, just rate it according to standard methods by eye. Some google earthing would be a good start, plus some records of local housebuilding
In the photograph of the Brogdale site the row of conifers could have a significant effect on the temperature readings. I remember being taught that the effect of a shelter belt on wind speed extended down-wind for a distance equal to 10 times the height of the shelter belt.
Bill Parsons says:
August 18, 2012 at 5:01 pm
Sorry for your discomfort.
Meanwhile, temps in the Grand Canyon, AZ, are in the cool 80′s daytime, and 50′s at night – they’ll remain so for the next several days as nice cool showers blanket the area during the day.
Go figure.
This in a place that is usually a 106 F. oven (average daytime highs) in August. (A nephew hiking in to camp with his geology class.) Lucky bugger.
—————————
You would love Ireland. We have two seasons.
In Winter the rain is cold.
In Summer the rain is warm.
We see funny round things in the sky occasionally . People say they are the Sun and the Moon, but we never see enough of either to be sure 🙂
If one of Anthony Watts mobile temperature recorders were put in the windstream in front of every UK electric-powered passenger train, which pretty much cover the whole island, tied in via cellular data links for reporting to a central place, wouldn’t averaging that give a much more accurate temperature for the UK than these stupid old wooden boxes sitting out in the sun, painted dirty white? If the sensor were in a foam-insulated tube that wouldn’t get hot when the train stopped, out of the sun, and sampled only while the train were in motion, it would measure the air going through the tube.
There’s gotta be a better way of measuring the temperature of air, nowhere near a stationary 50 ton air conditioner condensor MOVING through the country.
Magnificent. Worthy of Michael Crichton at his best.
Well done.
When I binged that site and saw the mudflats I was immediately jerked back to my time at Berkeley and the hours spent at the mudflats near the Berkeley pier. That in fact is where I was during the tsunami from the 1964 Alaskan Earthquake. Anyway – the heat that rolls off wet mud is warmed by the albedo of both water and mud. You can feel it when the tide is going out – the heat rise is stifling. Combined with the smell and humidity and it becomes something you don’t forget. The wind from across the bay goes straight up University Ave, perpendicular to the shoreline, and brings the fresh smell of seafloor with it. Not so bad as living downwind from a pig farm, but not by much 🙂
Sorry if this has been covered above. The masts will have either a large concrete base the top of which will be probably 500 mm below ground level or a large reinforced concrete pile cap foundation on concrete piles?
In a “REPLY:” to tcvaughn (original posting August 18, 2012 at 3:37 pm), Anthony wrote:
REPLY:I thought of that, having worked on radar system in the past. … Microwave ovens operate at a frequency of about 915 MHz—wavelength 328 millimetres. … – Anthony
In the U.S., most home microwave ovens operate in the 2.4 GHz ISM (Industrial, Scientific, and Medical) band. That’s why microwave ovens can interfere with 2.4 GHz WiFi signals. According to Wikipedia (I know, I know), large commercial and industrial microwave ovens do operate at 915 MHz. (If you aren’t willing to trust Wikipedia, see the Canadian Centre for Occupational Health and Safety, “Microwave Ovens and their Hazards“, which says the same thing.)
John Edmondson @ 4:44 am on the 19th August 2012:
I’m not sure I’d trust Cheltenham measurements either; at least I would want to know where exactly the measurements are done. They have a small airport nearby, they are just below the Cotswold escarpment and there is a certain other set-up next door also.
Perhaps I can add some comments on the “Gravesend” site. I was struck by how many times Gravesend was reported as the warmest/hottest place in the UK at any time of the year. The coordinates indicated that the site was in the middle of the Thames so I conacted the met office for more precise details. They said that “the area around is generally built up and urban which is one of the reasons that is often the hottest place in the country”. I replied that Broadness was anything but built up and was surrounded on 3 sides by water. No respone to this!
What is interesting is the fact that the maximum temperatures recorded on these peak days are always above any of their hourly recordings and sometimes by more than 1C. Sudden surges in temperature seem to occur at any time of day as recorded hourly – that may be due to the state of the tides, wind direction and exposure of the extensive grey mud flats.
Seriously. How much heat do you really think is going to reach from the radar ‘building’ to the station in such an exposed location?
The Met Office spec says an undesirable: Warming effect from buildings on measurements.
OK the building has NO warming effect. End of story.
REPLY: So prove it. Just saying it does not make it so, especially when you are an anonymous coward. Meanwhile we have an accepted WMO ISO standard that quantifies that they do have an effect, and that weather stations should not be next to them or other heat sinks like the big chunk of concrete.
World Meteorological Organization Commission for Instruments and Methods of Observation, Fifteenth session, (CIMO-XV, 2010) WMO publication Number 1064, available online at: http://www.wmo.int/pages/prog/www/CIMO/CIMO15-WMO1064/1064_en.pdf
That was adapted from:
Leroy, M., 2010: Siting Classification for Surface Observing Stations on Land, Climate, and Upper-air Observations JMA/WMO Workshop on Quality Management in Surface, Tokyo, Japan 27-30 July 2010 http://www.jma.go.jp/jma/en/Activities/qmws_2010/CountryReport/CS202_Leroy.pdf
OK. Just had a look at your WMO document and the Google satelite view of the location.
Clearly the radar building is over 10m away. Which means it would have to occupy 10% of a 30m radius circle. That is extremely unlikely. The large mast isn’t a building. The only ‘issue’ that I can see is the concrete plinth a few metres away (about 3 to 4m) which may or may not represent a problem.
REPLY: We’ll see, a site survey is int he works. Most warmists such as yourself want the issue to go away, but it won’t – anthony
It’s not a question of being a warmist Anthony. It is a question of being rational and realistic.
Your story has made a mole hill into a mountain. Do you agree that the radar building isn’t a problem based on the documents you reference?
REPLY: No.
Here we have the Met Office explaining Gravesend’s record readings with a lack of measurement sites: http://www.gravesendreporter.co.uk/news/the_reason_behind_gravesend_s_record_breaking_temperatures_1_1466764
Wikipedia blames rail construction works: en.wikipedia.org/wiki/Gravesend,_Kent#Climate
As others have remarked, the low albedo mudflats capturing heat on a sunny day is probably the reason for the record highs at Gravesend.
Fairly easy to test. just measure the temperature adjacent to the recording station and out on the mudflats on a hot sunny day.
Would be a good high school science project. Although clearly beneath the dignity of a real climate scientist.
As someone who has actually spent a lot of time working with both weather and navigation radar the chances of it warming anything outside of 3 meters radius is slim to none. Not so for military land based radar which will brown your bacon much farther off. That radar scanner is just not capable of producing alarming heat. The PRF (google it) and peak power produce an average heat that will surely not boil water nor even harden an egg. The vertical beam width of that type of antenna is very large, reducing the focused beam intensity significantly. They were designed for pitching and rolling vessels at sea. And weather just doesn’t require a lot of energy to watch on radar. I’ve painted the moon with a 20 kw peak power S-band radar from Plainview, Texas. The pulse power, given the repetition rate, is very low. But you can watch the moon rise with those peanut whistles and a 20′ dish. It just isn’t the equivalent or even close to a microwave oven where the waves are bouncing around in a tuned box.
The building is on the NW corner of the site. The screen is in the SE corner.
The prevailing wind in Gravesend is from the SW. Most of the time the heat from the building will be blown away from the screen.
I note (as I have also done at TB’s TS) this story from The Gravesend Reporter, Wednesday, August 1, 2012: ‘The reason behind Gravesend’s record-breaking temperatures’.
Here’s the whole thing (since it’s so short):
[snip . . sorry but you will need to provide a link as there can be difficulties with copyright if articles are just clipped and pasted. Those are difficulties that Anthony can do without . . thanks . . kbmod]
So, to be fair, it’s reasonable to note that someone from the Met Office appears to be the main source for this little local news piece, and that he was happy to draw attention to the effect of siting… Congrats due to the reporter, one Joshua Fowler?
It’s also worth paying attention to Tallbloke’s important caveat, not repeated here, that the Gravesend site is /not/ a formal international climatic station — no doubt /because/ the Met Office are already onto the impact of UHI. If Gravesend regularly gets reported as being hotter than else where, might that not be due to the fact that it is actually often hotter there than elsewhere? (UHI from the Greater London conurbation being likely to surpass other local factors effecting temperature in the immediate vicinity). The burden of proof must be carried by those who want to demonstrate a different interpretation, mustn’t it?
The Gravesend Reporter explained all this a few weeks ago — linked by Omnilogos above. To be fair, the journalist’s main source was a guy from the Met Office’s: who was very happy indeed to point out that the high readings from the Gravesend stations are probably attributable to the London UHI. Surely this needs to be taken into account when considering the Met Office’s position on this site? After all, it’s not, as Tallbloke points out, an international station. So the real problem is not so much the existence of the station (why /not/ measure the temperature east of London?), but the use of the data by the BBC. On somedays Gravesend may well be the hottest place in England — because of its location. Records days of heat made headlines in the UK long before Climate Change. So this isn’t this really a story about the way journalists use data, rather than how meteorologists generate it?
A paper published by The RMetS concludes:
It is the considered opinion of the authors
that sufficient doubts remain with regard to
local site influences that the 38.1 °C maximum
reported from Gravesend on 10
August 2003 must be regarded as likely to
be slightly in excess (by perhaps 1 degC) of
a value more representative of the locality.
http://onlinelibrary.wiley.com/doi/10.1256/wea.10.04B/pdf
NO. And the reason is important. Human habitations are a tiny percentage of land area, not to mention total global area. So taking UHI contaminated data results in disproportionate weighting of it, since it must be “smeared” out to cover wide uninhabited areas. As for the actual emitted heat, it’s trivial in the global budget, which just emphasizes how important it is to expunge every trace possible of UHI influence from global estimates.
Fair enough. But reconceptualize the BBC as a policy pressure group/agency, and journalists as propagandists.
Now which aspect of the mis-reporting do you think is more important?
Here’s another picture of the Site. If you blow it up to 200% you can clearly see the Radar mast and brick building beneath it on the left and the large triangulation tower to the right. The Stevenson screen which of course is not visible is between the tower and the earth bunding behind. On a sunny day that must be a tremendous heat trap and influenced by the mud flats, old hulks and abandoned cars, Behind all that is a concrete factory.
http://www.geograph.org.uk/photo/1558134
Hi there I actually live in Gravesend and as your reasearchers have found it has UHI and many other factors as well to produce high temps ..its also a nice place ful of history and warmth..come and visit us ..soon to be renamed Gravesend – on – Thames !
Anthony.
some quotes from Leroy et al
Class 1:
· Flat, horizontal land, surrounded by an open space, slope less than 1/3 (19°).
· Ground covered with natural and low vegetation (< 10 cm) representative of the
region.
· Measurement point situated:
o at more than 100 m from heat sources or reflective surfaces (buildings,
concrete surfaces, car parks etc.)
o at more than 100 m from an expanse of water (unless significant of the
region)
o away from all projected shade when the Sun is higher than 5°.
A source of heat (or expanse of water) is considered to have an impact if it occupies more than 10 % of the surface within a circular area of 100 m surrounding the screen, makes up 5% of an annulus of 10m-30m, or covers 1% of a 10 m circle.
Class 2
· Flat, horizontal land, surrounded by an open space, slope inclination less than 1/3
(19°).
· Ground covered with natural and low vegetation (1 km). A method to judge if the relief is representative of the surrounding area is the
following: does a move of the station by 500 m change the class obtained? If the answer is no, the relief is a natural characteristic of the area and is not taken into account.”
I suggest this excludes motorways 4 Km away, Sewerage Treatment plant 5 km away, powerlines 100’s of meters away (it would be nice if you quantified the heat lost from those powerlines and converted that into watts/M^3 of the air volume between the powerlines and the station to highlight its impact (or lack of it) on the met station site.
These are characteristics of the site and at Class 1/Class 2 this station will do a good job of measuring the local temperature.
Certainly the surrounding industry, river etc may be adding a UHI impact for the site, but as TallBloke comments “…THIS SITE HAS EXISTED SINCE 1995…”. And the features you have highlighted would all be at least that age. So any more local aspects of UHI will not have changed in any significant way over that time and thus would have negligible impact when this site is included in calculations of temperature anomalies.
Thats the whole point of using anomaly based calculations. They allow us to not need to worry about site biases, only worrying any TIME-BASED CHANGES in the biases.
Gravesend is around 35 km from the centre of London, and lies outside the ring road – the M25 vivible on the left of your 3rd image. And as anyone who has been to London knows, the M25 does not run through dense suburbia. It mainly traverses semi-rural land. So a fair distance from London and its UHI effect.
Here is the Wikipedia entry for Climate at Gravesend
“On 10 August 2003, Gravesend recorded one of the highest temperatures since records began in the United Kingdom, with a reading of 38.1 degrees Celsius (100.6 degrees Fahrenheit),[9] only beaten by Brogdale, near Faversham, 26 miles (42 km) to the ESE.[10] Brogdale, which is run by a volunteer, only reports its data once a month; Gravesend which is a Met Office site reports its data each hour.[11]
One explanation for the phenomenon was the large amount of earthworks in connection with High Speed 1, which had exposed a great deal of the local sandy soil, which absorbed more sunshine, although with the geology being made up of mostly chalk in this area adds little weight to this explanation.[citation needed]
Gravesend as a rule inherits a more continental climate like the rest of Kent, Essex and East Anglia rather than the usual maritime oceanic climate the West of the UK experiences. It is therefore less cloudy, drier, and less prone to Atlantic depressions with their associated wind and rain than more westerly locations of the UK.
Gravesend and the surrounding area is relatively dry, especially in comparison to much of the UK, due to rainfall being light and patchy by the time it reaches the region. Heavy rain usually comes up from France.
In the winter, snow is not uncommon and like much of the area, it will inherit more of the continental winters, tempered slightly by the Jet Stream and the coastal location.
Gravesend continues to record high temperatures in summer, sometimes reaching country-wide records, recently including the warmest day of 2011, when temperatures reached 33.1 degrees.[12] Additionally, the town holds at least two records for the year in 2010 of 30.9 degrees[13] and 31.7 degrees.[14] Another record was set during the Autumn 2011 United Kingdom heat wave with 29.9 degrees, the highest temperature ever recorded in October in the country.[15]
The Kent Downs lie to the south of Gravesend, although it is not known if this causes Gravesend to experience the effects of Foehn Winds that occur as a result of adiabatic warming. This foehn effect seems most likely to occur during a southerly wind flow because of the location of the hills in relation to the town, and indeed it is during times of southerly winds that high temperatures would normally occur anyhow.
The weather station, coded 03784, is on the Broadness Salt Marsh at TQ 60657 76470 51°27′52″N 0°18′41″E. It is at the foot of a triangulation mast, on the river bank at St Clement’s Reach, 3m above mean sea level but actually not on the Gravesham District Council area but in that of Dartford.”
Perhaps local factors may have influenced the climate at Gravesend. But not the nature of the observation station. It is measuring what is happening there.
So what exactly was the point of this post again? I thought you were working on your paper, looking into TOBS factors etc.
REPLY: “These are characteristics of the site and at Class 1/Class 2 this station will do a good job of measuring the local temperature.”
LOL! Umm you missed the concrete pylon and the building nearby, Can’t just ignore those, unless of course you are part of the “skeptical science” crowd. The station is class 4 unacceptable, sorry.
And yes, we’ve solved the TOBS issue, but you’ll dismiss that too I’m afraid. This is your fate as an excluder. – Anthony
Anthony. For some reason my earlier post had a section missing from the centre of it where I did some simple calculations in support of my contention that this a Class 1/Class 2 site. Lets try again, with the 1st half of my comment:
=======================================================================
Some quotes from Leroy et al
Class 1:
· Flat, horizontal land, surrounded by an open space, slope less than 1/3 (19°).
· Ground covered with natural and low vegetation (< 10 cm) representative of the region.
· Measurement point situated:
o at more than 100 m from heat sources or reflective surfaces (buildings, concrete surfaces, car parks etc.)
o at more than 100 m from an expanse of water (unless significant of the region)
o away from all projected shade when the Sun is higher than 5°.
A source of heat (or expanse of water) is considered to have an impact if it occupies more than 10 % of the surface within a circular area of 100 m surrounding the screen, makes up 5% of an annulus of 10m-30m, or covers 1% of a 10 m circle.
Class 2
· Flat, horizontal land, surrounded by an open space, slope inclination less than 1/3 (19°).
· Ground covered with natural and low vegetation (1 km). A method to judge if the relief is representative of the surrounding area is the
following: does a move of the station by 500 m change the class obtained? If the answer is no, the relief is a natural characteristic of the area and is not taken into account.”
I suggest this excludes motorways 4 Km away, Sewerage Treatment plant 5 km away, powerlines 100’s of meters away (it would be nice if you quantified the heat lost from those powerlines and converted that into watts/M^3 of the air volume between the powerlines and the station to highlight its impact (or lack of it) on the met station site.
These are characteristics of the site and at Class 1/Class 2 this station will do a good job of measuring the local temperature.
=======================================================================
Many people will be looking forward to seeing how you have processed the TOBs bias. Particularly how your analysis compares to previous work on the subject.
Something strange going on here. The middle section is missing again.
Anthony.You seem to have an issue with text that includes less than/greater than symbols. Everything between them is being deleted. I have removed them from my comment and reposted it – see how we go.
Anthony. For some reason my earlier post had a section missing from the centre of it where I did some simple calculations in support of my contention that this a Class 1/Class 2 site. Lets try again, with the 1st half of my comment:
=======================================================================
Some quotes from Leroy et al
Class 1:
· Flat, horizontal land, surrounded by an open space, slope less than 1/3 (19°).
· Ground covered with natural and low vegetation (less than 10 cm) representative of the region.
· Measurement point situated:
o at more than 100 m from heat sources or reflective surfaces (buildings, concrete surfaces, car parks etc.)
o at more than 100 m from an expanse of water (unless significant of the region)
o away from all projected shade when the Sun is higher than 5°.
A source of heat (or expanse of water) is considered to have an impact if it occupies more than 10 % of the surface within a circular area of 100 m surrounding the screen, makes up 5% of an annulus of 10m-30m, or covers 1% of a 10 m circle.
Class 2
· Flat, horizontal land, surrounded by an open space, slope inclination less than 1/3 (19°).
· Ground covered with natural and low vegetation (less than 10 cm) representative of the region.
· Measurement point situated :
o At more than 30 m from artificial heat sources or reflective surfaces
(buildings, concrete surfaces, car parks etc.)
o At more than 30 m from an expanse of water (unless significant of the
region)
o Away from all projected shade when the Sun is higher than 7 °.
A source of heat (or expanse of water) is considered to have an impact if it occupies more than 10 % of the surface within a circular area of 30 m surrounding the screen, makes up 5% of an annulus of 5m-10m, or covers 1% of a 5 m circle.
I would put the building within the 30 metre radius. By eyeball, and comparing it to the cars in the photograph, the building apears roughly 4M * 8M Perhaps 5M * 10M so lets say 50m^s And it is a true heat source – air conditioners and all that.
A 30 M radius circle has an area of 2827 M^2. A 10M circle is 314 M^2 so the 10-30 Annulus is 2513 M^2
Ratio of these two numbers is 50/2513 = 1.99%
Allowable under Class 1 is 5%. So give that a tick.
Next the concrete block. It looks to be somewhat over 1 metre square. However the plinth is larger, maybe 2m by 2m, lets go with that. So an area of 4M^2 within the 10m radius circle is 1.27% Class 2 there but only if we use the plinth area; if we use the block area, Class 1. And It is not a heat source; ie, a generator of heat in the way the AC units on the more distant building is. If the block wasn’t there the ground beneath it would still absorb sunlight. So Class 2, Borderline Class 1
Nothing else is close enough to have an impact. The River/Mudflats are over 100 m away; beyond the boundary of what is considered significant for class 1, let alone the other classes. Note also that the Albedo figures you quote for wet soil (ie the mudflats) are quite similar to the albedo figures for low zenith angle water. Meaning that the albedo at high tide is very similar to the albedo at low tide. Thus fluctuation in tidal levels have minimal impact and constitute the basic thermodynamic backdrop for this area.
And as for all the other stuff – powerplants, motorways etc; I quote from the WMO paper
“The primary objective of this classification is to document the presence of obstacles close to the measurement site. Therefore, natural relief of the landscape may NOT be taken into account, if far away (i.e., greater than 1 km). A method to judge if the relief is representative of the surrounding area is the following: does a move of the station by 500 m change the class obtained? If the answer is no, the relief is a natural characteristic of the area and is not taken into account.”
I suggest this excludes motorways 4 Km away, Sewerage Treatment plant 5 km away, powerlines 100′s of meters away (it would be nice if you quantified the heat lost from those powerlines and converted that into watts/M^3 of the air volume between the powerlines and the station to highlight its impact (or lack of it) on the met station site.
These are characteristics of the site and at Class 1/Class 2 this station will do a good job of measuring the local temperature.
=======================================================================
Many people will be looking forward to seeing how you have processed the TOBs bias. Particularly how your analysis compares to previous work on the subject.
Thats better. I don’t know if the issue with greater than/less than is a bug or a feature but you might want to look into it.
Sometimes I get the feeling that some posts are designed to distract from other posts and swamp them with “noise”. I could be wrong though,
Living just 4 miles from the weather station and having followed and monitored weather for over 40 years, I think that some of the investigation has missed the point. A lot of work has been done to analyse the proximity to the M25, 8 lane Motorway and Littlebrook D Power Station, and the effect it may have on readings. However, Gravesend is only the warmest place in the UK when the wind is in the SE to SW quadrant. This is when the wind blows the FROM site of the weather station out across the river, so any river based warming would be felt on the Essex side. Also London is to the west and southerly winds do not come from London.
I am 4 miles to the east of Gravesend Broadness, just above the Chalk Marshes, and topography here is everything. When the wind is from the south air temps tend to be warmer than other directions to start with, but when coupled with descending air as the wind comes down from the North Downs to the river Thames, it slightly warms. Very often any cloud cover thins, or even breaks as it descends, and the resultant brightness or sunshine not experienced elsewhere in the region, can also raise temps. The same is true along the whole of the north Kent coast, and the record for 10th August 2003 was only held by Gravesend for 2 days. The new record of 38.5C being recorded by Brogdale near Faversham, 30 miles to the east. That has the same topographical set up at Gravesend with descending southerly airflows. North Kent has more sunshine than London, so that can lead to higher temperatures in Kent in warm airflows.
The situation on that day was very warm air wafted up across France, and warmed further descending into the Thames estuary. My personal reading was 39.2C but my thermometer is not certified as only for my own use.
The fact is, under the right wind conditions, this area IS the warmest in the UK, but a NE wind in winter or spring is more Siberia that anything else :(. My garden is more like the tropics (to look at) in summer, as we have one of the best summer climates in the UK.
Regards
Dave
Dave, thanks for your observations. Great to get some local knowledge. I’ll repost your comment over at my blog.
Cheers
Rog TB