
WUWT Readers may remember in 2006 Al Gore announcing on national television one morning that:
The earth has a fever…
He of course was pushing his book, An Inconvenient Truth as the cure. Now, almost six years later, other symptoms have been reported, including spots, which might be from Chicken Little Pox.
Dr. Clive Best writes in with his findings on The Earth running hot and cold !
He writes: (updated 3/8 to fix some typos and clarify the time period for the map)
There has been quite a debate over at WUWT regarding temperature measurements and temperature anomalies. The AGW crew argue that only anomalies can be relied on to track global warming. These anomalies calculated at each individual weather station are the deltas between the measured temperatures and the mean temperatures over a fixed period – just for that station. The anomalies from ~4000 stations all over the globe are then combined to give one global anomaly, yielding the familiar graph we know and love which shows ~0.6 deg.C rise since 1850. Looking in more detail however we discover that some parts of the world are not warming at all and some are even cooling.
Thus motivated I went off in search of the “hot stations” and the “cold stations” from the Hadley/CRU provided station data.
Here we define “hot stations” as those yielding an average anomaly increase since 1990 > 0.4 degrees. “Cold stations” are defined simply as those with an average anomaly < 0.1 degrees. since 1990. Had/CRU anomalies are relative to the period 1960-1989 so they all measure warming/cooling relative to that baseline.

The map above shows in red the “hot stations” and in blue the “cold stations”. In both cases the larger the point the stronger the warming/cooling. This is an active flash map so you can zoom in by dragging a rectangle, and view the data by clicking on any station, (zoom out by clicking anywhere else).
It immediately becomes obvious that the bulk of observed warming is concentrated in the Northern Hemisphere : Eastern Europe, Russia, central Asia, India, China, Japan, Middle East, North Africa. These are all areas of rapid population increase, development and industrialisation. There is essentially no warming at all in the Southern Hemisphere. Bolivia, Peru, Paraguay and Argentina all appear to be cooling. Even Australia and Zealand are static or cooling.
More at The Earth running hot and cold !
– Clive Best
===============================================================
Hmmm, UHI Much? Maybe there’s a solution:

From the Uranus, 2007
Don’t understand “more cowbell” as it relates to fever? Read this.
Watch the SNL video here (low quality) and a high quality excerpt from NBC here.
Here in Eastern Australia it is the Earth’s runny nose that is giving us problems.
http://www.australianclimatemadness.com/2012/03/flannery-out-of-his-depth-as-flooding-rains-return/
Hmmm…. “Since before 1960” and “after 1960…” I’m not entirely sure that I agree that data from these two time periods are comparable.
Did you find the stations covering the oceans (+70% of the Earth)? The poles? Oh, never mind.
Nice data cut. and Great Sarc. I would think EVERYONE knows Bruce Dickinson. Maybe not. I can picture Gore leading a parade of hippy cow bellers.
I forgot to mention that Al Gore is a hypocrite and a liar. He has at least 2 large houses (one of which has 6 fire places) near the ocean front. I could go on about how his family got rich on Oxidental Oil but I will stop her for now. (He has the ‘carbon footprint’ of King Kong).
I think that both red and blue should be “after” 1960. I hope Anthony clarifies.
REPLY: Pretty sure that’s a typo, checking with Clive – A
From the article:
“The map above shows all stations with an anomaly increase before 1960 greater than 0.4 deg.C in red. The blue points show all those stations with cooling or zero change since 1960.”
Why is the positive anomaly of 0.39 considered cooling? Or am I reading things incorrectly? If this is the case, then I would have to call this a bit deceptive. If not, my bad.
Cheers
JE
Well, according to this report, the sun just sneezed:
http://news.yahoo.com/solar-storm-headed-toward-earth-may-disrupt-power-162508973.html
I loved this bit:
“But for now, scientists are waiting to see what happens Thursday when the charged particles hit Earth at 4 million mph (6.4 million kph).”
There, see, I knew all along that CERN were right and Einstein was wrong 😉
Another triumph for the alarmist mentality and the MSM.
P.S. I think we need to approve some grants to study whether sunspots and/or solar storms are caused by excessive CO2 levels.
damn….it’s from that guy in Europe selling light bulbs as heaters……….
http://apod.nasa.gov/apod/image/0011/earthlights2_dmsp_big.jpg
Two points:
1. I look at the red in NE Asia, and I wonder just how good the pre-1960 data was.
2. Just because there is red in so many NH locations doesn’t mean at all that the cause is CO2.
Would be interesting if someone could overlay that with a map showing population concentrations.
All the Reds are very Blue in the last month.
http://img3.imageshack.us/img3/5851/februarylandtemps.jpg
And the lower troposphere anomalies for February are much lower than the climate model projections so the Earth does not have a fever. It is now getting to a point where a call can be made that the theory is wrong.
http://img827.imageshack.us/img827/8535/ipccforecastsobsfeb2012.png
Anybody else notice the “HADCRUT v4 will fix those deniers/skeptics” meme starting to circulate in the blog comments?
Clearly this type of analysis is just v3ry wrong (/sarc)
Mike Smith says:
March 7, 2012 at 4:48 pm
“P.S. I think we need to approve some grants to study whether sunspots and/or solar storms are caused by excessive CO2 levels.
”
Why of course they are! CO2 is the magic gas and it can do ANYTHING! It can even peel an orange! Heh!
Excellent! I asked about this somewhere about 6 months ago, and got the reply that a ‘warming’ and a ‘cooling’ station could be sited virtually next door to one another (is that microclimate or ‘differential GISS adjustment’?).
So it seemed likely that there were ‘hot spots’ and ‘cold spots’ over the continents. Just blinking at the map, it looks like the warming is concentrated in Eurasia, and has left the ROW well alone.
Not so sure about your explanation though. Parts of E.Europe and Russia are in population decline, and ‘rapid industrialisation’ in this area masks a switch from Soviet-style heavy industry to more consumer-orientated light industry and services.
Also, S. America is still an area of comparatively rapid population and industrial growth, yet is a ‘cold spot’.
There just seems to be something about the N. Hemisphere vs the South, and the Arctic vs. the Antarctic. I’d love to see a simple, comprehensive explanation of this.
John, I think that the stations with warming between .01 and .39 degrees C are excluded. I think some clarification is needed.
if it were uhi then uha and rss would not match the land trend as they both do.
When I read this yesterday, I started clicking on the closer dots, the first I checked was the Monclova Mexico then the Saltillo Mexico sites, very close, yet one red and one blue, then to Google maps, with terrain. Less than 100 miles, both on western sides of a mountain range. I have a hard time believing one is cooling and the other warming, without something like UHI affecting the data, if it were “climate” wouldn’t both be affected?
DAS
John Eggert says:
March 7, 2012 at 4:47 pm
Why is the positive anomaly of 0.39 considered cooling? Or am I reading things incorrectly?
It seems to me that anything between 0.01 and 0.40 is simply not shown by any dot. So ‘slight’ warming is not shown.
Guess what? The earth has a fever, and the only prescription is more government!
Are these figures before or after GISS adjustments?
We all know that GISS data adjustments/manipulations/torturing are essential for any temperature chart/trend/anomaly to be approved by the Team.
And without Team approval where would bad science be?
Is this true or B.S.
http://www.dailymail.co.uk/news/article-2111618/The-new-Atlantis-Entire-Pacific-nation-plans-relocate-rising-sea-level.html.
Enlightenment would be appreciated,
Thank You.
But Mosh said there is no UHI…
davidmhoffer says:
March 7, 2012 at 5:00 pm
Would be interesting if someone could overlay that with a map showing population concentrations.
====================================
David, look here……
http://apod.nasa.gov/apod/image/0011/earthlights2_dmsp_big.jpg
Something I have wondered in relation to UHI is about the spotting of thermometers that goes beyond UHI. I was reading a study about agriculture because gardening is a hobby of mine and was reading about how temperatures can vary by up to 5 degrees (F) and up to 10 in some cases depending on where you plant the crops and the floor beneath them.
This is all old research, and if this is the case, I would think this is a much larger systematic bias then UHI since most thermometers are sited in similar conditions, IE either at airports or for instance around parking lots or grassy fields or perhaps at people’s homes.
I have rarely seen one that is in a hilly location etc or around trees and those that are I would suspect are the outliers that are just thrown out for instance on weather underground as being 10 or more degrees off at times from other thermometers.
Just a hunch, but a systematic bias such as this would be more expected in industrialized countries where the town grows up around a station and the station is never moved. Perhaps its a version of UHI, but the ground is flattened over time to build the city etc, and unlike UHI and direct effects such as A/C vents, its much harder to point a finger at…..
Mr.D.Imwit says:
Kiribati and Tuvalu in the Pacific, and the Maldives in the Indian Ocean are all “sinking”, and have been since around 1991.
They keep asking for help from the rich nations, i.e. land and/or money, because they will be under water real soon. The problem is that the tide gauges show the opposite, so the rich nations aren’t co-opporating. But they keep trying.
cui bono said @ March 7, 2012 at 5:21 pm
Northern hemisphere CO2 is anthropogenic; Southern hemisphere CO2 is natural 😉
Mr.D.Imwit says:
March 7, 2012 at 6:07 pm
Is this true or B.S.
http://www.dailymail.co.uk/news/article-2111618/The-new-Atlantis-Entire-Pacific-nation-plans-relocate-rising-sea-level.html.
Enlightenment would be appreciated,
Thank You.
=============================================
“The tide has started to reach the villages and homes of the people that live on top of the 33 flat coral islands that make up the Kiribati islands.”
Location: Kiribati
Number of months of record Sea level trend (mm/year)
89 -11.0
“These values show that there have been significant sea level falls at Kiribati, Tuvalu and Nauru since the start of the project.”
http://www.globaleducation.edna.edu.au/archives/secondary/casestud/south_pacific/1/sea-level.html
Location: Kiribati
Number of months of record ……89
Sea level trend (mm/year)…… -11.0
“There just seems to be something about the N. Hemisphere vs the South, and the Arctic vs. the Antarctic. I’d love to see a simple, comprehensive explanation of this.”
The ratio of land to ocean in the northern hemisphere is 1 to 1.5. The ratio of land to ocean in the southern hemisphere is 1 to 4.
Seems like the graphic indicates general ocean cooling. The land somehow resists such change.
Sorry…..no reported rationing of land….yet. Meant “ratio”,
I can hear the teachers now. “It’s worse than we taught”.
@benfrommo.
I have said before, that until someone goes out and systematically studies the history of EVERY land temperature site, both at the site itself and in the neighbourhood, and upwind (prevaling at the time measurements are taken), then the use of land temperatures over a time where we know there was a considerable amount of urbaniisation (1970-2000) is basically MEANINGLESS !!!
There is simple no way of knowing just how much the urbanisation has affected the measurements at any particular station unless you go out and look at its history over that period.. even then it would be very hit and miss.
And when warmists say that there is no UHI signature in the calculations.. I just laugh.
I suspect that a large proportion of the increase in the calculated value of the land-base ‘global average temperature’ over the period 1976 – 1996 is due to UHI effects and the so-called “loss” of data acquisition from many remote sites, (where did they all go ??). Odd that this happened just when the AGW bretheren were trying to make their case, and that once satellite measurements became accepted, the so-called “global temperature” stopped going up….just coincidence… I doubt it !!!
Mr.D.Imwit says:
March 7, 2012 at 6:07 pm
Is this true or B.S.
Total BS…..
The following is from http://tidesandcurrents.noaa.gov/sltrends/sltrends.shtml
The mean sea level trend is 2.07 mm/year with a 95% confidence interval of +/- 0.90 mm/year based on monthly mean sea level data from 1948 to 2006 which is equivalent to a change of 0.68 feet in 100 years.
If you look close the end series is 2006, wonder why that would be hummmm. After 2006 the sea level has been dropping. In this crazy little world of climate science this is called cherry picking. So even when we look at the sea level change of .68 feet per 100 years it doesnt look all that scarey. I am willing to bet that the dust and pebbles off tourists feet could deposit that much land height in 100 years.
steven mosher said:
You keep repeating that ad nauseum, yet those who’ve been keeping watch the last 25 years remember the “greenhouse effect” meme back then. Has the “theory” been amended?
According to AGW “theory”, the surface over land should not match satellite; it should be significantly lower.
Per Dr. Roy Spencer (I don’t recall where I quoted it from, but am sure Dr. Spencer will confirm 🙂 )
that should read “temperatures over land should not match satellite”.
“Is this true or B.S.”
Probably both.
It is entirely likely that the Kiribati govt is touting this or even seriously contemplating it, however it is unlikely that sea level rises are going to make a big difference to this island. The local rises are only going to raise the sea levels by around 30cm in a century, and the corals are likely to respond by also moving upwards. A recent survey of some of the Kiribati islands found them to be expanding, rather than sinking.
Latitude – thanks for the link!
Mosh – have a look. I opened the link in a new window so I could put them side by side. If they hadn’t been labeled it would have been very hard to tell which one was which. You can provide all the reasoning you want as to why it isn’t UHI, but look at those two maps side by each and provide a plausible explanation for the correlation other than UHI.
I know, I know, correlation is not causation. But… there still needs to be a plausible explanation.
I don’t understand the significance of 0.4C as a measure of warming. One can produce a gridded color coded map using the GISS temperature data to determine which areas have warmed and how much.
http://data.giss.nasa.gov/cgi-bin/gistemp/do_nmap.py?year_last=2012&month_last=1&sat=4&sst=1&type=anoms&mean_gen=01&year1=1960&year2=2012&base1=1950&base2=1970&radius=250&pol=reg
It shows that a number of regions in the northern hemisphere have warmed between 1C and 4C. Are Scandinavia, Alaska, and Siberia which have a great deal of warming really places of rapid population growth and industrialization compared to other areas of the globe? Why hasn’t the US, Mexico and Southern China, which have had substantial industrialization and population growth seen warming, if urbanization is the reason for warming.
Climate models actually predict that the Southern Hemisphere, which has a larger fraction of ocean area will get warming much later than the northern hemisphere.
It looks like this comes from Phil Jones’ “value added” database (the one where the dog ate the original data). Despite years of trying, there does not appear to be any record of what adjustments were made to the original data. Use at your own risk.
Inspired by the old 20:80 phenomenon, where 20% of X is often responsible
for 80% of Y, I’m wondering what the situation is regarding temperature
stations (TS) and land surface area. Can someone fill in the figures?
90% of TS cover 10% of the land area? Something like that?
To which I might add that all the talk about confidence levels and margins
of error are so much piffle, as they implicitly assume that the TS matrix is
some kind of survey. It’s not. It’s a dog’s breakfast, and no amount of
statistical jiggery-pokery will make it otherwise.
steven mosher says:
March 7, 2012 at 5:26 pm
if it were uhi then uha and rss would not match the land trend as they both do.
Please explain why the land only slopes (red and purple) are steeper than the total slopes (green and blue).
http://www.woodfortrees.org/plot/rss-land/from:1978/trend/offset/plot/rss/from:1978/trend/offset:-0.07/plot/uah/from:1978/trend/plot/uah-land/from:1978/trend/offset:0.09
davidmhoffer says: [re earth lights from space vs Figure 1] “I opened the link in a new window so I could put them side by side.”
I opened two tabs in Opera and expanded both charts to about the same scale. I then use the tabs and CTRL [SHIFT] F6 for a blink comparator. Very, very interesting!! I can even spot the places in Alaska and Hawaii where the red dots occur–right on a lit-up region. Same for most of the rest of the world.
There’s not 100% correlation, but the similarity is striking. I’m wondering if satellite temperatures are read at night. Or if the UbinHAD/CRUD data has corrected for UHI in the wrong direction. Or both. Is a puzzlement.
Eric Adler;
Are Scandinavia, Alaska, and Siberia which have a great deal of warming really places of rapid population growth and industrialization compared to other areas of the globe? Why hasn’t the US, Mexico and Southern China, which have had substantial industrialization and population growth seen warming, if urbanization is the reason for warming. >>>>>>>>
1. Nobody said that UHI was the EXCLUSIVE influence on the temperature trend. This look at the data suggests however that it is a SIGNIFICANT influence on the trend.
2. High latitude regions show a larger temperature fluctuation because P (watts per square meter) varies with T^4 (T*T*T*T). So, it takes a LOT of watts to influence temperature in warmer areas and very FEW watts to influence temperature in cold areas. So, for any given increase in w/m2 on a global basis, not much change in the tropics, and even less to summer highs and even less to day time highs. Much change however to high latitudes, much more to winter lows, and more still to night time lows.
More on Kiribati.
From the Telegraph yesterday:
http://www.telegraph.co.uk/news/worldnews/australiaandthepacific/kiribati/9127576/Entire-nation-of-Kiribati-to-be-relocated-over-rising-sea-level-threat.html
But they obviously don’t read their own back issues (03/06/2010)
http://www.telegraph.co.uk/news/worldnews/australiaandthepacific/tuvalu/7799503/Pacific-islands-growing-not-shrinking-due-to-climate-change.html
Never let facts get in the way of a good headline…
And just look at all that aerosol cooling over asia. The AGW camp is in a bizarre place with their claims of aerosol cooling. Not only does the lack of warming over china tend to indicate that the current claims of aerosol cooling are a crock…the fact that there’s no aerosol cooling means that their explanation of cooling in the 50s, 60s and 70s was also a crock.
Mike Smith, the speed you quote is just 0.6% of the speed of light.
Eastern Europe, Russia, central Asia, India, China, Japan, Middle East, North Africa.
Plus Western Europe and North America. And I’d exclude N Africa, I’d say thats 50/50 warming cooling.
What do these places all have in common? (partially excepting the Middle East)
A large reduction in anthropogenic aerosols since 1960.
The reduced aerosols increase early morning insolation, increasing minimum temperatures, especially in winter, which is where you will find the bulk of the measured warming.
Note, its a common misconception that aerosol pollution has increased in China. In 1960 a billion Chinese used domestic stoves and open hearths for heat and cooking, These are very smoky and now banned in most places in China.
These are all areas of rapid population increase, development and industrialisation.
Eastern Europe, Russia, and Japan have had population decreases and de-industrialisation (of the smoky aerosol polluting kind).
A recent Japanese study (http://johnosullivan.livejournal.com/41060.html) showed that the less industialised countries were emitting more CO2 than industrialised ones.
If this is true and CO2 is a cause of higher temperatures, shouldn’t Africa and South America have more red dots that the Northern hemisphere?
Perhaps the disparity is due to CO2 NOT being a well-mixed gas but it instantaneously migrates from the SH to the NH to cause them to have the red dots.
/sarc
@ Mike Smith. “particles moving at 4,000,000 MPH.” Light speed is generally defined as 186,000 miles Per SECOND. Converted to MPH it comes out as 669,600,000 mph. Unless I’ve lost a,”0″ or two somewhere, I make 4,000,000 mph 0.5973% of light speed. CERN can breathe easy again.
Here we define “hot stations” as those yielding an average anomaly since before 1960 of more than 0.4 degrees C. “Cold stations” are defined as those showing a zero or a negative temperature anomaly since 1960.
————–
Would anyone like to justify the asymmetric temperature range? The only ones I can think of involve cheating.
Verity Jones and myself wrote about this cooling some 18 months ago in an article carried here.
http://wattsupwiththat.com/2010/09/04/in-search-of-cooling-trends/
BEST then confirmed that around one third of stations were cooling. There are many factors at play here including statistical analysis, change of stations, micro climates and uhiand of course genuine changes in the climate.
I would observe that it appears that the warming is taking place in many of those regions that have had industrial developmet and/or have had temperature records for longest . The Russian situation is a whole study in its own right.
Very few records are ‘raw.’ Many of the old temperatures have been thoroughly reappraised, for example I am reading two books at present on early temperature readings by Phil Jones and D Camuffo who received substantial EU funding to look at seven old temperature records dating back to the 1700’s.
They believe that records often show a ‘warm bias’ and as they did not agree with their computer models they revised the observational material downwards. I’m trying to discover how often this happened and whether it has any impact on the stations shown in the excellent graphic created by Clive Best in the article.but its a very specialist area with very few researchers-key amongst them being Phil Jones.
tonyb
So the author biased his study towards cold by his definition what is cold and what is hot:
“Here we define “hot stations” as those yielding an average anomaly since before 1960 of more than 0.4 degrees C. “Cold stations” are defined as those showing a zero or a negative temperature anomaly since 1960.”
I suppose “since before 1960” is a typo and should read “since 1960”.
Anyway, the blue/red dotted map has no value, it is total BS. It would have been interesting to see a map which shows for example those stations with more than 0.2 degree anomaly as a red dot and those stations with more than -0.2 degree cooling as a blue dot. Then the red/blue dots could be compared.
So the map is a hospital with red and blue patients. Are all these patients presently in the hospital? How many patients left the hospital? How many of the latter were red or blue? May I suggest to make a map of all stations that were closed before 1990 and those who survived 1990?
There is also an interesting relationship between the land area and temperature change which matches the pattern in this post and may suggest a solar contribution.
Using the satellite measures of Lower Troposhere Temperature changes and the area of land within 10o latitude bands the relationships are:
1) Mean Satellite Trop0sphere Temperature Trend as a Function of Land Area Centred on 10o Latitude bands (90S to 90N): y = 2.3717x – 0.0361 R2 = 0.4115
2) Mean Satellite Troposphere Temperature Trend as a Function of Land Area Centered on 10o Latitude bands (70S to 70N): y = 2.7006x – 0.0776 R2 = 0.8808
3) Mean Satellite Troposphere Temperature Trend as a Function of Land Area Centered on 10o Latitude bands (60S to 60N): y = 2.493x – 0.0577 R2 = 0.9087
I find it interesting that this map / data shows New Zealand cooling, yet the article just a couple before was about how it was actually flat while the ‘adjusted’ data showed a dramatic warming:
http://wattsupwiththat.com/2012/03/07/the-cold-kiwi-comes-home-to-roost/
So let me get this straight… For a place as small as New Zealand, with a technically competent population and roughly 7 to 11 total locations of recorded data (and them fairly static over time, so not a lot of ‘splice artifacts’ to worry about)… For this nearly IDEAL place and case, we don’t know if it is warming, cooling, or flat?
OK….
If we can’t say what’s really happening in New Zealand, then it’s pretty darned clear that Mongolia and Central Africa are not going to be better…
It looks to me like the thermometer records are junk at this point.
It is possible for the world’s average tempertature to increase by one degree and the world become less hospitable to man. It is possible for the world’s average temperature to increase by two degrees and the world become more hospitable to man. It all depends on where the heating occurs and whether it is a matter of the lows being less low or the highs more high and when.
Throw in the fact that the inhospitality of the Earth’s ‘inhospitable parts’ is not a natural given but is a cultural got. The resources of the Earth are nothing until human resourcefulness and ingenuity sees what they are good for and how to get them. It’s all been said by Julian Simon.
We are in no position to know whether a little warming, whatever the cause, is to be feared or welcomed.
Fact is, that the alleged global warming has not been global at all. Southern pole with surrounding ocean does not warm but slightly cools in last 50 years; big portion of Pacific has not been warming at all (see Bob Tisdale blog). The warming is concentrated in the Northern hemisphere and well correlated with AMO cycle. Average of steady SH and warming NH gives “global warming”, but it is still not global – it is still regional. Since CO2 is distributed evenly and its “radiative forcing” should be the same everywhere, this simple fact invalidates the basic premise of AGW.
“Bolivia, Peru, Paraguay and Argentina all appear to be cooling.”
Since the blue can represent 0°C anomaly you can’t make any such claim from your research. A fairer test would be calculate all stations showing >+0.09°C anomalies in red (I see no good reason fror excluding sations showing between +0.1°C and +0.3°C, if you are reasoning that instumental accuracy renders them invalid then it follows you should also exclude stations showing anomalies between -0.1°C and -0.3°C), all showing <-0.09°C anomalies in blue and ignoring those showing no anomalies or showing them in a neutral colour. But you won't, because if you use all the data, not your cherry pick, you won't get a result you like.
davidmhoffer – its crude, but here you go:
HotCold overlaid on Earthlights
http://goo.gl/7qyP4
IMO if the anomalies are people weighted, then the consensus would be there is Global Warming. Nice that you exposed AGW for basically what it is a Globall social movement and the A in AGW refers to not the cause but the felt effect.
I think the big blue dot over the Big Island of Hawai’i and the big red dot over adjacent Oahu and Maui show the report is not worth a whole lot. The Hawaiian islands are in the middle of a mass of ocean. Each of the main islands is almost uniformly exposed to the trade winds, and the trade winds are nearly constant. That is why there is a very small day and night temp gradient and a small winter/summer as well.
In my personal experience having spent much time there, if anything the westerly most island of Kaua’i would make the most sense for cooling, as it includes one of the wettest places on earth at its center – Mt. Wai’ale’ale with 450 inches of rain average annually (and almost 700 inches in 1982). Hanelei on the North Shore of Kaua’i saw almost 17.5 inches of rain in 24 hours a few days ago.
Interestingly, because of its makeup and topography, along with the trade winds, and trade wind inversion layer, Kaua’i has pretty much all different climate zone on one island about 50 miles across. Tropical monsoons on the North SHore and up onto Mt Wai’ale’ale, to near desert – with approx 20″ of rain annually on the West Shore in Mt. Wai’ale’ale’s shadow. If you visit choose Poipu Beach on the sunny South shore – the best of all worlds..
Whilst I am unsure as to the quality of this article, the thrust of the article is of utmost umportance.
It is viatally important to consider in detail local not global variations.
First because of a practical issue, what effect ‘global’ warming may have on a country is bound up by its local response. If a country is warming and getting wetter, or warming and getting drier, or cooling and getting wetter, or cooling and getting drier, or if there is no significant trend at all, the effect on that country and the response needed to cope with ‘new’ conditions will be different.
Second, it may shed considerable light on the CO2 radiative theory. If CO2 is a well mixed gas, if half (or whatever percentage it is) of the global stations show no warming or even a cooling, why is this? The so called basic physics is clear. Any increase in CO2 levels MUST result in more DWLWIR which MUST increase temperature.Does DWLWIR play a part only at some latitutes/longitudes, if so why? Does more CO2 effect the air circulation patterns?
There is a great deal to be learnt by examining mtters on a local basis and on a max/min basis and on a diurnal basis. The world data that we possess is of questionable quality but it has not been sufficiently analysed to tell us how each country is responding on an average response basis, a min.max response basis, a diurnal basis etc. We would have a much better grasp of what is going on if we were to more thoroughly scrutinise the record.
As I have said numerous times before, it is for political reasons that noone is examing the record at regional basis. The claims that we are all in it together and a global response is required would fall apart, if the record were to be looked at regionally. If the record was examined regionally, there would be a greater prospect that each country would be minded to act on the basis of its own self interests.
Philip Bradley says:
March 7, 2012 at 11:28 pm
//////////////////////////////////////////
I beg to differ. Asia/China etc has had a substantial increase in aerosols.
It was not until the 1970s that the clean air regulations put in place by the developed regions of the West significantly bore fruit.
That said, it may well be the case that if anthropogenic causes have had a bearing on ‘global’ temperatures during the latter part of the 20th century this is due to a reduction in aerosol emissions and not due to an increase in CO2 emissions.
@steven mosher says:
March 7, 2012 at 5:26 pm
“if it were uhi then uha and rss would not match the land trend as they both do.”
His second conclusion was this:
“2) Warming is observed in the Northern Hemisphere since 1950. This is concentrated in regions where rapid development and urbanisation are also occurring. It is therefore probable that some of these “hot stations” are affected by urbanisation warming rather than AGW. ”
After all it is seldom the truth that stuff is either or, so the conclusion is probably probable which he concludes. :p
@E.M.Smith
“It looks to me like the thermometer records are junk at this point.”
you ain’t whistlin’ dixie. !
and that helps makes them very open to manipulation.
Werner Brozek says:
March 7, 2012 at 9:43 pm
“steven mosher says:
March 7, 2012 at 5:26 pm
if it were uhi then uha and rss would not match the land trend as they both do.
Please explain why the land only slopes (red and purple) are steeper than the total slopes (green and blue).”
The heat capacity of the ocean is huge compared to the land. So the land will warm up faster then the ocean as a result of any heat flux imbalance.
http://www.dailymail.co.uk/news/article-2111618/The-new-Atlantis-Entire-Pacific-nation-plans-relocate-rising-sea-level.html
Citing the dire situation, they’ll try to get international financial assistance to make the purchase, grants (free money) preferred, which will be at sweetheart land prices since Fiji won’t want to be seen as (unduly) profiting from Kiribati’s impending catastrophe.
The skilled workers sent will undoubtedly be construction workers, there to build housing for the fleeing masses.
Then on the minuscule chance Kiribati is not destroyed by rising sea levels, Kiribati has prime vacation resort land on Fiji, with buildings already built and waiting for tourists, that they bought dirt cheap, most likely bought with large chunks of free money thus they hardly payed anything at all out of pocket.
Sweet deal if they can swing it. Global warming, the financial gift that keeps on giving, as long as the suckers keep on paying.
davidmhoffer says:
March 7, 2012 at 10:02 pm
‘Eric Adler;
Are Scandinavia, Alaska, and Siberia which have a great deal of warming really places of rapid population growth and industrialization compared to other areas of the globe? Why hasn’t the US, Mexico and Southern China, which have had substantial industrialization and population growth seen warming, if urbanization is the reason for warming. >>>>>>>>
1. Nobody said that UHI was the EXCLUSIVE influence on the temperature trend. This look at the data suggests however that it is a SIGNIFICANT influence on the trend.
2. High latitude regions show a larger temperature fluctuation because P (watts per square meter) varies with T^4 (T*T*T*T). So, it takes a LOT of watts to influence temperature in warmer areas and very FEW watts to influence temperature in cold areas. So, for any given increase in w/m2 on a global basis, not much change in the tropics, and even less to summer highs and even less to day time highs. Much change however to high latitudes, much more to winter lows, and more still to night time lows.”
1. If you look at the GISS temperature map I linked in my post, showing negligible temperature increases in southern china and the US, where there is close to zero warming, compared to the region close to the Arctic circle, one would not conclude that the UHI was a signiicant contibutor in the southern part of the NH. So why would it be significant in the region near the Arctic circle where the warming is much greater.
Also, studies, published in the peer reviewed literature, have shown that elimination of urban stations from the data base, makes a negligible difference in the global temperature average. I don’t understand why this is still regarded as an issue by anyone familiar with the facts.
2. A great deal of the warming in the far north occurs during the winter time. It can’t be due to the solar input, because the sun isn’t in the sky above the Arctic circle in winter. It must be due to suppression of outgoing radiation. Since the north is very sparsely inhabited, such large changes in temperature cannot be due to urbanization. Certainly the loss of sea ice which is a feedback mechanism, is not going to be a result of urban heat Island effects.
REPLY: Ah ignorance is bliss, isn’t it? Love that numbering system. for your #2 #2, everyone of those places where temperature is measured is a pocket of humanity, dependent on energy to stay alive and live during the winter. With the advent of the airplane and the Arctic bush pilot, even small communities have grown in population. Look at Nuuk Greenland for example,
The Wikipedia entry for Nuuk states:
Yeah, with people come energy use:
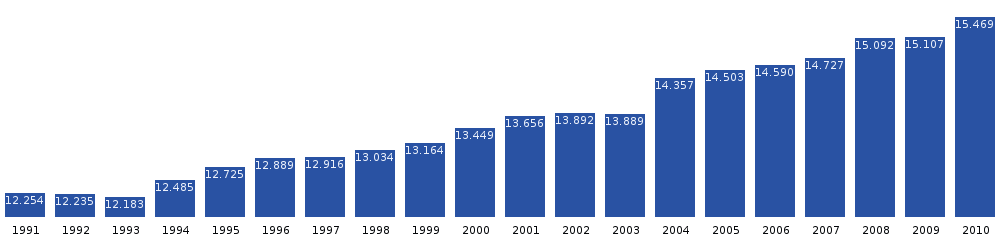

Nuuk population growth dynamics in the last two decades. Source: Statistics Greenland
And yet the boneheads at GISS think it is OK to cool the past there, and rewrite temperature history.
So not only is there a warming trend due to UHI/population growth, GISS dishonestly changes the past via homogenization and increases the temperature trend for Nuuk, and this goes on all through the Arctic. Recently such examples of blatant data dishonesty have been shown in New Zeland with the 7ss series, in Iceland with their data and in Australia where there’s a lawsuit build against BoM for this very reason.
If a stockbroker or investment firm pulled crap like this with performance data they’d be in jail.
Mr. Eadler, you can take and cite all the peer reviewed studies you want until you are blue in the face, but the fact is that data manipulations are going on, and the result is a trend greater than it would be due to lack of properly dealing with UHI issues, sattion issues, and homgenization. It stinks, and you are too weak minded (like many researchers) to care enough to look at what is being done to the base data, you are only interested in the results that fit your per-conceived notions. I’ve tossed you off WUWT before for constant mind-numbing trolling repeating the same things over and over again just like you are doing now. Why should I waste any more time on you, becaue I predict you won’t embrace any of what I’ve just shown you.
-Anthony
****
steven mosher says:
March 7, 2012 at 5:26 pm
if it were uhi then uha and rss would not match the land trend as they both do.
****
Doesn’t GHG theory predict more warming in the upper tropo than at the surface? If so, shouldn’t the surface trend be less than the avg troposphere’s? IIRC, something like 0.8 or so of the tropo’s trend?
Eric Adler says:
March 8, 2012 at 5:28 am
The heat capacity of the ocean is huge compared to the land. So the land will warm up faster then the ocean as a result of any heat flux imbalance.
That makes an excellent argument for just using sea surface temperatures to see what is going on with global temperatures lately. See the graphs below that shows no warming for 15 years and cooling for 10 years.
http://www.woodfortrees.org/plot/hadsst2gl/from:1990/plot/hadsst2gl/from:1997.08/trend/plot/hadsst2gl/from:2002.08/trend
Additionally, I think it has much to do with the Great Dying of the Thermometers. The Russians have asked pointedly why the coolest 40% of their weather stations (mostly in Siberia) have suddenly (since about ’96(?)) been excluded/ignored. No cogent answer has been offered. The remaining warm ones get extrapolated to “cover” the holes, of course. Same thing in northern Canada. And in the Andes. And …
My relatives in Helsinki will dispute that “warming” thing.
I’m comforted to find that my car and I are only heating the NH, where I live.
A big thank you to all who responded to my question.It seems human nature never changes,those that scream the loudest, get the most attention.
Anthony Watts said:
“Mr. Eadler, you can take and cite all the peer reviewed studies you want until you are blue in the face, but the fact is that data manipulations are going on, and the result is a trend greater than it would be due to lack of properly dealing with UHI issues, sattion issues, and homgenization. It stinks, and you are too weak minded (like many researchers) to care enough to look at what is being done to the base data, you are only interested in the results that fit your per-conceived notions. I’ve tossed you off WUWT before for constant mind-numbing trolling repeating the same things over and over again just like you are doing now. Why should I waste any more time on you, becaue I predict you won’t embrace any of what I’ve just shown you.
-Anthony ”
Your case is debatable. An impartial and new study by BEST has validated the land based temperature data results of GISS and HADCRUT.
In fact the latest study of this by BEST study,
http://berkeleyearth.org/pdf/berkeley-earth-uhi.pdf
showed that the UHI effect is not responsible for an increase in the global temperature. You welcomed this study and were enthusiastic about the method, until the results conflicted with your preconceived notions.
I don’t expect you to post this.
REPLY: Oh Why wouldn’t I? While you uncritically accept this without question, I do not. You see it hasn’t been published anywhere where peer review have been done on it. In fact, it seems the BEST publications are having some trouble in peer review. I have not seen any notice that this or any other of those papers they submitted have been accepted. And finally, I have the benefit of knowing many things that you do not, so I’m not the least bit worried about this stuff. Bring it on.
You’ll be eating crow and other unsavory birds soon enough.
– Anthony
Werner Brozek says:
March 8, 2012 at 8:08 am
“Eric Adler says:
March 8, 2012 at 5:28 am
“The heat capacity of the ocean is huge compared to the land. So the land will warm up faster then the ocean as a result of any heat flux imbalance.”
That makes an excellent argument for just using sea surface temperatures to see what is going on with global temperatures lately. See the graphs below that shows no warming for 15 years and cooling for 10 years.”
You cherry picked a short period of time, so that internal variability will obscure a trend.
On the other hand if you look at the 30 year trend the sea surface temperature has an increasing trend of about 0.13C/decade.
When BEST came out, it was trumpeted as confirming GISS etc. temperature reconstructions and the warmists were doing their high fives. The hoopla obscured the fact that about one third of the records showed a cooling trend. Excuse me, but does this not ring alarm bells in the minds of climate researchers? To me, it means that until you explain the “divergence” in the various station records, the any finding from BEST that the global average temperature has increased tells us nothing about climate change.
Eric Adler says:
March 8, 2012 at 5:54 pm
See the graphs below that shows no warming for 15 years and cooling for 10 years.”
You cherry picked a short period of time, so that internal variability will obscure a trend.
On the other hand if you look at the 30 year trend the sea surface temperature has an increasing trend of about 0.13C/decade.
I would not call 15 years short. Did not Santer say 17 years was all that was needed? But why stop at 30 years? That 15 year period perfectly explains the 60 year cycle in the following that goes back 130 years:
http://wattsupwiththat.files.wordpress.com/2009/03/akasofu_ipcc.jpg
Robert Austin says:
March 8, 2012 at 6:13 pm
“When BEST came out, it was trumpeted as confirming GISS etc. temperature reconstructions and the warmists were doing their high fives. The hoopla obscured the fact that about one third of the records showed a cooling trend. Excuse me, but does this not ring alarm bells in the minds of climate researchers? To me, it means that until you explain the “divergence” in the various station records, the any finding from BEST that the global average temperature has increased tells us nothing about climate change.”
If you look at the graph of statistics of trends in the BEST paper in figure 3 on page 8,
http://berkeleyearth.org/pdf/berkeley-earth-uhi.pdf
you will see a bell curve with a dispersion that is large. The range of the data is -15 to +15C per century. Because of the large number of stations used the the global average trend is 0.98+/- 0.04C, so the uncertainty in trend is very small despite the range. Global averages are real, but not the whole story as you say, but the evidence of a trend is quite solid.
Werner Brozek says:
March 8, 2012 at 7:47 pm
“I would not call 15 years short. Did not Santer say 17 years was all that was needed? But why stop at 30 years? That 15 year period perfectly explains the 60 year cycle in the following that goes back 130 years:
http://wattsupwiththat.files.wordpress.com/2009/03/akasofu_ipcc.jpg ”
The 60 year cycle is a curve fitting exercise with no physical basis presented as justification. Recovery from the little ice age is an empty meme.
Physical mechanisms, not curve fitting are the proper way to understand the science behind climate change. Measurements of the driving forces underlying climate, and an understanding of the physical equations which dictate the evolution of the parameters of climate, including the sources of internal variation of surface temperature, have been increasingly successful at explaining the recent evolution of climate observed in modern times. In recent studies have shown that pauses in the increase of surface temperatures are associated with the transfer of heat into the deep part of the oceans during La Nina cycles.
https://www2.ucar.edu/atmosnews/news/5364/deep-oceans-can-mask-global-warming-decade-long-periods
Philip Bradley says:
March 7, 2012 at 11:28 pm
//////////////////////////////////////////
I beg to differ. Asia/China etc has had a substantial increase in aerosols.
I was referring specifically to China, but care to present some evidence for that claim.
One of those hotspots is Perth and I happen to know that when the Perth station was relocated from a position opposite an irrigated park to a non-irrigated field the nighttime temperatures went up by 1.5C.
The urban irrigation effect – spray water into the air and you greatly increase its thermal capacity and temperatures drop.
The UHI enthusiasts don’t take into consideration the urbanisation of hot dry places.
And as for Mosh, I’m still waiting for an explanation of how BEST isn’t derived from min/max temps.
Mr.D.Imwit says @ March 7, 2012 at 6:07 pm
Is this true or B.S.
http://www.dailymail.co.uk/news/article-2111618/The-new-Atlantis-Entire-Pacific-nation-plans-relocate-rising-sea-level.html.
Enlightenment would be appreciated…
________________________________________
You might want to look at:
http://wattsupwiththat.com/2010/01/27/floating-islands/
http://wattsupwiththat.com/2011/12/28/the-fishes-and-the-coral-live-happily-in-the-co2-bubble-plume/
http://wattsupwiththat.com/2011/10/25/the-reef-abides/
http://wattsupwiththat.com/2011/12/26/sea-cucumbers-dissolving-coral-reefs/
Reefs can be disrupted but it is usually from humans hands on messing it up. Selling coral to tourists, coral that is harvested by dynamiting, killing of fish…
From Willis Eschenbach in Floating Islands:
“…..What goes unremarked is the loss of the reef sand, which is essential for the continued existence of the atoll. The major cause for the loss of sand is the indiscriminate, wholesale killing of parrotfish and other beaked reef-grazing fish. A single parrotfish, for example, creates around a hundred kilos of coral sand per year. Parrotfish and other beaked reef fish create the sand by grinding up the coral with their massive jaws, digesting the food, and excreting the ground coral.
Beaked grazing fish are vital for overall coral health, growth, and production. This happens in the same way that pruning makes a tree send up lots of new shoots. The constant grazing by the beaked fish keeps the corals in full production mode. This greatly increases the annual production of coral for sand and rubble……” http://wattsupwiththat.com/2010/01/27/floating-islands/
From Eric Adler on March 9, 2012 at 4:10 am:
The BEST papers were made for peer review and publication, trumpeted on their release as soon to be published, and have not yet cleared peer review nor been officially published in a peer-reviewed journal. Thus they haven’t even passed the standards the BEST team themselves set for those papers to be cited authoritatively. Thus functionally they don’t even exist. Thus they shouldn’t be cited as proof of anything, except perhaps mistakes and other errors that should be corrected before publication.
From Eric Adler on March 9, 2012 at 4:46 am:
The physical basis of the 60 year cycle is the Pacific Decadal Oscillation, a real and measured phenomenon. There’s a noted pattern of warm periods, notably the Minoan, Roman, Medieval, and Modern ones, with periods of colder temperatures between them as with the Little Ice Age being between the Medieval and Modern Warm Periods. Temperatures go down, they return to the high periods. There is nothing “empty” in referring to a recovery from the Little Ice Age.
You have trouble accepting obvious reality. Perhaps you should seek psychiatric help.
Eric Adler says:
March 9, 2012 at 4:46 am
Your site talked about masking for “decade-long periods”. According to RSS, Hadcrut3 and hadsst2, it has been one and a half decades already and counting. For RSS for example, the January and February anomalies would rank these first two months as 26th warmest. You may have heard about the recent book in German: “The cold sun”. Before we spend too much money, do you no think it would be wise to see if we are in for a continued cold spell?
kadaka (KD Knoebel) says:
March 9, 2012 at 7:52 am
“The BEST papers were made for peer review and publication, trumpeted on their release as soon to be published, and have not yet cleared peer review nor been officially published in a peer-reviewed journal. Thus they haven’t even passed the standards the BEST team themselves set for those papers to be cited authoritatively. Thus functionally they don’t even exist. Thus they shouldn’t be cited as proof of anything, except perhaps mistakes and other errors that should be corrected before publication.”
By that standard, I should ignore a large majority of the blogposts on this web site, including the one we are commenting on now. Do you agree?
“The physical basis of the 60 year cycle is the Pacific Decadal Oscillation, a real and measured phenomenon. There’s a noted pattern of warm periods, notably the Minoan, Roman, Medieval, and Modern ones, with periods of colder temperatures between them as with the Little Ice Age being between the Medieval and Modern Warm Periods. Temperatures go down, they return to the high periods. There is nothing “empty” in referring to a recovery from the Little Ice Age.”
There is no evidence that the PDO is 60 year cycle. The data is quite irregular and only 90 years worth of data exists.
http://www.nwfsc.noaa.gov/research/divisions/fed/oeip/ca-pdo.cfm
“You have trouble accepting obvious reality. Perhaps you should seek psychiatric help.”
Insulting posts are a sign of a weak argument.
Werner Brozek says:
March 9, 2012 at 9:30 am
“Eric Adler says:
March 9, 2012 at 4:46 am
Your site talked about masking for “decade-long periods”. According to RSS, Hadcrut3 and hadsst2, it has been one and a half decades already and counting. For RSS for example, the January and February anomalies would rank these first two months as 26th warmest. You may have heard about the recent book in German: “The cold sun”. Before we spend too much money, do you no think it would be wise to see if we are in for a continued cold spell?”
I haven’t heard about the recent book. It is true that the last 15 years have been very noisy. Part of the noise is solar cycles, and part of it is El Nino/ La Nina . Despite this there is a positive trend to the last 15 years, but clearly less than 95% significant.
http://www.woodfortrees.org/plot/hadcrut3vgl/from:1996/to:2012/plot/hadcrut3vgl/from:1996/to:2012/trend/plot/none
The GISSTEMP plot will show a significant trend over the past 15 years, while HADCRUT Doesn’t because it doesn’t fill in the Arctic region, where the greatest warming trend occurs.
http://www.woodfortrees.org/plot/gistemp-dts/from:1996/to:2012/plot/gistemp-dts/from:1996/to:2012/trend
I googled “Cold Sun” and found the book. Based on the quotes and statements, it seems to me like quackery to me.
From Eric Adler on March 9, 2012 at 4:26 pm:
Your lack of reading comprehension is noted. You even quoted the relevant qualifications of my comment in your reply:
“The BEST papers were made for peer review and publication, trumpeted on their release as soon to be published, and have not yet cleared peer review nor been officially published in a peer-reviewed journal. Thus they haven’t even passed the standards the BEST team themselves set for those papers to be cited authoritatively.”
Said blog posts are not made for peer review and publication in a peer-reviewed journal, thus they are not judged by that standard. They are made for publishing on the internet, and as seen on skeptic sites such as WUWT the peer review occurs after publishing. The results of the crowdsourced peer review determine the suitability for citing authoritatively.
And because there are only 90 years of data, the following site can display 111 years of data with a PDO graph currently showing 1900 to 2011, with links to PDO reconstructions from 1856 to 1991.
http://jisao.washington.edu/pdo/
This information and site is found by clicking on “Pacific Decadal Oscillation” at the very start of the very first sentence at the link you provided. Indeed, that sentence is:
The Pacific Decadal Oscillation is a climate index based upon patterns of variation in sea surface temperature of the North Pacific from 1900 to the present (Mantua et al. 1997).
There it is, from the link you provided. From “1900 to the present” you have deduced there only exists 90 years of data?
The PDO is not a fully independent phenomenon, there are other confounding factors, the determining of the exact stages of the index is problematic. Yet “60 years” is a good approximation of the cycle. Try reading this for information as to how it correlates with many other things.
You have clearly shown difficulties with comprehension. You have shown you didn’t understand the first sentence of a source you linked to. Modern psychiatry also diagnoses and treats functional issues such as reading comprehension problems. My point and my suggestion stands.
Eric Adler says:
March 9, 2012 at 6:59 pm
“The GISSTEMP plot will show a significant trend over the past 15 years, while HADCRUT Doesn’t because it doesn’t fill in the Arctic region, where the greatest warming trend occurs.”
The GISSTEMP is no longer a observation based data set any more (so I don’t use it), it makes up data in the same regions where there is none all the time other than DMI. But, it doesn’t even use DMI because this also doesn’t show the warming that only GISSTEMP does. Regurlarly changing station history to show steeper trends and making up data in regions where there is none ever, has ruined this data set to become no better, than trash. Finally for such a small region to cause those temperatures increases globally, requires a lot of warming over the entire area that no observed data stations or data points including buoys DMI uses, reflect.
Eric Adler says:
March 9, 2012 at 6:59 pm
From 1996 to date is 16 years and not 15. For exact times see the following:
Following is the longest period of time (above10 years) where each of the data sets is at least slightly negative (or flat for all practical purposes). NOTE: * There are no February values yet for 2, 5 and 6. Once these are in, I expect AT LEAST one month to be added to each of the times below.
1. RSS: since December 1996 or 15 years, 3 months
2. HadCrut3: since March 1997 or 14 years, 11 months*
3. GISS: since May 2001 or 10 years, 10 months
4. UAH: It never quite reaches a negative value but I expect it to with the March numbers.
5. Combination of the above 4: December 2000 or 11 years, 2 months*
6. Sea surface temperatures: February 1997 or 15 years, 0 months*
See the graph below to show it all.
http://www.woodfortrees.org/plot/hadcrut3gl/from:1997.16/trend/plot/gistemp/from:2001.33/trend/plot/rss/from:1996.9/trend/plot/wti/from:2000.91/trend/plot/hadsst2gl/from:1997.08/trend
Matt G says:
March 10, 2012 at 5:59 am
Finally for such a small region to cause those temperatures increases globally, requires a lot of warming over the entire area that no observed data stations or data points including buoys DMI uses, reflect.
That is very true!
Is GISS more accurate?
I have read that GISS is the only record that is accurate since it adequately considers what happens in the polar regions, unlike other data sets. I have done some “back of the envelope calculations” to see if this is a valid assumption. I challenge any GISS supporter to challenge my assumptions and/or calculations and show that I am way out to lunch. If you cannot do this, I will assume it is the GISS calculations that are out to lunch.
Here are my assumptions and/or calculations: (I will generally work to 2 significant digits.)
1. The surface area of Earth is 5.1 x 10^8 km squared.
2. The RSS data is only good to 82.5 degrees.
3. It is almost exclusively the northern Arctic that is presumably way warmer and not Antarctica. For example, we always read about the northern ice melting and not what the southern areas are gaining in ice.
4. The circumference of Earth is 40,000 km.
5. I will assume the area between 82.5 degrees and 90 degrees can be assumed to be a flat circle so spherical trigonometry is not needed.
6. The area of a circle is pi r squared.
7. The distance between 82.5 degrees and 90.0 degrees is 40,000 x 7.5/360 = 830 km
8. The area in the north polar region above 82.5 degrees is 2.2 x 10^6 km squared.
9. The ratio of the area between the whole earth and the north polar region above 82.5 degrees is 5.1 x 10^8 km squared/2.2 x 10^6 km squared = 230.
10. People wondered if the satellite record for 2010 would be higher than for 1998. Let us compare these two between RSS and GISS.
11. According to GISS, the difference in anomaly was 0.05 degrees C higher for 2010 versus 1998.
12. According to RSS, it was 0.074 degrees C higher for 1998 versus 2010.
13. The net difference between 1998 and 2010 between RSS and GISS is 0.124 degrees C.
14. If we are to assume the only difference between these is due to GISS accurately accounting for what happens above 82.5 degrees, then this area had to be 230 x 0.124 = 28.5 degrees warmer in 2010 than 1998.
15. If we assume the site at http://ocean.dmi.dk/arctic/meant80n.uk.php can be trusted for temperatures above 80 degrees north, we see very little difference between 1998 and 2010. The 2010 seems slightly warmer, but nothing remotely close to 25 degrees warmer as an average for the whole year.
Readers may disagree with some assumptions I used, but whatever issue anyone may have, does it affect the final conclusion about the lack of superiority of GISS data to any real extent?
Werner Brozek says:
March 10, 2012 at 8:15 am
Good post, is does reflect what I have found out before.
The graph below shows the divergence difference between GISSTEMP and RSS using the 1981-2010 baseline.
http://img854.imageshack.us/img854/7658/gissvrss19812010.png
The following graph shows the temperature needed above 82.5N to justify the difference between GISSTEMP and RSS, supporting that the only difference is the extra Arctic data.
http://img829.imageshack.us/img829/5412/gissvrssextarc.png
The temperature needed to warm above this mean (1981-2010) on occasions to support this claim, need to be above 100c. Therefore this data backs up the evidence that the extra Arctic data causing the difference in trends is false. Either the Arctic above 82.5N needs to be extremely hot (shown above) or combination between the rest of the planet and still ridicously warm values above 82.5N are needed to support the warming from GISSTEMP. This supports that the extrapolations are making up hot temperatures that don’t exist on the planet Earth, neither the station data furthest north or DMI come even close.
Where is the beef from Arctic data observations?
http://www.uni-koeln.de/math-nat-fak/geomet/meteo/winfos/synNNWWarctis.gif
Forgot to mention that the difference in divergence between GISSTEMP and RSS is increasing generally during the timeline shown. (1998-2012)
Thank you Matt. Some may argue that RSS and GISS measure different things. However Hadcrut3 and RSS seem very much alike in many ways. I know that some people are expecting Hadcrut4 and BEST to overturn some things, at least with respect to 1998 versus 2010. I just cannot believe that everything that may have been missed with Hadcrut3 was much warmer on the average. We may have to keep our pencils sharp when they finally come out!