Over at NASA, they have a press release about old Arctic sea ice disappearing since 1980, including a helpful comparison widget that splits the before and after for comparison. I’ll run it in full below followed by comments.
NASA Finds Thickest Parts of Arctic Ice Cap Melting Faster

GREENBELT, Md. — A new NASA study revealed that the oldest and thickest Arctic sea ice is disappearing at a faster rate than the younger and thinner ice at the edges of the Arctic Ocean’s floating ice cap.
The thicker ice, known as multi-year ice, survives through the cyclical summer melt season, when young ice that has formed over winter just as quickly melts again. The rapid disappearance of older ice makes Arctic sea ice even more vulnerable to further decline in the summer, said Joey Comiso, senior scientist at NASA Goddard Space Flight Center, Greenbelt, Md., and author of the study, which was recently published in Journal of Climate.
The new research takes a closer look at how multi-year ice, ice that has made it through at least two summers, has diminished with each passing winter over the last three decades. Multi-year ice “extent” – which includes all areas of the Arctic Ocean where multi-year ice covers at least 15 percent of the ocean surface – is diminishing at a rate of -15.1 percent per decade, the study found.
There’s another measurement that allows researchers to analyze how the ice cap evolves: multi-year ice “area,” which discards areas of open water among ice floes and focuses exclusively on the regions of the Arctic Ocean that are completely covered by multi-year ice. Sea ice area is always smaller than sea ice extent, and it gives scientists the information needed to estimate the total volume of ice in the Arctic Ocean. Comiso found that multi-year ice area is shrinking even faster than multi-year ice extent, by -17.2 percent per decade.
“The average thickness of the Arctic sea ice cover is declining because it is rapidly losing its thick component, the multi-year ice. At the same time, the surface temperature in the Arctic is going up, which results in a shorter ice-forming season,” Comiso said. “It would take a persistent cold spell for most multi-year sea ice and other ice types to grow thick enough in the winter to survive the summer melt season and reverse the trend.”
Scientists differentiate multi-year ice from both seasonal ice, which comes and goes each year, and “perennial” ice, defined as all ice that has survived at least one summer. In other words: all multi-year ice is perennial ice, but not all perennial ice is multi-year ice (it can also be second-year ice).
Comiso found that perennial ice extent is shrinking at a rate of -12.2 percent per decade, while its area is declining at a rate of -13.5 percent per decade. These numbers indicate that the thickest ice, multiyear-ice, is declining faster than the other perennial ice that surrounds it.
As perennial ice retreated in the last three decades, it opened up new areas of the Arctic Ocean that could then be covered by seasonal ice in the winter. A larger volume of younger ice meant that a larger portion of it made it through the summer and was available to form second-year ice. This is likely the reason why the perennial ice cover, which includes second year ice, is not declining as rapidly as the multiyear ice cover, Comiso said.
=========================================================
One of the most often complained about things from icy fanatical folks like Tamino (aka Grant Foster) and Neven Acropolis on their blogs is “cherry picking”.
Generally, cherry picking claims are applied when you pick a section out of datasets, and use that short section to draw a conclusion. For example, over at Steve Goddard’s blog he has nice multi-year sea ice plot from NSIDC where he’s suggesting the short term gain in 2 and 3 year old multi-year ice is significant against the larger down trend.

The ongoing loss of 4 and 5 year old ice would tend to confirm the premise of the NASA article.
But I want to expand the scope a bit. For the first time in history, starting about 1980 with the advent of satellite remote sensing, we have geophysical data we’ve never had before. The trouble is, that 30+ year period from 1980-2012 is just barely over a 30 year climate normals period. We don’t know what sea ice extent and age trends were before that, as there really aren’t any good data on the Arctic ice pack prior to 1980.
For example if you visit the Wikipedia page Polar Ice Packs, you won’t find anything about historical sea ice data prior to that, but plenty about recent declines. They do though have a century scale model from 1950 to 2050 that posits a loss of thickness.

I’m not sure where they got that high resolution data for 1955, since we didn’t have any satellites then (Sputnik launched in 1957 and had no remote sensing capability, only a radio beacon beeper so you could track it) and we didn’t have under the ice submarines (to measure ice thickness) then either as the USS Nautilus (SSN-571) was the first vessel to complete a submerged transit beneath the North Pole on August 3, 1958.
Even the USS Skate (SSN-578) didn’t surface at the North Pole through the ice until 1959. Here’s that photo again that drives Tamino and Neven crazy when they see it because it shows open water in the Arctic in 1958:

From John Daly: (added)
For example, one crew member aboard the USS Skate which surfaced at the North Pole in 1959 and numerous other locations during Arctic cruises in 1958 and 1959 said:
“the Skate found open water both in the summer and following winter. We surfaced near the North Pole in the winter through thin ice less than 2 feet thick. The ice moves from Alaska to Iceland and the wind and tides causes open water as the ice breaks up. The Ice at the polar ice cap is an average of 6-8 feet thick, but with the wind and tides the ice will crack and open into large polynyas (areas of open water), these areas will refreeze over with thin ice. We had sonar equipment that would find these open or thin areas to come up through, thus limiting any damage to the submarine. The ice would also close in and cover these areas crushing together making large ice ridges both above and below the water. We came up through a very large opening in 1958 that was 1/2 mile long and 200 yards wide. The wind came up and closed the opening within 2 hours. On both trips we were able to find open water. We were not able to surface through ice thicker than 3 feet.”
– Hester, James E., Personal email communication, December 2000
More here
So where does NOAA get 1955 high resolution data on Arctic sea ice thickness? One wonders. Wikipedia cites the source as http://www.gfdl.noaa.gov/visualization-gallery but when you go there, there’s no record of the plot. Even when you go to the page at GFDL for the graphics used in IPCC’s AR4, you don’t find this visualization anywhere, nor do they have any data prior to 1980 to visualize with.
In fact it seems the Wikipedia source page is the only place that 1955-2055 visualization exists anymore. Perhaps it has been deep-sixed at NOAA after somebody pointed out the folly of it like I did with another visualization blunder from the same group.

Back to the main point.
You can plot, model, and visualize all you want, but there’s just no good sea ice thickness nor extent data prior to 1980 when satellite remote sensing came on the scene, yet we do have anecdotal evidence of previous Arctic ice retreats. For example, this now famous report from 1922 that first appeared in the Washington Post.

Sailing all the way to 81° 29 minutes North. That sure beats the Catlin expeditions and the recent Row to the Pole (which never actually made it to a pole of any kind).
In fact, so little ice has never before been noted.
But do we have any Arctic wide data for 1922? No. We also don’t have any Arctic wide data for the Little Ice Age (LIA), The Medieval Warm Period (MWP), Dark Ages Cold Period (DACP) and the Roman Warm Period (RWP). We do however have temperature reconstructions from Ljungqvist (2010) like the one below:

“probably represent the much discussed quasi-cyclical c. 1470 ± 500-year Bond Cycles (Bond and Lotti, 1995; O’Brien et al., 1995; Bond et al., 1997, 2001; Oppo, 1997),” which “affected both Scandinavia and northwest North America synchronically (Denton and Karlen, 1973)” and have “subsequently also been observed in China (Hong et al., 2009a,b), the mid-latitude North Pacific (Isono et al., 2009) and in North America (Viau et al., 2006), and have been shown to very likely have affected the whole Northern Hemisphere during the Holocene (Butikofer, 2007; Wanner et al., 2008; Wanner and Butikofer, 2008), or even been global (Mayewski et al., 2004).”
Now it could be argued strongly that since we are in the Current Warm Period (CWP) and Arctic Sea Ice is on the decline, and the rise of the machines in the industrial age coincides with that, that man has the greatest influence on Arctic Sea Ice. That may be, but we just don’t know. We have no good ice data prior to 1980. We do however have suggestions that much of Earth’s climate and responses to it (like Arctic sea ice) is cyclic.
And with only just over 30 years of good sea ice data, how does one determine if this downturn isn’t just part of a regular cycle? For all we know, we may be simply looking at one part of a larger cycle. In fact, a recent peer reviewed paper says “there appear to have been periods of ice free summers in the central Arctic Ocean” in the early Holocene, about 10-11,000 years ago
In that larger context, using 30 years of Arctic sea ice data to draw conclusions and model out to 2050 might very well be viewed as an exercise in cherry picking.
Suggestions by NASA in 2007, in Smedsrud Et Al 2011 and recently in Wang, Song, and Curry suggest that wind patterns are a big factor in the Arctic puzzle. There’s also direct evidence that soot from the industrialization of Asia is collecting in the Arctic and could be a factor in albedo changes in the Arctic which contribute to ice loss.
Sea ice is a complex problem, and my personal view is that we simply don’t know enough about its behavior in the larger context to demonstrate a causal relationship with the recent global temperature increases.
And speaking of global, then there’s that pesky Antarctic, which has an upward trend in sea ice area:
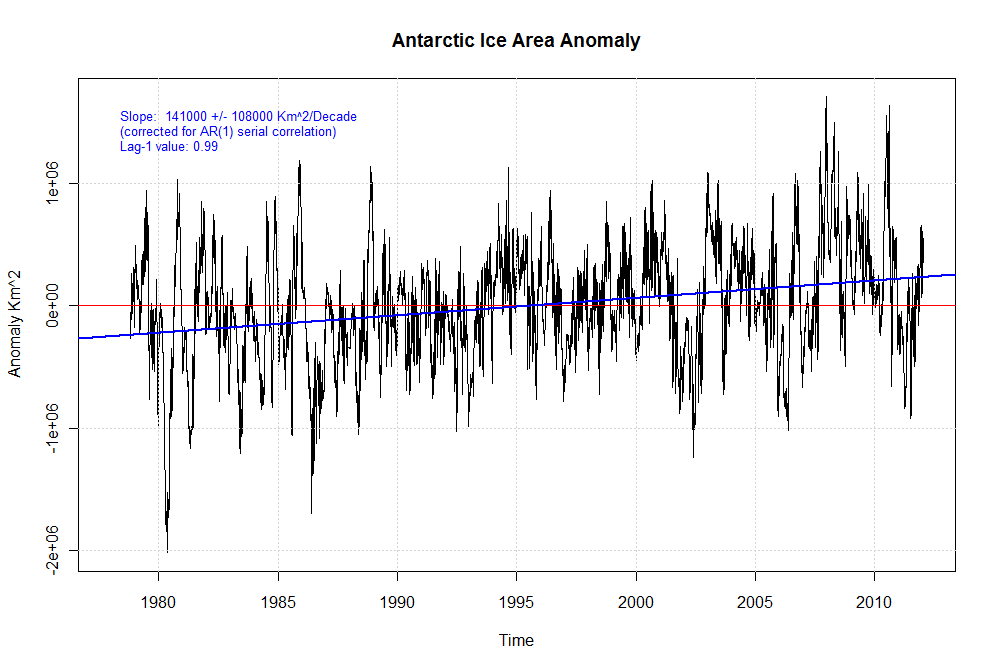
Image from Jeff Condon via his Air Vent blog.
And then of course, unless you believe Steig’s (2009) application of Mannian statistical madness, there’s no evidence that Antarctica has any statistically significant temperature trend. That claim has been disproved by O’Donnell et al 2010.
Global sea ice hasn’t varied all that much in 30 years, and I for one, am just not all that worried about it. Especially since the Great Pacific Climate Shift occurred right about the start of the satellite data, and you all know what our friends tell us about starting conditions.

Image above from this excellent essay on The Air Vent
You can track sea ice in the NH and SH on WUWT’s sea ice page.
Just recently i have been looking through the NSIDC website , it is very interesting and they explain ice melt and increase and tie it into natural weather conditions,
eg- The past two Arctic winters were dominated by a negative phase of the Arctic Oscillation, a large-scale weather pattern that brings generally warm conditions to the Arctic and colder conditions to Europe and North America.
their press releases etc are a different matter, there they push the agw line but worded carefully,
Who first coined the phrase “determining a trend from just one data point?” Essentially, that’s what we have here, just a small amount of data that’s being extrapolated out over a period of time, as if the short-term trend is going to continue forever. The timeline for the data is just too short.
There’s no historical context, either, as the rest of the post indicates.
Finally, evidence of global warming does not prove it’s anthropegenic.
I continue to be haunted by the recollection of an item I ran across about a decade ago:
In diaries of Marco Polo, there is a statement that he sailed to a location where he observed the Pole Star in the South. That means he was on a line between true north and magnetic north, since he was using lodestone compass. That, in turn means he had sailed the Arctic Ocean from Japan nearly all the way to Greenland.
It sounds to me like Marco did not encounter a whole lot of ice, if any at all.
So does this mean the polar bears will start eating all the penguins if the ice keeps melting?
…also, anybody ever charted volcanic eruptions and ice thickness to see if there is any correlation…and perhaps even some causation? Since 1980 the have been some big ones in the tropics, but nothing like Krakatoa. St Helens is getting closer, but Iceland and Alaska are belching pretty regularly and they divert airplanes to avoid the ash…I am just wondering
Cousin’s husband was a young torpedoman on the Skate when they did that…
there was a LOT of open water…
Thanks for the reference to peer review paper about Arctic being ice-free during the summer 10,000 years ago. That would come handy when discussing with others about ancient Egypt civilization at that time (Atlantis?) when Pyramids, Sphinx, etc may have been built much earlier than widely believed.
This will be easy to prove as 50% of the ice in 2011 will be gone by 2015. I am not a believer.
Whoops. 2041. Mis-read. Just when I thought they had stopped with their 30 year projections (one career long)! Sorry.
I’ve posted this video from Ignatius Rigor a number of times
It is an expansion on the ideas developed in this paper
The red dots shows the current location of buoys used to estimate the age of sea ice. The areas of older, thicker ice are shown in white, while younger, thinner sea ice is shown as darker shades of blue.
This animation of the age of sea ice shows:
1.) A large Beaufort Gyre which covers most of the Arctic Ocean during the 1980s, and a transpolar drift stream shifted towards the Eurasian Arctic. Older, thicker sea ice (white ice) covers about 80% of the Arctic Ocean up to 1988. The date is shown in the upper left corner.
2.) With the step to high-AO conditions in 1989, the Beaufort Gyre shrinks and is confined to the corner between Alaska and Canada. The Transpolar Drift Stream now sweeps across most of the Arctic Ocean, carrying most of the older, thicker sea ice out of the Arctic Ocean through Fram Strait (lower right). By 1990, only about 30% of the Arctic Ocean is covered by older thicker sea ice.
3.) During the high-AO years that follow (1991 and on), this younger thinner sea ice is shown to recirculated back to the Alaskan coast where extensive open water has been observed during summer.
The age of sea ice drifting towards the coast explains over 50% of the variance in summer sea ice extent (compared to less than 15% of the variance explained by the seasonal redistribution of sea ice, and advection of heat by summer winds).
If you concentrate on the change in the drift paths of the buoys the paradigm shift in the surface circulation patterns that Rigor and Wallace refer to is very apparent
In terms of ice coverage that reduces heat transfer between water and air, does it make much difference whether the baby ice is one foot thick or the great-grandpa ice is ten feet thick?
Oops I double posted the video rather than linking this paper
http://iabp.apl.washington.edu/research_seaiceageextent.html
So we have annual ice, biennial ice and perennial ice. Can we grow any of these in an ordinary garden? Or a CO2-enriched greenhouse?
But Oh, the wonders of drawing straight lines on graph paper.
There always seems to be a little bit of truth in the alarmists’ pronouncements. Is not black soot a major influence upon Arctic ice melt? Also subterranean vocalic activities are a known factor? Has NASA quantified and factored these and other similar causes of ice melt into heir models? I doubt it.
It would be interesting to see if there is a connection to the opening of the Russian Northern Sea Route in the 1930s.
You cover it very well. 30 years is a painfully short time in geologic time.
NOAA is a shady bunch. Anyone know their real mission?
I can’t help wondering whether they got their 1955 volume by calculating the observed trend in ice volume between 1979 and the present, plugging it into their model, and back-projecting on the assumption that the observed trend remained unchanged between 1955 and 1979.
Sound about right?
That NASA graphic that Anthony reproduces to lead the article is very misleading.
It shows different halves of the NH for each of the two years being compared. The half it shows for the “high ice” 1980s is the half that has the overwhelming majority of the ice in all years. The half they are showing for the “OMG Global Warming” present is the half that has very little sea ice in any year, as it has very little sea. Apples to oranges.
Not that there hasn’t been a reduction in prerennial sea ice, but that is a very misleading graphic that doesn’t show the true extent of the issue.
Why does NASA do things like this.
@More Soylent Green!
To your point Mr Green…
The fun one can have with data points, charts and historical stock and mutual fund performance…
In most cases it is illegal as well as being very unethical. But it does get done at times. Usually in an attempt to DUPE people…and get them to believe in what you are saying…so they give you their hard earned money…just ask Bernie Madoff…
So…is it ironic…Madoff is pronounced Made off…as in somebody made off with our money… Al Gore has told us all a fancy allegory, which in turn fueled the money machine that has Made Off with all our money…but Al is smarter than Bernie, because VP Al avoids the SEC via the UK…OKAY
But that is for the $ thread…this thread is about playing games with charts and graphs…
Maybe the Climate Guys can include in their charts and graphs certain disclaimers such as…
“Past performance is no guarantee of future results.”
Caveat emptor…modern translation: Be skeptical
In regard to my comment above, I have been following the daily Arctic sea ice drift maps for some time and it appears to me that the surface circulation patterns established in the late 80s are changing again in the last couple years, although they don’t seem to have stabilized into new paradigm as yet. The drifts do seem to be slowing the flows out through the Fram, which might partially explain the short term increases in the sea ice age that Goddard noted
Sadly I have reached the point now where if anyone of Hansen’s goons were to present me with something that looked like a duck and quacked like a duck, I would reckon it could only be a rat in a duck suit.
“The ongoing loss of 4 and 5 year old ice would tend to confirm the premise of the NASA article.”
Actually, if you look at that chart, we should be due for a significant increase in 4yo ice next year. That is to be expected. If you look at the 3yo ice from 2010 to 2011, there was a significant increase. That should translate to an increase in 4yo ice in 2012 and in 5yo ice in 2013. I think overall we are in good shape. 2008 + 5 years = 2013 so we can’t start recovering the 5yo+ ice until 5 years after the first ice season after the 2007 anomaly. So 5+ ice can not possibly start to recover until 2013 because ice formed in 2008 won’t be 5yo until then.
Barrow Sea Ice Day 61 – Mar 01, 2012, 08:30 AM AKST:
Air temperature:
-36 °C, -32 °F
Ice thickness:
1.37 m, 4 ft 5.5″
1.37m not met until Day 90 in 2011
http://seaice.alaska.edu/gi/observatories/barrow_sealevel
The USS Skate picture you show was taken in 1958 (not at north pole).
REPLY: Yes I have the date year wrong, fixed thanks, Wikipedia suggests the photo is at the North Pole:
http://en.wikipedia.org/wiki/File:USS_Skate_at_North_Pole_-_0857806.jpg
This may be of interest from John Daly:
For example, one crew member aboard the USS Skate which surfaced at the North Pole in 1959 and numerous other locations during Arctic cruises in 1958 and 1959 said:
“the Skate found open water both in the summer and following winter. We surfaced near the North Pole in the winter through thin ice less than 2 feet thick. The ice moves from Alaska to Iceland and the wind and tides causes open water as the ice breaks up. The Ice at the polar ice cap is an average of 6-8 feet thick, but with the wind and tides the ice will crack and open into large polynyas (areas of open water), these areas will refreeze over with thin ice. We had sonar equipment that would find these open or thin areas to come up through, thus limiting any damage to the submarine. The ice would also close in and cover these areas crushing together making large ice ridges both above and below the water. We came up through a very large opening in 1958 that was 1/2 mile long and 200 yards wide. The wind came up and closed the opening within 2 hours. On both trips we were able to find open water. We were not able to surface through ice thicker than 3 feet.”
– Hester, James E., Personal email communication, December 2000
This is sorry, even you’ve consumed some of the koolaide:
“30 year climate normals period”
As anyone on the “waste” coast knows: the minimum climate cycle is the PDO: 60 years,
and then there is the AMO.
Since no one can predict solar activity for even this maximum, much less SC25 or SC26, anyone who is truly honest, would have to use, at least, one solar micro cycle of 177 years as the
“time for a climate normalization”.
I have to view anything else as bluster, and as the expression goes,
should you want to use short term results, then “gleick you”.
lets see if I get this right. After years of a cooling globe (1940-1970’s) we say the level of Arctic ice is “Normal” then after thirty more years of slightly warmer globe we say see the normal ice is disappearing. OK got it.
Life in the Holocene is so easy we argue about ice being lost. What frivolous mental masturbation it is to cry about the cold and to complain about warmth. I think we need an ice age to stop the nonsensical ‘we actually know what’s happening’ chatter. Besides, what would life be without new challenges? Come on nature!
“In diaries of Marco Polo, there is a statement that he sailed to a location where he observed the Pole Star in the South. That means he was on a line between true north and magnetic north, since he was using lodestone compass. That, in turn means he had sailed the Arctic Ocean from Japan nearly all the way to Greenland.”
Or he ran through some sort of magnetic anomaly. Think “Iron Bottom Sound”, but natural.
‘Sea ice is a complex problem, and my personal view is that we simply don’t know enough about its behavior in the larger context to demonstrate a causal relationship with the recent global temperature increases.”
Well, it’s hard to deny physics. And the physics and observations about warming SSTs around the arctic suggest that warmer SST is a contributor. Its not like warmer SSTs will cause an increase in ice. Do other factors–wind and soot– play a role? Of course. Do warmer SSTs play a role? of course. is the final figure determined soley by one of them? of course not.
It’s probably more accurate to say that many factors, including increasing SST temperatures, play a role in the diminishing ice. Were there ice free periods in the warm parts of the Holocene?
Probably. Was soot from industrial processes around? probably not 10K years ago. Warmer planet, heat moves polarward. heat moves poleward.. less ice than there would be otherwise.
Kinda hard to argue that we were ice free in the warm holocene, but that now there is no causal relationship whatsoever between warming planet and diminishing ice.
So, is it getting warmer? yup. will that result in there being less ice in the north than there would be otherwise? yup. Is all of the loss directly a consequence of the warming? no there are other factors. Did C02 cause it all? no. The ice at the pole is retreating. Warming plays a role. Co2 plays a role in that warming. The debate should be centered on how much warming and what if anything we can do about it and what should we do.
REPLY: and then there’s Antarctica, an opposite anomaly all by itself. Bipolar disorder me thinks – Anthony
We should not forget that in the usual way, Arctic sea ice melts when it disappears. Some of it is carried out of the Arctic Ocean by the wind, but usually this is a small amount. In 2007, an unusual weather event occurred, with high pressure developing over Canada, and low pressure over Russia. The strong winds generated by this weather pattern blew large quantities of old ice into the Atlantic Ocean, where it melted. July 1st 2007 was the day when the sea ice decreased by the maximum amount recorded. How unusual was this event. We dont know. We do not have enough in the way of histrorical data. But, part of what this study has found, can be explained by this unusual event, and there are signs that the old ice may be recovering. For example, the figure September Ice Age 1983 to 2011 shows a recovery of 2 and 3 year old ice. Yes, we simply dont have enough data.
Most days I take a look at the sea ice ref page. I haven’t been able to confirm it, but I’ve got a suspicion that the Noaa/Ebrl graphic for Northern hemisphere surface temperatures has changed it’s colour coding. Is anyone able to put me out of my misery by showing where I can find archived graphics to compare it to?
Regarding arctic ice “high resolution data for 1955” reference on wikipedia, are you telling me Willy Connoley let inaccurate data slip onto wikipedia ?
I am being sarcastic of course.
Come on, Steve Mosher. You are going to tell us all how GREAT the data is, right ? All those fabulous sea surface temperatures from Argos and satellites accurate to .00000000000000001 degrees, with gazillions of replicates all the way back to 12,000 BC right ? [Never mind that 451 degree Lake Michigan]
Give.Me.A.Break.
Exactly what is the big rush ? IS the planet going to turn into a glowing cinder next year or in a decade ? Perhaps it would be wise to do the science first and then draw the conclusions, neh ?
Step one would be to take the proper observations using the proper sampling regime or not bother at all. The current data is so bad and even if you think it adequate, taken for such a short period that any conclusions drawn bear more resemblance to reading entrails than real science.
“A Good Man Always Has to Know His Limitations”
“Co2 plays a role in that warming. The debate should be centered on how much warming and what if anything we can do about it and what should we do.”
I’m not a scientist or contributor to the science anyway anywhere, but can’t the debate also be about what role CO2 – not “CO2 has a role so what if anything can we do about it”? As orignally stated above, by all means, let the international conferences decide what to do about CO2 since it’s problem is conceded. The orginal statement sounds like The Accidental Warmist.
I may be – no I am – a scientific dolt. But I’m pretty damned sure that it’s been warmer and colder with higher and lower levels of CO2 and the role of CO2 is not adequately defined in relation to known and unknown variables. Dolt that I am, I am also the one who will have to pay the price for the outcome of the debate and, hopefully, may get to vote in a way that affects the outcome of the power play – I mean debate. Right now, I remain unconvinced to surrender my natural gas furnace, SUV, lawnmower, electricity rates, grocery bill, showering habits, ect. to the care of Al Gore and Jim Hansen as a higher power.
So we had a single data point – very low ice in 2007.
In 2008-2009, when ice was recovering, they couldn’t point to the current ice because it was recovering. So what did they do? Wail about the multi-year ice. The multi-year ice has reduced! Oh no! We’re doomed etc.
Trouble is, by 2012 the multi-year ice is starting to recover as well. So what do they point at? Oh no! The 5-year old ice is at a low point!
OF COURSE IT IS THERE WAS A MINIMA FIVE YEARS AGO.
Sorry for shouting, but do they really think they can get away with this? If there is a local minima in year X, and current year is Y, there will be a minima in (Y-X) year old ice currently. It isn’t exactly rocket science.
Why they just take core samples of the ice at various points all over the ice cap? They could establish the age of the ice at any place of concern and then estimate ice coverage versus age over the whole area. Problem is, they would probably find that there is no very old ice anywhere and instead would establish that the North Pole was free of ice in the not to distant past, which is exactly NOT what they would want to find.
Of course this is all because of man made CO2. Without that tiny bit of extra CO2 in the atmosphere, the Arctic Ice Cap would be somewhere near Churchill Falls Nfld, right?
@Steven Mosher says:
The ice at the pole is retreating. Warming plays a role. Co2 plays a role in that warming. The debate should be centered on how much warming and what if anything we can do about it and what should we do.
======================
Why do you want to do anything about it Steve? Why does it matter? Two thirds of the ice melt every year for a few months at the peak of summer anyway. If a little more melts during that period why would anyone care? Do our societies really having nothing better to worry over? This is the nature of fads I suppose, and the latest fad is climate science.
Ice from early 1980s to mid 1990’s may contain more volcanic ash
http://www.vukcevic.talktalk.net/EAA.htm
Just a thought.
Steven Mosher says:
………….
Hi Steven
Thanks, I have been rehabilitated on RC.
( http://www.realclimate.org/index.php/archives/2012/03/unforced-variations-march-2012/comment-page-1/#comment-229334 )
Anyone else catch the last paragraph?
“This cycle is reminiscent of one occurring on the opposite pole, known as the Antarctic Circumpolar Wave, which has been related to the El Niño-Southern Oscillation atmospheric pattern. If the nine-year Arctic cycle were to be confirmed, it might explain the slight recovery of the sea ice cover in the three years after it hit its historical minimum in 2008, Comiso said.”
If the trend is to the “good” its natural cycles, and they are covering up the bad. If the trend is “bad” then its worse then we thought its all mans fault and we need to do something NOW.
Anthony, regarding your Skate comments…
Note the lack of specificity given by the submariner…Uncle Sam does know the exact locations and the exact depth of the ice…and for years they kept this a secret, due to National Security concerns. I cannot think of a valid excuse for this information not to be public. The Russian’s most assuredly have better info today than we had in the 50’s and 60’s. Heck, we have declassified the fact that we Howard Hughes salvaged a Commie sub…and last I checked…state of the art submersibles are not being readily manufactured…in any of the more sandy regions of our globe…so no threats from any peace loving peoples either…speaking as a card carrying Infidel…
I would think someone should request the details of Sea Ice in the 1950’s from the Department of the Navy…maybe…
Great post, Anthony.
A return to the roots of our current understanding, such as it is.
I see somebody has already referenced William Michael Connolley’s name; this would be the first place I would start (no sarc) on this subject:
“In fact it seems the Wikipedia source page is the only place that 1955-2055 visualization exists anymore.”
.
Steven Mosher says:
March 1, 2012 at 11:26 am
“Well, it’s hard to deny physics.”
—————————————————-
Arctic very interesting this year, Barents and Kara sea ice has struggled to get established and the North Atlantic SSTs have shown positive anomalies throughout the freeze period, well up to now they have.
The North Pacific SSTs have however recorded significantly negative anomalies and the Bearing and Chukchi Sea ice is so far showing an increase in extent and thickness over last year.
http://weather.unisys.com/surface/sst_anom.gif
The melt season will be interesting to watch.
If as they claim there’s continual thinning, then sooner or later the minimal ice extent is going to have to start falling in a serious way. Or am I missing something? (Or does thinner ice melt more slowly as the temperatures rise?)
So when will we see an ice-free Arctic? Or have they given up being that specific?
Steven Mosher says:
March 1, 2012 at 11:26 am
/////////////////////////////////
I find myself agreeing with much of what Steven says, save that I would say that CO2 may play a role in the warming. Anthony is right to point out that the Antartic is not behaving in a similar fashion, and this just goes to emphasise the effects of natural variability.
As regards Artic ice loss, the real issue is so what?
Does the ice loss have any significant impact on Albedo? Probably not much.
Does increase ice loss help cool the planet? Probably yes.
Is thin 1 year ice as effective as 3 or 5 year ice at trapping ocean heat? Probably yes.
Is there any need to be concerned about Artic ice loss? Probably not.
Is Artic ice loss likely to be beneficial? Probably yes.
Unless there is broad use of some type of radioisotope tracking, I really question any characterization of a particular “pixel” of ice as being 1, 2 or n year. How on earth could that ever be tracked within an ever shifting plastic and “tectonic” mass, with new accrual and accretion, “obduction” of slabs over each other with subsequent fusion, snow pack accumulating on top and “glaciating” to the overarching mass, melt ponds later refreezing, etc, etc, etc.
I question the whole enterprise of ascribing an “age” to any particular ice “pixel.”
Susan Corwin says:
March 1, 2012 at 11:11 am
About “normal”
Since the mid-1930s there has been an established international agreement to calculate “normal” temperature and precipitation using a 30-year average. After a year ending in zero (0) a new set of “normals” is calculated and used until another decade has passed. The idea was to provide a simple basis for comparisons that folks could personally relate to.
For example, go to the link below and you can see three periods, namely 1961-1990, 1971-2000, 1981-2010. These are shown on the left side. The table on the right shows 1948-2012 for a summary. The computer era has changed things some but when a TV or radio station reports the weather they will be comparing the day’s numbers to the 1981-2010 period.
http://www.wrcc.dri.edu/cgi-bin/cliMAIN.pl?wa7473
Can someone explain why a space agency studies Arctic ice ??
RobW says:
March 1, 2012 at 11:20 am
“lets see if I get this right. After years of a cooling globe (1940-1970′s) we say the level of Arctic ice is “Normal” then after thirty more years of slightly warmer globe we say see the normal ice is disappearing. OK got it.”
The submarine pictures in open Actic water during the fifties indicate that the ice may have been less than “normal” then as well!
Apologies if this was in the above post as I might have missed it. It’s a darn long read with lots of references.
“Historic Variation in Arctic Ice”
– Tony B
http://noconsensus.wordpress.com/2009/06/16/historic-variation-in-arctic-ice-tony-b/
Steven Mosher says:
March 1, 2012 at 11:26 am Were there ice free periods in the warm parts of the Holocene?
Probably. Was soot from industrial processes around? probably not 10K years ago.
+++++++++++++++++++++++++++++++++++++++++++++++++++++++++++++++++++++++++
Probably not “Industrial” soot but I’ll bet there was lots of “soot”/ash from volcanoes and forest fires that burned unabated. I have always been impressed by how fires in British Columbia can cause visibility and respiratory problems in Regina, 1000 km away (625 miles). (And how visible and obvious it is from 30,000 feet.) I recall sweeping up ash off my deck from the Mount St. Helen’s eruption many miles north in Canada when the scientists said the ash would not go north into Canada due to the prevailing wind being from the west – but I still swept up ash. I do believe I have read about evidence in the ice cores suggesting events of this nature. “La plus la change, la plus la meme chose.”
But you would know better than I … “Don’t worry, be happy.” – Bob Marley
PS – the first part of the multi-year ice graph is interesting showing increasing ice, 83 to 85 then declining with a bump from 1994 to 2000 then back to decline.
Question: is the large amount of multi-year ice in part due to the “global cooling” of the 1970’s and possible cooler ocean currents and a different wind pattern? With the current changes due to a warming ocean, warmer ocean currents and the observed changes in air circulation there appears to be some sort of change occurring at the moment – both in the ocean and the atmosphere. Just an interested casual observer of the charts, no math or science involved. But then, “Who has seen the Wind?” … W. O. Mitchell, 1947
PPS The arctic was ice free some time between 2 and 8 million years ago when trees grew on Ellesmere Island. http://www.sciencedaily.com/releases/2010/12/101215113243.htm
Interesting, I think Peter Tompkins makes a pretty fair case for the Pyramids being much older than is generally held and that the sphinx is even older. He also makes a very compelling case that their primary purpose (at least the primary purpose for the guys that designed and built them) was to conduct celestial observations, among other things.
And talk about climate change! That area by the Nile was verdant back when the pyramids were built.
So, nasa(yes, tiny little letters) is telling us that ice melts in summer and freezes in winter and that is the fault of humans and is going to destroy all life on teh planet. What a load of horse crap.
There might be some more useful Arctic data coming:
http://www.mod.uk/DefenceInternet/DefenceNews/EstateAndEnvironment/RoyalNavySubmarinesToInformClimateChangeResearch.htm
“Little is known about the areas of water underneath the Arctic ice, as sensors are difficult to place for the long-term. Now, UK environmental researchers are to be presented with previously unavailable information, thanks to the Ministry of Defence.”
It doesn’t mention over what time period, but sounds like it could be useful data
I think it’s great that sea ice is going away. That “should” mean there would be an explanation for lower sea levels.
1/2 a dozen of one, 6 of the other.
Jimbo
Thanks for referencing my epic
http://noconsensus.wordpress.com/2009/06/16/historic-variation-in-arctic-ice-tony-b/
I am currently working on part 2 of this series and am consequently ploughing my way through some 500 studies of the arctic, as well as contacting such organisatios as the University of Alaska at Fairbanks.
It is evident that there has been about 7 relatively ice free periods in the arctic during the Holocene and the current episode is nothing out of the ordinary in the broader historic context. The classic Dansgaard et al graphic at the foot of this document illustrates the periods well
http://www.uigi.com/air.html
Whether that all means there is a role for co2 or one for natural variabilty I will leave it to Mosh to explain-what is certain is that there have been warmer periods in the past without enhanced c02
tonyb
This is absurd. The graphic commences, albeit by coincidence, at a period when Arctic sea ice was at its highest. How convenient for alarmists.
Steven Mosher says:
Co2 plays a role in that warming.
This is not established. CO2 has the capability to play a role in warming, but it may not.
The debate should be centered on how much warming and what if anything we can do about it and what should we do.
No. The debate should go away, until proper science has determined how much if any warming is due to CO2. This may be an intractable question.
Not how much warming. How much if any warming.
Here’s that photo again that drives Tamino and Neven crazy
I don’t know about Tamino, but Neven has been using that photo as an avatar for quite a while now. He must be driving himself nuts with that photo.
For example, one crew member aboard the USS Skate which surfaced at the North Pole in 1959 and numerous other locations during Arctic cruises in 1958 and 1959 said:
What he says, is that they surfaced at the Pole and elsewhere in a lead. There are always leads all over the ice pack in winter, because of the winds. Ever since submarines exist, people could go and emerge at the Pole during winter. So that whole Skate-at-the-Pole-in-1958-argument actually doesn’t mean a thing. Now if they would have sailed there…
Multi-year ice “extent”… is diminishing at a rate of -15.1 percent per decade, the study found.
As an engineer, I tend to be overly picky about how trends are described in technical literature and documentation. If something is diminishing at a negative rate, it is actually increasing. So I would assume that the “scientists” as NASA could at least correctly state their description of the problem.
Sloppy technical writing invariably leads to incorrect technical implementations in models.
NASA Finds Thickest Parts of Arctic Ice Cap Melting Faster
I explained the mechanism that causes this yesterday. Briefly, reduced aerosols/particulates results in increased solar insolation, which disproportionately melts older ice as the surface melting accumulates particulates (black carbon), deposited on the ice in earlier seasons, on the surface, decreasing its albedo and accelerating the melt.
BTW, decreasing particulates is the primary cause of most of the rise in minimum temperatures, by increasing early morning insolation raising minimum temperatures, especially in winter.
Anthony,
I’ve got an overhead picture (taken by a C-130) of three subs at the North Pole in 1987, with the Brit sub being in any open polinia. Brit subs don’t have “ice-hardening” surfaces to break through the ice.
Because Arctic ice is best seen from above.
The lion’s share of NASA’s gear is not aimed at the stars or other planets, but back at our own planet.
“Wayne Delbeke says:
March 1, 2012 at 1:44 pm
Steven Mosher says:
March 1, 2012 at 11:26 am Were there ice free periods in the warm parts of the Holocene?
Probably. Was soot from industrial processes around? probably not 10K years ago.
++++++++++++++++++++++++++++++++++++++++++++++
Probably not “Industrial” soot but I’ll bet there was lots of “soot”/ash from volcanoes and forest fires that burned unabated. I have always been impressed by how fires in British Columbia . . . ”
————————————————————–
Of interest regarding fires in Canada:
This reminded me of an event (Sunday, September 24th, 1950) when the afternoon sky hazed-over, the sun turned red, and the sky went dark as night. My sister and a couple of cousins have been sorting our recollections about this via email. We lived in western Pennsylvania about 65 miles NNE of Pittsburgh, PA. Cousin Ethel (now age 94) was so taken by the darkening sky that she saved newspaper clippings in daughter Pat’s baby book. With the scant details from those, finding additional information via the “web” is quite easy. Our dark-sky/red-sun event was caused by a number of large fires in northern B.C. and Alberta, 2,000 miles to the west (& north). Scars show on satellite images today.
Another tale:
http://the-red-thread.net/dark-day.html
Search with: Alberta fires 1950; one of many hits
http://www.canada.com/news/1950+monster+fire+burned+into+history/4823685/story.html
Do you have any peer reviewed references? Are you excluding soot?
Ice-free Arctic Ocean during the Holocene (around the last 11 thousand years).
http://dx.doi.org/10.1016/j.quascirev.2010.08.016
http://adsabs.harvard.edu/abs/2007AGUFMPP11A0203F
http://geology.geoscienceworld.org/cgi/content/abstract/21/3/227
http://wattsupwiththat.com/2010/10/30/new-peer-reviewed-paper-says-there-appear-to-have-been-periods-of-ice-free-summers-in-the-central-arctic-ocean/
Excellent! The Earth is now c02 bipolar (pun intended).
Someone want to tell me why I should care about less polar ice?
As a history major I’m aware of how sought after a Northwest Passage has been. Looks to me like we could be getting one.
Anthony, your reply does appear to have some evidence.
“Twentieth century bipolar seesaw of the Arctic and Antarctic”
http://www.agu.org/pubs/crossref/2010/2010GL042793.shtml
Mosher, might this explain? Do you want to add some soot and ocean currents? Are you now so sure it’s C02 what done it? Where is your evidence?
Please note that they include co2 to get pass peer review.
Yeah, it’s not like a warmer SST could cause an increase in NH snow coverage, right?
I am neither a rock doctor nor glaciologist, so I have a few questions:
As I understand the geography, the Arctic proper is a big floating ice block. This really became evident when the US Navy started driving nuclear submarines under it in the late ’50’s. I also understand that sea ice melts from underneath because the sea water, being liquid, must be warmer.
Using glaciers as an example, thick ice in the land also melts from the bottom because the mass of the ice pressing on the rock changes the melting point of the ice and once it starts flowing it will stay liquid. I noticed this first when wandering around Fox and Franz Josef Glaciers in New Zealand. There is NO melt water on the top surface of a glacier.
Finally, as I understand it, if a glacier stops receiving fresh snow fall on its origin, it stops moving downhill, thus the constantly melting face starts to “retreat”. What stops snow falling: Insufficient evaporation from reduced temperatures or insufficient condensation from increased temperatures?
Probably not “Industrial” soot but I’ll bet there was lots of “soot”/ash from volcanoes and forest fires that burned unabated.
Here in Western Australia we have a very large area of almost completely unpopulated temperate forest and sparse woodland.
Fires burn for long periods over very large areas in this region. In the 1970s, one fire burned for 2 years over 30 million acres (120,000 sq km).
In the pre-industrial era and pre-European settlement eras, forest fires would have burned pretty much continuosly in much of the world’s temperate zones.
Also its something of a misconception that industrialization resulted in a large increase in particulate pollution. Coal (and wood) were extensively used for domestic heating prior to the industrial revolution in places like the UK. Not to mention charcoal production which is an extraordinarily smoky operation was mostly stopped during the industrial revolution by the availability of cheap coal.
timg56 as a history major, check out the RCMP vessel St Roch.
Northwest Passage? We had one.
Oh, that pesky Skate surfacing in thin ice.
It’s all Time’s fault. But back in the late 50’s, nobody knew any better.
The topic here is faster melting of older multi-year ice.
To those advocating GHGs, atmospheric temperatures and SSTs as the cause of Arctic ice melt.
By what mechanism will increasing GHGs, increasing atmospheric temperatures, and/or increasing SSTs disproportionately melt older thicker ice?
Jimbo said on March 1, 2012 at 4:51 pm (bold added):
Peer reviewed gas passing?
RobW @ March 1, 2012 at 11:20 am is exactly right. The beginning of the data is most likely a maximum after the 1940-1970 cooling, and we hit the maximum in 2007 from the 1970-2000 warming part of the ~60 year climate cycle.
And, wouldn’t Bruce @ March 1, 2012 at 5:04 pm be correct in saying the melt has to come from below, as the atmospheric temperature never gets above 0 degC up there? That would explain why there is a lag of perhaps a decade between the end of a warming/cooling phase and the minimum/maximum ice cover.
Bruce says:
March 1, 2012 at 5:04 pm
“There is NO melt water on the top surface of a glacier.”
Perhaps, not on your trek, but:
http://www.nasa.gov/images/content/164322main_moulin-behar-browse.jpg
“Suggestions by NASA in 2007, in Smedsrud Et Al 2011 and recently in Wang, Song, and Curry suggest that wind patterns are a big factor in the Arctic puzzle.”
Yes, per this October, 1 2007 NASA article;
http://www.nasa.gov/vision/earth/lookingatearth/quikscat-20071001.html
Son V. Nghiem of NASA’s Jet Propulsion Laboratory, said that “the rapid decline in winter perennial ice the past two years was caused by unusual winds. “Unusual atmospheric conditions set up wind patterns that compressed the sea ice, loaded it into the Transpolar Drift Stream and then sped its flow out of the Arctic,” he said. When that sea ice reached lower latitudes, it rapidly melted in the warmer waters.
“The winds causing this trend in ice reduction were set up by an unusual pattern of atmospheric pressure that began at the beginning of this century,” Nghiem said.”
Per this 2001 paper, “Fram Strait Ice Fluxes and Atmospheric Circulation: 1950–2000″ by Torgny Vinje published in the American Meteorological Society Journal of Climatet;
“The corresponding decadal maximum change in the Arctic Ocean ice thickness is of the order of 0.8 m. These temporal wind-induced variations may help explain observed changes in portions of the Arctic Ocean ice cover over the last decades. Due to an increasing rate in the ice drainage through the Fram Strait during the 1990s, this decade is characterized by a state of decreasing ice thickness in the Arctic Ocean.”
http://journals.ametsoc.org/doi/abs/10.1175/1520-0442%282001%29014%3C3508%3AFSIFAA%3E2.0.CO%3B2
This 2004 paper “Variations in the Age of Arctic Sea-ice and Summer Sea-ice Extent” by Ignatius G. Rigor & John M. Wallace, states that;
“The winter AO-index explains as much as 64% of the variance in summer sea-ice extent in the Eurasian sector, but the winter and summer AO-indices combined explain less than 20% of the variance along the Alaskan coast, where the age of sea-ice explains over 50% of the year-to year variability. If this interpretation is correct, low summer sea-ice extents are likely to persist for at least a few years. However, it is conceivable that, given an extended interval of low-index AO conditions, ice thickness and summertime sea-ice extent could gradually return to the levels characteristic of the 1980′s.”
http://seaice.apl.washington.edu/
This 2007 paper “Rapid reduction of Arctic perennial sea ice” by Nghiem, Rigor, Perovich, Clemente-Colo, Weatherly and Neumann states that;
“Perennial-ice extent loss in March within the DM domain was noticeable after the 1960s, and the loss became more rapid in the 2000s when QSCAT observations were available to verify the model results. QSCAT data also revealed mechanisms contributing to the perennial-ice extent loss: ice compression toward the western Arctic, ice loading into the Transpolar Drift (TD) together with an acceleration of the TD carrying excessive ice out of Fram Strait, and ice export to Baffin Bay.”
http://seaice.apl.washington.edu/Papers/NghiemEtal2007_MYreduction.pdf
This 2010 paper, “Influence of winter and summer surface wind anomalies on summer Arctic sea ice extent” by Masayo Ogi, Koji Yamazaki and John M. Wallace, published in Geophysical Research Letters states that;
“We have shown results indicating that wind‐induced, year‐to‐year differences in the rate of flow of ice toward and through Fram Strait play an important role in modulating September SIE on a year‐to‐year basis and that a trend toward an increased wind‐induced rate of flow has contributed to the decline in the areal coverage of Arctic summer sea ice.”
http://www.jamstec.go.jp/frcgc/research/d2/masayo.ogi/2009GL042356.pdf
This 2011 paper, “Recent wind driven high sea ice export in the Fram Strait contributes to Arctic sea ice decline”, submitted to The Cryosphere by L. H. Smedsrud, et al. used;
“geostrophic winds derived from reanalysis data to calculate the Fram Strait ice area export back to 1957, finding that the sea ice area export recently is about 25 % larger than during the 1960’s.”
http://www.the-cryosphere-discuss.net/5/1311/2011/tcd-5-1311-2011-print.pdf
You can see can get a sense of the process occurring by watching this 1 year Arctic Sea Ice Concentration Animation from the Naval Research Laboratory:
http://www7320.nrlssc.navy.mil/hycomARC/navo/arcticice_nowcast_anim365d.gif
Neven kept a Fram Strait transport play by play last summer:
http://neven1.typepad.com/blog/2011/07/2011-fram-strait-animation.html
“Update August 8th: Added images from the previous three days. Some serious ice transport going on there. If this keeps up…”
The NASA article Anthony posted says it all, “The thicker ice, known as multi-year ice, survives through the cyclical summer melt season”, i.e. multi-year ice doesn’t melt away during the summer, unless it is transported into warmer waters by wind.
“There’s also direct evidence that soot from the industrialization of Asia is collecting in the Arctic and could be a factor in albedo changes in the Arctic which contribute to ice loss.”
Yes, Particulates;
http://en.wikipedia.org/wiki/Particulates
especially Soot/Black Carbon;
http://en.wikipedia.org/wiki/Soot
http://en.wikipedia.org/wiki/Black_carbon
may also contribute to Sea Ice loss:
http://www.sciencedaily.com/releases/2010/07/100728092617.htm
http://www.sfgate.com/cgi-bin/article.cgi?f=/c/a/2010/07/27/MN5H1EK6BV.DTL
http://wattsupwiththat.com/2010/10/25/soot-ahoy-ship-traffic-in-the-arctic/
http://www.agu.org/news/press/pr_archives/2010/2010-20.shtml
Per the Arctic Marine Shipping Assessment 2009 Report; http://www.pame.is/images/stories/PDF_Files/AMSA_2009_Report_2nd_print.pdf
Page 5 – “Black carbon emissions from ships operating in the Arctic may have
regional impacts by accelerating ice melt.”
Page 142 – Black carbon is a component of particulate matter produced by marine vessels through the incomplete oxidation of diesel fuel. The release and deposition of BC in the Arctic region is of particular concern because of the effect it has on reducing the albedo (reflectivity) of sea ice and snow. When solar radiation is applied, reduced albedo increases the rate of ice and snow melt significantly, resulting in more open water, and thereby reducing the regional albedo further. In the Arctic region in 2004, approximately 1,180 metric tons of black carbon was released, representing a small proportion of the estimated 71,000 to 160,000 metric tons released around the globe annually. However, the region-specific effects of black carbon indicate that even small amounts could have a potentially disproportionate impact on ice melt and warming in the region. More research is needed to determine the level of impact this could have on ice melt acceleration in the Arctic and the potential benefits from limiting ships’ BC emissions when operating near to or in ice-covered regions. The potential impacts of black carbon should also be a point of consideration when weighing the costs and benefits of using in-situ burning of oil in spill response situations.”
And then there are the non-Black Carbon/Soot based impact of Ship Traffic including Supply/Bulk Shipping, Fishing, Passenger/Cruise Ships and Icebreakers:
Arctic Marine Shipping Assessment 2009 Report Page 4;
“There were approximately 6,000 individual vessels, many making multiple voyages, in the Arctic region during the AMSA survey year; half of these were operating on the Great Circle Route in the North Pacific that crosses the Aleutian Islands. Of the 6,000 vessels reported, approximately 1,600 were fishing vessels.”
Arctic Marine Shipping Assessment 2009 Report Pages 141 – 142;
“The AMSA has developed the world’s first activity-based estimate of Arctic marine shipping emissions using empirical data for shipping reported by Arctic Council member states. Emissions were calculated for each vessel-trip for which data was available for the base year 2004. The 515,000 trips analyzed represent about 14.2 million km of distance traveled (or 7.7 million nautical miles) by transport vessels; fishing vessels represent over 15,000 fishing vessel days at sea for 2004. Some results could be an underestimation of current emissions, given potential underreporting bias and anecdotal reports of recent growth in international shipping and trade through the Arctic.”
Arctic Marine Shipping Assessment 2009 Report on Page 79;
“A specific example of where cruise ship traffic is increasing at a rapid rate is off the coast of Greenland. As Table 5.3 shows, cruise ship visits and the number of passengers visiting Greenland has increased significantly between 2003 and 2008. For example, between 2006 and 2007, port calls into Greenland increased from 157 to 222 cruise ships. The number of port calls in 2006 combined for a total of 22,051 passengers, a number that represents nearly half of Greenland’s total 2006 population of 56,901.
In 2008, approximately 375 cruise ship port calls were scheduled for Greenland ports and harbors, more than double the number of port calls seen in 2006.”
Arctic Marine Shipping Assessment 2009 Report Page 137;
“The 2004 U.S. Commission on Ocean Policy reported that, while at sea, the average cruise-ship passenger generates about eight gallons of sewage per day and an average cruise ship can generate a total of 532,000 to 798,000 liters of sewage and 3.8 million liters of wastewater from sinks, showers and laundries each week, as well as large amounts of solid waste (garbage). The average cruise ship will also produce more than 95,000 liters of oily bilge water from engines and machinery a week. Sewage, solid waste and oily bilge water release are regulated through MARPOL. There are no restrictions on the release of treated wastewater.”
Arctic Marine Shipping Assessment 2009 Report Page 84;
“During 2004-2008, there were 33 icebreaker transits to the North Pole for science and tourism. An increasing number of icebreakers and research vessels are conducting geological and geophysical research throughout the central Arctic Ocean related to establishing the limits of the extended continental shelf under UNCLOS.”
Arctic Marine Shipping Assessment 2009 Report Page 84;
“Map 5.6 demonstrates the surge in vessel activity in the summer season, when all of the community re-supply takes place and most bulk commodities are shipped out and supplies brought in for commercial operations. Summer is also the season when all of the passenger and cruise vessels travel to the region.”
and Arctic Marine Shipping Assessment 2009 Report Page 160;
“Spring break-up to mark the start of summer navigation will vary and, as happens now in more southerly seas, shippers eager to start work will test the limits of their vessels in ice.”
http://www.pame.is/images/stories/PDF_Files/AMSA_2009_Report_2nd_print.pdf
I also wonder if the Ajurak Icebreaker trials in the Fram Strait in 2009 could have helped facilitate transport a bit, i.e.:
“Icebreaker and ice-management trials on behalf of ExxonMobil in connection with the Ajurak project. In this research expedition during September 2009 Icebreaker Oden (TransAtlantic management) and Icebreaker Fennica was performing various tests for ExxonMobil.”
http://www.rabt.se/Offshoreicebreaking/Reference-list/
There is no doubt that the .336 K/C per decade increase in Northern Polar RSS Lower Troposphere Temperatures;
ftp://ftp.ssmi.com/msu/graphics/tlt/plots/rss_ts_channel_tlt_northern%20polar_land_and_sea_v03_3.png
has had some influence, but it certainly isn’t the primary reason that “Multi-year ice “extent” – which includes all areas of the Arctic Ocean where multi-year ice covers at least 15 percent of the ocean surface – is diminishing at a rate of -15.1 percent per decade” and “multi-year ice area is shrinking even faster than multi-year ice extent, by -17.2 percent per decade.”
http://www.nasa.gov/topics/earth/features/thick-melt.html
The NASA article Anthony posted says it all, “The thicker ice, known as multi-year ice, survives through the cyclical summer melt season”, i.e. multi-year ice doesn’t melt away during the summer, unless it is transported into warmer waters by wind.
A priori reasoning makes them replace ‘shouldn’t’ with ‘doesn’t’.
Also the decreased aerosol/particulates, increased solar insolation explanation predicts lost older multi-year sea ice will be replaced by new muti-year sea ice (the 2 and 3 year ice in the graphic above), which is what’s happening.
Bart says:
March 1, 2012 at 6:25 pm
“the atmospheric temperature never gets above 0 degC ”
Explain this:
http://ocean.dmi.dk/arctic/meant80n.uk.php
Daily logs for the Skate should be available for anyone interested in taking the time to request them and read/copy them. (In Virginia I believe) It would be an interesting read.
A friend hired some guy back east to go and photo copy all the logs from the destroyer he was on in the sixties so they could be provided to his shipmates on their website.
When the open leads close, they often crush together with such power they create “pressure ridges.” These are like miniature mountain ranges. I’m not sure how high they stick up, but the explorers traveling by sled tried to avoid them when possible.
One thing about pressure ridges is that they follow the “iceburg rule.” If they stick up ten feet, nine-tenths is underwater, which means they have roots sticking down ninty feet. If they stick up fifteen feet, the roots stick down one-hundred-thirty-five. And so on.
Another thing about pressure ridges is that they are not all that wide. I have heard various distances mentioned, but fifty yards, half the length of a football field, seems typical. This makes them very hard to see from outer space. On some sites, that picture arctic ice with a “zoom” option, I have been able to see these pressure ridges, if I zoom in as far as I can, but even then they are barely wide as a hair.
This makes me wonder about the ability of the sensors used to compute “average thickness,” and their ability to include the hair-thin pressure ridges that hold very thick ice. Are not the sensors basically a bounced radar beam? Can they pick up a very narrow feature?
Just The Facts says:
March 1, 2012 at 6:32 pm
“Suggestions by NASA in 2007, in Smedsrud Et Al 2011 and recently in Wang, Song, and Curry suggest that wind patterns are a big factor in the Arctic puzzle.”
Yes, since winds are driven by the atmospheric pressure (the NAO), and that in the final analysis is the source of the AMO as first described here:
http://www.vukcevic.talktalk.net/theAMO-NAO.htm
but climate scientists are a somewhat ‘pompous’ not to say arrogant lot to take a note from an outsider.
But what than drives the NAO?
There is answer to it too, it could have been the sun, but relation broke in the early 1990’s, so there is only one variable left :
http://www.vukcevic.talktalk.net/theAMO-NAO.htm
Second link is:
http://www.vukcevic.talktalk.net/GNAP.htm
Herman Pope posits a negative feedback cycle of Arctic Ice as the dominant stabilizer of current climate, responsible for holding the current benign interglacial in place for so long, unlike the brief peaking and rapid decline in temps of previous ones:
herman@popesclimatetheory.com
Loss of ice generates more air moisture/snow, which leads to cooling, which freezes over the Arctic Ocean, which cuts off the snow supply, which leads to retreat of the high-albedo snow area, which leads to warming, which leads to loss of Arctic Ice, which ….
John F. Hultquist says:
March 1, 2012 at 7:28 pm
“Explain this:”
Obviously, it’s a conspiracy 😉
Anyway, I asked the question, and you answered it. But, melt from below and the lag in heating or cooling the arctic ocean could still explain why ice maxima/minima appear to lag the turning points in atmospheric temperature.
I doubt real science can be done on arctic sea ice predictions before 2100, since the data simply won’t be there to allow correct modelling. You can model it all you want, but how you ‘tune’ a model without a lot of prior data I don’t know…..
This is a very good point in my estimation. There is precedent for suppressed evidence (for reasons of national security) which badly influences the concurrent debate: the Venona Project was not declassified until less than a decade ago, which was unfortunately four decades too late for Joe McCarthy and all the other anti-Communist heroes that had to fight a serious battle with their best ammunition sequestered. By all means, get this stuff declassified forthwith. FOIA these suckers before they do it to us again. The reds, err greens, err watermelons I mean.
Did anyone notice this intriguing comment …
If you are still reading this thread could you elaborate on his status? If he is still with us perhaps you might arrange for an interview of him on the record so he can at least get his important eyewitness experience documented! Maybe he has his own private photos.
Ignoring the condescension in Steve Mosher’s comment, and the convenient way he asks himself questions and replies to them as well, can we just cut to the chase here? How about you answer a question or two?
Steve, what should the sea ice extent be doing today, increasing, decreasing, remaining static?
Steve, what should the ‘climate’ be today when compared to the 1960’s to 1970’s mini ice-age, the same, warmer or colder?
Steve, what should the ‘climate’ be today when compared to the pre-19th century little ice-age, the same, warmer or colder?
Before you can say anything is out of the norm, you have to know the answers to those questions. Before you can say we changed the climate, you have to know what the climate would have been minus our presence.
You as a lukewarmer, very much just like the contingent of full-warmers all act like a mild warming trend (post-1980) after a mild cooling trend (60’s to 70’s) is something other than planetary SOP.
A larger point here is that just like the red/blue state election maps intentionally reversing the logical assignment of red to the Democratic Socialist party, we have a similar situation with intentional assignment of the words ‘climate change denier‘ to those of us that are actually citing ‘normal Climate Change’ as the perfectly natural situation. That makes us ‘Climate Change Supporters’ if you ask me. Those on the other side are actually the ones arguing for a static climate and are thus the actual ‘deniers’.
So cue up Casablanca … I’m shocked, shocked to find that
gamblingClimate Change is going on in here!I wonder why it is that I automatically thought of Mosher when I saw the words ‘bi-polar disorder’. 😉
Has anyone thought to ask the navy if it would release the environmental data? Every hour on the hour without fail the watchkeepers in those boats under the ice would have record such things as depth, sewater temp, salinity and position (that will be the sensitive bit). There will also be bathythermograph readings and ice thickness.
I must say, I find it more than a bit odd to say that it is ‘cherry-picking’ to start at the beginning of the available data.
All in all, there seems to be little substance to this lengthy post.
This “bipolar” seesawing between hemispheres has been identified as a sign of impending end of interglacial in a recent paper:
Determining the natural length of the current interglacial
P. C. Tzedakis, J. E. T. Channell, D. A. Hodell, H. F. Kleiven & L. C. Skinner
Nature Geoscience 5, 138–141 (2012) doi:10.1038/ngeo1358
Received 23 May 2011 Accepted 28 November 2011 Published online 09 January 2012 Corrected online 10 January 2012
The timing of the hypothetical next glaciation remains unclear. Past interglacials can be used to draw analogies with the present, provided their duration is known. Here we propose that the minimum age of a glacial inception is constrained by the onset of bipolar-seesaw climate variability, which requires ice-sheets large enough to produce iceberg discharges that disrupt the ocean circulation. We identify the bipolar seesaw in ice-core and North Atlantic marine records by the appearance of a distinct phasing of interhemispheric climate and hydrographic changes and ice-rafted debris. The glacial inception during Marine Isotope sub-Stage 19c, a close analogue for the present interglacial, occurred near the summer insolation minimum, suggesting that the interglacial was not prolonged by subdued radiative forcing. Assuming that ice growth mainly responds to insolation forcing, this analogy suggests that the end of the current interglacial would occur within the next 1500 years.
“not prolonged by subdued radiative forcing” is particularly interesting, this would brush aside the former orthodoxy that the current node of weaker eccentricity oscillation means an abnormally extended interglacial (Ruddiman et al). So now we only have CO2 to save us. Still, no worries, eh?
Much of the multi year ice disappeared in 2007, or indeed before. I am not sure what their paper is intended to prove.
As Steve Goddard correctly points out, since 2007/2008, multi year ice has been increasing. What was 3 years last year will be 4 years this year, etc. We will have to wait till 2013 for the 5 years figure to recover.
(2008 was actually the nadir for multi year ice and not 2007 as often believed.)
Here are some detailed descriptions of tampering [‘corrections’!] with historic Arctic monitoring station data to support the quasi-science of AGW. In real science this would cause outrage and loss of jobs, but in this quasi-science if the facts don’t fit it is perfectly acceptable to change them.
http://notrickszone.com/2012/03/01/data-tamperin-giss-caught-red-handed-manipulaing-data-to-produce-arctic-climate-history-revision/
Steve Goddard had another post on sea ice, showing an IPCC graph from the 1st report in 1990.
http://www.real-science.com/wp-content/uploads/2012/02/PaintImage1225.jpg
http://www.real-science.com/ipcc-early-1970s-arctic-sea-ice-persistently
So the IPCC was using data that predated the satellites in their first report, it had to come from somewhere.
If you are referring to the satellite monitoring of the Arctic which begins in 1979 there is nothing odd about calling it ‘cherry picking’ at all. There is something very convenient about it however, for the warmies, that is.
For example, if you were to start recording hourly temps at 8am your trend will show something completely different than if you started at 8pm. And if halfway through the 24-hour day you started making grand judgments and recommendations based on the available data you would be a fool. ‘After examining the available data we scientists have come to the conclusion that it is warming at a rate of 3 degrees per hour and proactive steps MUST be taken to avoid catastrophe! The science is settled’.
We just happen to be living now at a point in time where at least three identifiable cold-to-warm transitions of varying frequencies are occurring simultaneously …
[1] – Glacial Maximum to Holocene Interglacial
[2] – Little Ice Age to Modern Warm Period
[3] – 1960’s-1970’s cool period to 1990’s-2000’s warm period to
There may even be other as yet invisible but similar cold-to-warm phase changes yet to be identified. So instead of three reinforcing waves there may be more. Any one of those transitions to a reasonable person is explanation enough for the minuscule sub-one degree average temperature rise that climate geniuses assign to the past 100 years. So the catastrophic prophecies are utter insanity. The real question which will never be addressed so long as we are running around like dark age fools cowering in fear from a comet is this: where are we specifically in these various transitions of cold-to-warm-to-cold-to-warm-to…
[1] – Glacial Maximum to Holocene Interglacial to ???
[2] – Little Ice Age to Modern Warm Period to ???
[3] – 1960’s-1970’s cool period to 1990’s-2000’s warm period to ???
Where are we? Are we closer to the beginning, perfectly centered or at the tail end? No-one knows. It makes all the difference in the world though. If we actually are at the end of the Holocene, it would be idiotic to suck all the CO2 out of the atmosphere. We’re only 200ppm or so above certain death. That is to say we are living on the lower edge of atmospheric CO2 ppm, because below 200ppm or so will lead to a dead planet.
So, one partial degree average rise and the entire scientific community is turned upside down! Buckets of money are poured down the toilet bowl to satisfy these doomsayers, with Trillions more demanded. Insanity. Last time I checked, birds and people were still flying south for the winter to escape the annual 90 to 100+ degree temperature delta that occurs every six months ***. Yeah, that sub-one degree average temp rise over a hundred years is real scary.
*** That’s °F, daily max summer-winter in NorthEast USA. Max here in summer 100+°F to coldest max in winter around 10°F.or even 0°F. There have been larger and smaller than 100°F max swings in the past of course. The daily swing can be anything from 20 to 40°F or even more. Someone explain to exactly where that sub-one degree average temp rise is buried in our real world measurements? And explain how these real temps will be affected by another degree or two?
Brian H says:
March 1, 2012 at 11:36 pm
Don’t know when that was but it is something I posited over a year ago on this very site. Arctic ice recedes allowing more energy to be dissipated from the oceans, then the ice advances again and the oceans recharge.
BTW, I must give due credit to the late Jan Pompe as co-conspirator on that posit.
DaveE.
Wayne Delbeke, get your facts straight!
“Don’t worry, be happy.” – Bob Marley
That’s Bobby McFerrin, not Bob Marley. Can I trust anything you say?
Commander James Calvert, who led both the 1958 and 1959 USS Skate arctic missions, wrote a book in 1961 – Surface at the Pole. In it you can find precise details of the Skate’s North Pole surfacing. For instance they had to search for hours to find a small ‘skylight’ through which the Skate could surface. ‘Skylight’ was the name they gave to thin ice through which a little surface light would shine through (pp 178).
Calvert characterized the ice in the frozen lead they had broken through as ‘heavy’ and the ice surrounding the frozen lead created surface hummocks 18 feet high – the tallest they had seen (pp 182).
Out on the ice they held a memorial service for Sir George Hubert Wilkins. The temperature was -26F. It was too dark to read without a light, so crewmen held flares to provide illumination (pp 184). A photo of the service can be found at the Chatter Box or at the Ohio State University Libraries’ Wilkins Exhibit. The photos are from Commander Calvert’s book. Contrast the Wilkin’s memorial service photo to the ‘fake’ photo used here – reality doesn’t match the meme.
To explain how we have info on the ice thickness near the North Pole from the mid 1950s:
We maintained a series of floating stations on ice islands which monitered thickness and drift.
The Russians maintained an even better series of observation stations designated “NP” followed by a number. You can find some of their papers by googling. They released some of their data in an agreement with the U.S. back in the 1990s. Both nations flew regular reconnaisance flights over the area due to the cold war. You can find some of their info in old books produced by NATO.
Kevin O’Neill gives a good summary of the highlights of Captain Calvert’s voyages above, but I might add a quote from his article in NatGeo:
“There was considerabe information on Arctic ice thickness, most of it dating back to Fridtjof Nansen’s brilliant Arctic expedition of 1893-96. I was surprised at what I found in the reference material. The ice pack ranges in thickness from 9 feet in the summer to 13 feet in winter. In an ocean more than 12,000 feet in depth, that’s not much ice!”
“…because it shows open water in the Arctic in 1958”
Most likely taken in August in a polnya near Drifting Station Alpha, which drifted in an area 500 km north of Barrow, Alaska.
Here is a classic from the 1970’s
http://pjmedia.com/zombie/2012/01/31/the-coming-of-the-new-ice-age-end-of-the-global-warming-era/3/
complete with Arctic ice diagrams.
Duh. Instead of the website, I posted Herman Pope’s email above. The website is
popesclimatetheory.com
@David Evans;
According to the timeline onsite, he began developing these ideas after retiring from NASA as an aerospace engineer in 2007, and seems to have had them in place by ~2011. So it’s pretty much a case of parallel evolution.
🙂
J Bowers [March 3, 2012 at 8:22 am] says:
Ummm what do you mean by fake? Are you saying Anthony or someone created or photoshopped that image? I know what ‘fake’ means, we just went through this with the fabricated Heartland memo. So what do you mean by “fake” in that comment?
“Most likely taken in August in a polnya near Drifting Station Alpha, which drifted in an area 500 km north of Barrow, Alaska.”
Exactly what are you saying here? Are you saying the caption is wrong? The link you supplied does not support your hypothesis, it is just a landing page for a film at NSIDC, an agency that is ran by uber-Arctic bedwetter Mark Serreze, which sucks up USA taxpayer dollars in order to issue alarmist press releases.
MODS: please delete last comment, this is corrected:
Ummm what do you mean by fake? Are you saying Anthony or someone created or photoshopped that image? I know what ‘fake’ means, we just went through this with the fabricated Heartland memo. So what do you mean by “fake” in that comment?
Exactly what are you saying here? Are you saying the caption is wrong? The link you supplied does not support your hypothesis, it is just a landing page for a film at NSIDC, an agency that is ran by uber-Arctic bedwetter Mark Serreze, which sucks up USA taxpayer dollars in order to issue alarmist press releases.
I’d be a little careful in taking military publicity photos at face value, especially those from the cold war era.
Truth, fiction, and propaganda go hand in hand now, especially in relation to the CAGW campaign.
But in relation to military capability and the requirement for headlines it was even more the case then.
“Global sea ice hasn’t varied all that much in 30 years”
If you are basing this on Jeff’s posts at the Air Vent, as you appear to be, then he has vouched that his study is not a proxy for global transient sea ice, let alone ALL the global sea ice.
From here.