I found this post interesting, especially after looking at some of the images that show what appears to be a tight hot spot upwelling off the coast of Costa Rica. But I simply can’t see enough energy in this venting to account for the massive energies dissipating in ENSO events. But, let’s give it a shakedown. I welcome comments from readers on this topic. – Anthony
Argo Data Confirms El Niño/El Niña Caused By Underwater Volcanoes
Guest post by AJ Strata of The Strata-Sphere
Last week I postulated that the El Niño/El Niña effect was not due to solar or atmospheric conditions, but actually caused by underwater volcanic activity along ocean ridges off the West coast of South America. To see whether my theory held water I decided to look into the Argo Float data to see if there it was showing a warm upwelling of water in this region. I apparently was correct.
My initial assessment was that the frigid Humboldt Current that comes north from the Antarctic region along the west coast of South America (the mirror image of the current that drops down from the Arctic along the west coast of North America) could not be warmed so drastically in such a short time by sun and air alone. This is due to the physics of ocean currents and the massive amount of heat required to warm tons of cold water moving northward per second:
Gyres are caused by the Coriolis Effect; planetary vorticity along with horizontal and vertical friction, which determine the circulation patterns from the wind curl (torque).[1] The term gyre can be used to refer to any type of vortex in the air or the sea, even one that is man-made, but it is most commonly used in oceanography to refer to the major ocean systems.
…
The “South Pacific Gyre” is the Earth’s biggest system of rotating ocean currents, bounded by equator to the north, Australia to the west, the Antarctic Circumpolar Current to the south, and South America to the east.
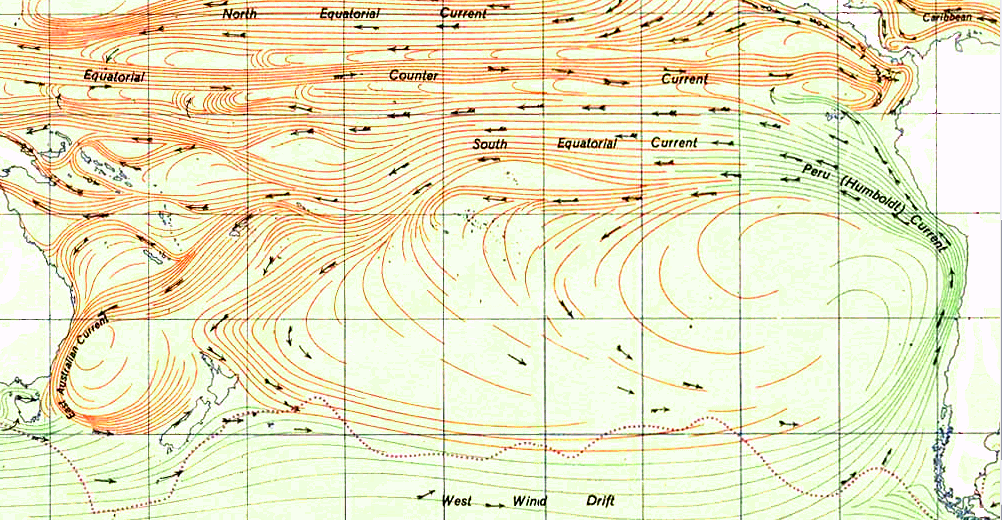
As can be seen in the graph above (click to enlarge), the Humboldt Current is one of the largest on the planet. It is infeasible that El Niño can arise from atmosphere and sun alone by warming this mass of water. Neither air temp or solar radiance change enough to cause this phenomena.
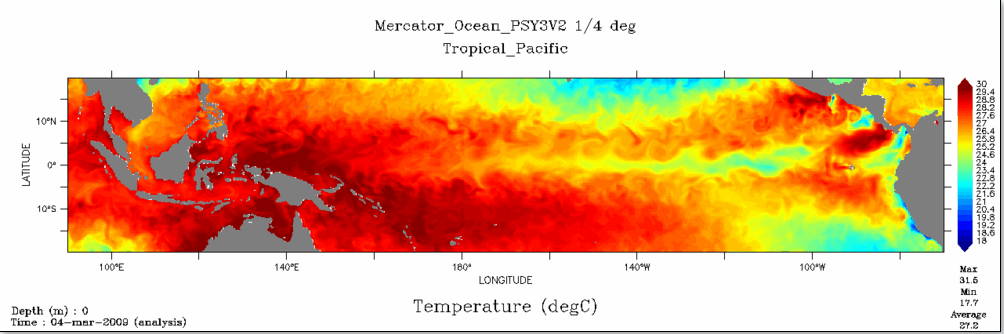
At this site you can watch animation of nearly 5 years of Argo data on the tropical region of the Pacific Ocean. It is fascinating and proves my earlier conclusion that the warm waters of El Niño arise from the eastern pacific and travel west – not the reverse as is the current (now defunct) theory. You need to set the start date on the left to the earliest date in 2007 and the end date to the latest in 2012.
I suggest you first watch the surface animation, then go the the 100m data. What you will see in the 100m is hot water upwelling off the coast of Costa Rica (which was not in the zone I originally predicted the upwelling would occur BTW). I have taken a few snaps of the data from Oct 2008 to Feb 2009 at 4 week interval to highlight what I discovered.
On this first image (click to enlarge) we see the very beginnings of the upwelling off the coast of Central America (area highlighted by red rectangle with a small blue dot). As time progresses the upwelling grows, moves west and another upwelling appears. The images are from 10_22_2008, 11_26_2008, 12_24_2008, 1_21_2009 and 2_25_2009.


Now some may ask why didn’t Argos detect the upwelling deeper (1000m)? The answer is in fluid dynamics. The hot spot is very narrow above whatever thermal vents are the source of this warming. The Argo floats are not very dense in this region. So the warm column of water upwelling has to spread out as it rises, making it more likely to be detected by the Argos floats. By the time it hits the surface the warm water really spreads out over top of the cooler layers below.
As this March 2009 surface image shows there are two upwellings in the area, but the one off Costa Rica is missed at the lower depths (again likely due to the density of sensors being so low in this area). And there appears to be a 3rd upwelling off the coast of Peru.
The activity of Nicaragua and Costa Rica is right along the Cocos Plate.

The Peruvian region I highlighted in the previous post and is linked to the Pacific Rise. Higher volcanic activity in these areas clearly cause more warm water to rise and heat the surface, creating the conditions for El Niño. Lower activity allows the cooler currents to dominate, bringing on El Niña.
… and since climate affects volcanoes …
El Niño/La Niña, please…
The SMU has the a good online reference for the geothermal flux and really it says that we know very little about it. Hot spots in the USA have up to 15Wm-2, so it seems almost obvious that there must be vast hot spots on the ocean. The other aspect of the SMU studies and papers is that the variation of the flux over time has also not been quantified, we have no idea how much it varies over any time scale.
http://smu.edu/geothermal/heatflow/heatflow.htm
I think it’s pretty well established that changes in the trade winds are what cause the ENSO. Winds can push a lot of water from one place to another but more importantly those winds can evaporate, or not, a lot of water and evaporation is extraordinarily powerful at removing heat and when they’re not blowing at allowing heat to build up in the surface layer and not mix downwards.
Internal heat from the planet leaking through volcanoes isn’t enough, directly, to cause ENSO. Plus one would have to come up with something rather fast and cyclical to inject, or not, enough hot water. Volcanoes aren’t known for fast cyclical behavior. Individually they are slowly repeating over centuries and millienia but not rapidly repeating over years and decades. Plus a whole line of them tends to be not cyclical at all but rather collectively constant. I think Anthony’s instincts there are well founded. But that’s not to say it couldn’t indirectly be doing it. A major volcanic eruption on the surface can certainly alter the climate for years indirectly through stratospheric particulates from the eruption blocking sunlight. You should probably look for some indirect method where the upwelling warm water has an effect on the trade winds which in turn drives the ENSO. The fast cyclical nature is still what bothers me because that’s just not typical of volcanic activity.
I mean, vast quantities of thermally heated, super-hot water at up to 400 degrees Centigrade belching out of long chains of submarine black smokers HAVE to have at least SOME effect on the ocean currents above.
May be worth a closer look, IMHO.
The plate boundary off the west coast of central America is a subduction zone so there are no volcanoes along it but on land as the last graphic shows. There are ridges, with attendant volcanic activity, further out but along the western edge of the Cocos plate which is some way from your upwelling.
The volcanic activity above the subducted plate is around 150Km from the subduction boundary but does depend on the subduction angle. The steeper the subduction the closer the volcanic activity, the shallower the further away as is evident in Chile where there is a long swathe of subduction without the volcanoes.
So I am afraid I cannot shine any light on your observations.
Certainly seems more plausible than atmosphere. You could do a cheap physical model with a big shallow pan full of viscous fluid and an immersible coffee heater.
By a hurried back-of-the-envelope, it’s not totally ridiculous. Volcanoes can pack 1e19J in an event. That is enough energy to heat the 20-meter mixed layer 2.5C (at 10J/liter) (the difference between green and red on those maps above) for 50 million square kilometers of ocean.
Not sure I see it. Volcanoes can be active all the time, some of the time, very little of the time… some can be dormant for centuries, then have huge eruptions for months or years. It seems to me that there would be hotter spots/spikes, in the regions where volcanoes are grouped together. Of course, I am writing this on the fly- I’ve got a barn full of animals to deal with in a few minutes- and I haven’t had time to go over it all properly.
Well these hotspots are pretty real and their volcanic origin seems pretty likely but I don’t believe they are the only thing behind El Nino/La Nina. They may cause a temperature inversion to break up, acting as the trigger event, but the inversion must be there first and that’s much more energy than what’s in these tiny hotspots.
However – we all know Earth is hot inside. The deeper you go in mines, the higher the temperature is. How comes ocean bottoms are so cool? The only explanation is – it’s because the cool water there was originally cooled down in polar areas. And I believe the whole ocean bottom is one extraordinary warming plate, warming the deepest waters by tiny amounts but with a lot of energy involved due to the large area. This, and dynamic effects (such as temperature inversions) related to it may be the major cause of El Nino/La Nina.
Very interesting hypothesis.
One thing to think about: Piers Corbyn has been saying (and is now making predictions based on it) that CMEs which hit earth’s atmosphere have effect on earthquakes (perhaps he should look for similar links to volcanoes?), which may mean that the link between solar factors and ENSO modulations is possible, albeit through an amplifying mechanism using the earth’s magnetosphere, inner core and thermal venting.
Interesting to see how the science pans out………
I think it`s pretty obivous from those temperature maps that at the Central American end, some of the warming starts from Volcanic events. But like many people have said, that cant be enough to warm the whole south pacific (it certainly CAN’T). So obviously there is something else that causes an amplicification/feedback that increases these power of these hotspots – the Trade Winds ? the Humboldt Current ? Solar ? Maybe these 3 hotspots (and it`s probably many more), cause a local upwelling current that interferes with the Thermohaline and Halothermal circulation
Perhaps a full look into the ocean depths at these so called smokers will show up more as a crack in the earths crust. The smoker parts as the most obvious, the crack maybe hundreds of miles long and some miles wide, The surface being in constant quench and heating billions of tons of water. The smokers may be the smoking gun.
Volcanoes and earth tremors are triggered by the machinations of the sun, thus this heat source may be cyclical as also is the sun.
{ this is the missing heat Trenbeth forcast, maybe ,perhaps tho’ it does not help his CO2 cause much}
The sun varies not just the heat of our atmosphere but stirs also the bowels of the Earth.
Is there a philanthropist who willing to support an expedition with a task to measure the thermal gradient between the ocean floor (sediment) and the ocean (water) at 1-5-10 and 100m from the bottom.
Just 0.1 deg K / big surface-area / long time, thermal difference enough in the long run to modify currents. May be not need to have small/hot spot. Just a “Yellowstone” under the sea!!
Perhaps a mathematically skilled can do a “backward” calculation: what kind of “heat-flow” need to influence “x” degree of temp on the top and “y” m/s speed of current change.
But, perhaps the ocean currents/conveyor-belts is “locked” with gravity/solar-system/spin instead of thermal flux/temp-gradient.
The ocean bed is cooler the further away from the constructive ridge you go. Sea water temperature at the floor is between 2-0C so cools the sea bed. As the subduction zone is approached the water depth increases due to the cooling of the ocean crust from the 1200C erupted to that of the cold subducted crust. Depths are 2,5Km at the ridge to 6 or more Km at the subduction zone and even deeper at the line of subduction, the deepest trench is 11Km deep. So subducting crust is cold therefore no volcanism. As the subducting crust gets deeper it warms up and when the temperature gets to 760C or so starts to melt with water acting to lower the melting point and volcanoes are formed by the rising melt, inland in the case of S America and forming ocean arcs of islands in the case of ocean crust/ocean crust subduction with Japan as the best example.
I repeat, there is no volcanic activity below the point of the ocean hot spot that is so close to Costa Rica.
Interesting idea. It’s about that which triggers the variation in the cycles, not the cycles themselves. So one has to explain the periodicity as noted above. But I would also have thought the trigger point occur at well-known hotspots like Galapagos than off of the Cocos spreading center (Barkhausen et al 2001 (JGR), Harpp et al. 2005 (j Petrology)….? I haven’t overlaid maps of known volcanoes – but then again I haven’t even had my first cup coffee. First things first.
;-D
This is just an upwelling area mostly caused by the North Equatorial Counter Current (which flows to the East at 5N-10N) and its interaction with the coast, various other ocean currents and the winds which are still primarily to the west here. The coastal upwelling is composed of three different upwelling gyres, Tehuantepec, the Costa Rica Dome and the Gulf of Panama. The thermocline is right at the surface in these three upwells and they alternate between warm and cold upwelling.
Well, it makes sense that Indonesia is such a hot spot, what with the massive amount of volcanoes and vents in that part of the ring of fire, and south and central america are not it’s equal.
If it fits with the Atlantic and Indian oceans too…
oceanexplorer at noaa has bunch of info on the ring of fire. It’s sad nobody seem to know in what range the amount of submarine vents and volcanoes numbers.
Surfer Dave says:
February 15, 2012 at 2:23 am
The SMU has the a good online reference for the geothermal flux and really it says that we know very little about it. Hot spots in the USA have up to 15Wm-2, so it seems almost obvious that there must be vast hot spots on the ocean. The other aspect of the SMU studies and papers is that the variation of the flux over time has also not been quantified, we have no idea how much it varies over any time scale.
===================================================
Dave, we also must consider that the mean crust thickness is close to 11 miles on land, and ONLY three miles in the oceans. Someone will comment that boreholes meausre only a very small heat flux.1 to .2 W/m2, but as far as I know this is land meausrements. In large parts of the ocean we do not know the residence time of the input from geo thermal heat, or the amount of active volcanism within the thinner crust ocean basins, We do keep finding more. Now if this heats residenced time is days, weeks years, and in some areas centuries, then a lot of heat can accualate over that time frame.
In regard to ENSO I think “Just the Facts, in his post just below yours, makes logical statements concerning this.
I want thank Anthony for the opportunity to post here and I look forward to all the insightful comments his readers will provide. It is a rare privilege to get this kind of high powered review.
As to the idea a few volcanoes (and we don’t know how many there are in this active tectonic area) cannot heat that much water and it must be air and sun, I have to note once more that I found a source in the prior post stating a current like the Humbolt pushes tons of water a second.
My recollection of heat capacity between air and water would indicate to me the air might cool before the water warmed when we’re talking that kind of mass of frigid water flowing. The number was for the similar sized Gulf current on the east coast of North America.
I would assume we are dealing with a lot of thermal vents. Some could even be more like geysers than volcanoes. We just don’t know enough about this area of the planet to make broad assumptions. Looking forward to the discussion.
@Kasuha, it’s because water at different temperatures has different density, and the densest and therefore heaviest water will go to the bottom of the ocean (if there are no other ocanic currents preventing it), and that’s water at 4C (277K), if I don’t remember wrong.
This is a topic that Robert Felix at Ice Age Now has been discussing for years. I think it would be well worth the effort to read his posts on the subject. Here’s the link: http://iceagenow.info/category/volcanoes-leading-us-into-an-ice-age/submarine-volcanoes-more-important-than-we-realize/
Interesting. Ever since I first saw pillow lava formation in an undergrad geology video I’ve been impressed with the amount of heat being liberated into the oceans. Of course many people have looked into the energy balance and come to the conclusion that the geothermal contribution to the ocean’s heat is relatively minor. That’s unintuitive though. That magma at ocean spreading ridges is damn hot and it only going to cool by heating sea water. Then there is the hydrodynamics of black smokers. How much percolation of cold seawater into the seafloor takes place, being pumped out at superheated temps (what would/could that do to isotope ratios? :)?
Of course, so far as I can see, the experiments an mapping needed to REALLY answer the energy budget questions just haven’t been done (expensive and hard), and even if they were, the temporal variability would still be uncertain…
Someone in another post on another thread pointed me back to another amazing diagram I’d seen some years ago and promptly forgotten about:
http://ga.water.usgs.gov/edu/earthhowmuch.html
Looking at that, there isn’t really that much water there so I could easily see geothermal being a substantial contribution, and variable over time too. Sure, wind moves the surface water around and that steer currents, but it would make sense if the heat from the rocks underneath that actually drive them.
Follow the money/energy and there’s a LOT in that there mantle and core. Keep asking those questions…
I have looked into this some 18 months ago and indeed there is a natural process, as yet not recognised by the science, which correlates well with the Southern Oscillation.
http://www.vukcevic.talktalk.net/SOI.htm
ALSO, it would be interesting to do the math (I can’t do math, I’m from Texas) on underwater volcanism’s effect on the CO2 saturation of ocean water, which is such a source of despair for warmistas.
AJ Strata writes: “Last week I postulated that the El Niño/El Niña effect was not due to solar or atmospheric conditions, but actually caused by underwater volcanic activity along ocean ridges off the West coast of South America.”
But your post does not indicate that the warm water plumes you believe are caused by volcanoes have any impact on ENSO. You’re going to have to document, with data, the contribution of that small plume of warm water to the overall volume of warm water that is released from the west Pacific Warm Pool during an El Nino. You’re going to have to document the frequency and magnitude of volcanic eruptions and how they relate to the frequency and magnitude of ENSO events. You’ll have to discuss how that small plume of water water would weaken the trade winds in the western Pacific, which is what initiates an El Nino. I think you’ve still got your work cut out for you.
I believe there have been a number of inconclusive papers already written on this subject.
Regards
Just The Facts Please:
I take your point about the periodicity not matching volcanic behaviour – but think about pilot-induced-oscillation, or any poorly controlled feedback process, you can get very wild inputs that vastly exceed the magnitude of the impulse control (I’m not an engineer so probably have used lousy terminology). Think of a fast moving car where you go through a standing pool of water and over-steer. The steering wheel movements are small and sort of in-phase with side-to-side movement down the road. That’s akin to seasonality in ENSO. But the main direction down the highway is largely decoupled from the steering inputs. That’s your heat inputs (geothermal, atmospheric whatever). About all I do subscribe to in climate ‘science’ is there’s never one force operating in isolation. I wonder how long can you keep fishtailing before you hit an ice-age?
Hardly likely to be correct. Saying the sun can’t do it but volcanoes can is odd. The sun is giving ~1kW/m^2, and its very hard to imagine volcanoes competing with that amount of heat.
“..go to 100 meters…” Looks impressive. Then I went to 1000 meters and there’s nothing there. ??
So, is there a massive volcano there, almost as big as Hawaii, spitting out that colossal hotspot? Or are we seeing something entirely different, e.g. a vortex or underwater topography interacting with currents? If there’s a giant volcano there that creates its own hotspots to the exclusion of all the others in that region, I didn’t find it on my quick search of underwater charts of the region.
The onshore volcanoes in that region erupt quite regularly. In Costa Rica and Guatemala there are volcanoes that spit out rocks and lava so regularly that they’ve built tourist resorts close to them so people can watch, so the idea is not completely nuts. I’m just not convinced that that’s what that hotspot is showing.
As least as far as the warm water coming off the Central American and Peruvian coasts in the last picture, it seems much, much, much more likely that this is an effect of the more efficient warming of water where it is shallower due to the presence of a nascent continental shelf in these locations. Along most of the Pacific coast of the Americas, there is little or no continental shelf and the dropoff to deep, cold water is nearly immediate. However, review of a map showing the sea floor topography shows that the locations where the warm surface water originate are some of the few locations along the Pacific coast where the continental shelf is present. There are no submarine vulcanism immediately adjacent to the coasts of either Central America or Peru which could cause the surface water warming. You can note the presence of the shelf in these areas just by looking at google maps.
The apparent “hot spots” in the 100m depth series is more interesting and I can’t say I have an explanation. However, I think it would be necessary to see a full vertical profile for this area before reaching an conclusion as a submarine volcanic origin (Again, I don’t think there is any submarine vulcanism in the vicinity). If the “hot spots” originated from submarine volcanism, we should see progressively hotter and hotter water with depth. Now there may not be good Argo vertical profile data for this area, I just don’t know. However, if there was such a large volume of hot water rising from the deep, it seems to me it would cause a fairly significant sea level anomaly in that area. Is any such anomaly present?
We have one example of an El Nino corresponding to a underwater volcano erupting. I would suggest you wait until you have at least half a dozen examples before starting the triumphant crowing.
Looks possible. But we need the maths. I suspect that, rather than individual volcanoes, there would be more heat transfer via water passing through cracks in the sea bed over a very large area.
The other thing we need for a hypothesis is a prediction of some kind which can be tested. Of course, if this were climate science you could ignore this last requirement….
I also want to give a word of caution:
there could be other reasons for the warming of that water.
e.g. our atmosphere is a shield. There are massive absorptions going on, all the time, O3 being the leader of the pack (20-25%), leading to re-radiation (deflection) of sunlight.
In other words: that little bit of ozone in the upper atmosphere is responsible for shielding us from 20-25% of all incoming sunlight, and note that it is the sunlight of the lowest wavelengths, i.e. the highest energy.
So, obviously, if the ozone hole (or shield) is bigger or smaller, it will affect the amount of energy being slammed into the (SH) oceans,
and in fact, a small change in the UV output of the sun (solar max/min) , could affect the manufacturing of ozone, in the upper atmosphere, which could result in more (or less) light being thundered into the (SH) oceans, as my results for the past 4 decades also clearly show:
http://www.letterdash.com/HenryP/henrys-pool-table-on-global-warming
Wot a hoot!
Imagine those froot loops from the other side positing just a few months ago the “missing (a.k.a travesty) heat must have sunk down to the abyssal depths and: et voila, thar she blows, albeit UP from the abyssal depths.
Half cocked again perhaps, or possibly even doubled as it’s real hard to imagine that any of ’em could get so silly just playing with one.
And purely coincidental too I’m sure that the concentration/solubility of the oxide of carbon in water is diminished by increasing temperature and soon released into the atmosphere
Thankee Santa, you’ve made my day.
“Last week I postulated that the El Niño/El Niña effect was not due to solar or atmospheric conditions, but actually caused by underwater volcanic activity along ocean ridges off the West coast of South America”
———
Great to see people with different ideas trying to figure things out, but the source of the warm water in El Niño periods is not really a mystery at all– and it absolutely isn’t caused by volcanoes. I suggest Mr. Strata do a whole lot more reading about topics like the SOI and the Pacific Warm Pool, etc.
John Marshall says:
February 15, 2012 at 3:27 am
John, look at this in a different way. The Argo data shows an almost point-source of heated water off the coast of Costa Rica. Given its discrete size it is hard to believe it is related to circulation currents. This leaves the source of this ocean warming undefined. Is it “possible” that yet as undiscovered volcanoes or volcanic vents could exist off the coast and away from the plate boundary? Is it possible for transverse faults to exist that intersect the main plate boundary but allow volcanic activity much further out off-shore? Can you explain the discrete warming event without invoking volcanoes and/or circulation of ocean currents (the latter it seems would not allow warm water to collect within such a small region and there seems to be net heating within the discrete zone – how do you circulate warmer water there through cooler water without it cooling substantially and in fact having the water even warmer once it reaches that discrete region)?
Very interesting post!
John Marshall says:
February 15, 2012 at 2:42 am
———————————-
John, can you explain Bermuda? It is not an atoll or natural topographic high. It is a volcano (hopefully extinct). What is a volcano doing off the east cost of the U.S. nowhere near a plate boundary? Could such a thing be happening off the west coast of Costa Rica?
Not so far-fetched at all, given that every land mass on the planet owes its existence to the constant churning of mantle convection currents, as they move the rafts of continental crust around, smashing it against other bits and thrusting up mountains and the like. If the plates were stationary, they would eventually erode to sea level….and all this harping and carping about climate would be moot–as we would be fishes. That Argo has found one hot spot means we should look for others, as CO2-rich exhalations spew merrily away along 40,000 miles of ocean ridges…and the triple junctions of said…
This will eventually become abundantly clear that plate tectonics does everything.
I think one thing is for certain, what we know now is rarely what we will know later, so before discounting this hypothesis, we should take what we know and give that a vetting first. On first glance, the speed of advancing plates and the width of the accretionary prism at the subduction trench appear to control the angle of the descending oceanic slab, which is also known as the Benioff zone. The common depth for the remelting of the leading edge of the descending slab is about 150km. Above this position is the volcanic arc, which if located beneath a continental landmass commonly presents andesites, an assemblage of remelted, already differentiated oceanic crust from some spreading center somewhere in the ocean and the continental crust melted by the passage of the diapirs rising from the descending slabs remelting and therefore further differentiated again lighter components as they melt and incorporate continental crust as they rise (anatexis).
But there is another curious phenomena much debated in tectonics. What happens when a spreading center itself draws near a subduction zone and then contacts it? This phenomena is occurring at the points where the East Pacific Rise is contacting the north American coast at the Mendocino triple-junction. From there south to where the spreading center reappears in the Sea of Cortez the spreading center is lost.
A spreading center itself is thought to be merely the surface manifestation of a deep mantle upwelling process, the “conveyor belt”, with both denser mineral oceanic crust and thicker, but lighter more differentiated continental crust just the results of this long-lived process.
Below is a discussion from a paper I penned some 27 years ago regarding this “lost section” of the East Pacific Rise:
Direct subduction of the East Pacific spreading center by a westwardly migrating North American plate could be expected to generate rift type extension in the overlying continental materials. Such a setting would not likely generate a classical type of incipient rifting whereby a three armed radial rift system with a rift axis forming along two of the arms eventually opens an ocean basin; however, evidence of a rift axis may be preserved in the Basin and Range Province. Stewart et al (1977) have described a north-south oriented zone of low magnetic relief between longitude 115 and 116 degrees west, and roughly 41 to 37 degrees north latitude. This zone appears to truncate east-west oriented aeromagnetic anomalies associated with a south migrating volcanic front considered by Lipman (in Stewart et al, 1977) to be genetically related to an east-west structural warp in a subducting plate where the dip of the plate changes abruptly from steep on the north to gentle on the south beneath Nevada and Utah.
In other words, north of the structural warp, the subducting plate has passed beneath critical depth (>150 km) for magma generation, while south of the warp, the plate still lies above critical depth. The north-south “quiet” zone contains fairly abundant amounts of calc-alkalic volcanic rocks that in other areas of Nevada appear to produce high-intensity magnetic anomalies. West of the “quiet” zone, extensive east-west oriented magnetic anomalies related to calc-alkalic rocks seem to coincide with similar magnetic features associated with older calc-alkalic rocks in western Utah (Stewart et al, 1977). The “quiet” zone is very likely related to high heat flow and resulting shallow depth of the Curie temperature has destroyed magnetization of the lower parts of the igneous bodies (Stewart et al, 1977; Eaton, 1979). Stewart et al (1977) indicate that: “The quiet zone corresponds to an area where the low-velocity zone in the upper mantle is unusually thick, and such thick low-velocity layers are generally attributed to high temperature and partial melting of upwelling material in an area of crustal spreading.”
Another curious feature of the Great Basin is the presence of bilaterally symmetrical gravity anomalies about an axis between 115 and 116 degrees west longitude (Eaton, 1979), or along the axis of the “quiet” zone. The direct spatial correspondence of these geophysical features is strong evidence for the presence of a spreading axis near the middle of the Basin and Range Province. Christiansen and McKee (1978, p. 304) provide evidence of right lateral offset of basalts that lie west of, but parallel to the “quiet” zone across the en-echelon fractures of the High Lava Plains transform fault in Oregon. These basalts were erupted from elongate north-northwest trending vents and feeder systems about 17 to 14 million years ago (Christiansen and McKee, 1978). The feeder system probably once constituted the axis of extension, but is now offset and parallel, which is what one would expect in an extensional environment. The fact that these rocks are offset north of the High Lava Plains is a further indication of age. The extrusive activity of the plains postdates the north-trending volcanics associated with the spreading center, which is what one would expect of a transform fault offsetting a spreading center. Obviously, the High Lava and Snake River Plains volcanic features are far more complicated than oceanic transform faults, but the similarity is striking.
Some workers (see for example Atwater, 1970; Stewart et al, 1977; Christiansen and McKee, 1978; Barrash and Venkatakrishnan, 1982; Ingersoll, 1982) have provided alternate approaches to the problem of extensional tectonics in the Basin and Range Province. In general, the concept of a subducted spreading center beneath the Basin and Range Province is rejected by these workers in favor of development of a transform boundary with contact of the East Pacific Rise and the Trench. The age of this inferred event varies from 30 to 23 million years ago, with development of either the San Andreas Fault system, or its precursor, near the coastline between the Mendocino and Murray fracture zones (adjusted ages of Atwater, 1970). At about the same time, several triple junctions (intersections between transform faults, trenches, and spreading ridges) were formed at the intersections of the Murray and Mendocino fractures and the trench.
Documented clockwise rotation of the Pacific, Farallon, and associated plates produced migration of the Mendocino triple junction north along the California coastline (Coney, 1978; Barrash and Venkatakrishnan, 1982; Ingersoll, 1982). Continued rotation of the oceanic plates relative to the North American plate eventually produced a realignment of the spreading axes of the East Pacific Rise to a near parallel orientation with the coastline, as well as growth of the San Andreas Fault -transform boundary, by about 5 million years ago. Christiansen and McKee (1978) proposed that extension took place in the Basin and Range Province as a result of transform motion and its effect on a hot, ductile crust. Ingersoll (1982) has suggested triple-junction instability as the cause for Late-Tertiary extension. As the Mendocino triple-junction has migrated up the California coast, and the Pacific oceanic plates have rotated clockwise, transfer of material from the North American plate to the Pacific plate has occurred along the San Andreas Fault (Ingersoll, 1982). The original extensional stress field orientation was east-west, but due to Pacific plate rotation, it is now oriented approximately northwest-southeast (Ingersoll, 1982). An ensialic marginal basin origin has also been proposed by various authors (for references see Thompson and Burke, 1974, p. 234), but the Basin and Range Province is a region of broad uplift, not of subsidence as observed in ensialic marginal basins around the Pacific (Christiansen and McKee, 1978). Only in the vicinity of the Columbia Plateau does the concept of basaltic volcanism and subsidence of several million years behind an arc fit the model of an ensialic marginal basin (Christiansen and McKee, 1978).
The exact cause for Tertiary extension is not presently known. The Tertiary structural and volcanic history of the region is very complex, and not entirely supportive of any present hypothesis. Christiansen and McKee (1978) state: “The concept of an overridden East Pacific Rise, once widely popular is no longer tenable from a plate tectonics view of the role of spreading mid-oceanic ridges. The ridges are now recognized as results rather than causes of plate divergence…” Such a statement represents a surficial treatment of the spreading center concept. The spreading centers themselves are merely the surface manifestations of a deep-seated mantle upwelling that is generally of a long linear nature. Suggesting that subduction of the surface manifestation of such a process is sufficient to quell the deep-seated process can also be seen as an untenable concept. For the American, Asian, and African plates to be pressed apart by thin, non-deforming oceanic plates spreading in the central Atlantic argues for a much smaller role of the structural rigidity of these plates in tectonic processes. It would appear that the continents, as well as the oceanic plates, are riding on a sort of mantle driven and supported “conveyer belt”, which can generate the appearance of a thin oceanic plate pushing a massive continental plate without deforming the oceanic plate or the contact margin (as is the case with passive type Atlantic margins). If collision of a spreading center with a trench is sufficient cause for cessation of mantle upwelling, then obviously deep mantle processes are more profoundly affected by their surface manifestations than anyone presently suspects.
In essence, what is needed to support AJ Strata’s hypothesis is the presence of a vent in a compressive converging plate environment. This could, repeat could, be accommodated by the presence of a converging or possibly recently subducted portion of a spreading center somewhere near the trench. I do not have the time here before toddling off to work to research it. Perhaps those armed with the above and that have the time could look into where any spreading centers are located in relation to the observed origin;s of AJ Strata’s thermal anomalies.
The 30°-50° F degree difference between ocean floor temperatures and surface hot water temperatures are insignificant when cold ocean crust meets earth’s internal temps. Bluntly put, the ocean floor’s temperature is not what causes subduction zone volcanos to be distant from plate boundaries.
Mantle wedges with flux melt volcanic incidences are examples of volcanoes near subduction points. Hot spots further add confusion to exactly where earth has surface internal heat exposures.
Anthony:
You have access to the premium version of Google’s Earth, so you may get better resolution when checking this view. When I flipped between your hot spot pic and Google’s underwater Earth on my not premium version it is a very intriguing match. There appears to be significant faulting with under sea ridges and surface mounts where you’ve identified the hot water plumes.
Looking up the West NA coastline, I see that Google also has placemarks for other underwater volcanos, (e.g. Northern EPR segment RO2, http://www.volcano.si.edu/world/volcano.cfm?vnum=1304-02- , http://www.volcano.si.edu/world/region.cfm?rnum=13 )
Perhaps this concept has serious merit and not just volcano aerosols need to be observed and once understood – modeled (We’ve already observed the inanity of modeling without full understanding in the extant climate models).
Robert Felix has of ICE AGE NOW, has been postulating this theory for quite a while.
The enormous amount of heating needed for the temperature fluctuations of El Nino & La Nina would seem to indicate that surface air and radiant solar heating would not be enough energy.
This is why we do not heat a cold bath tub with hot air from a hair dryer, for instance.
As time goes by we are finding huge mountain range sized volcanic areas and the number of undersea volcanoes has been postulated to be in the millions. There is a Himalayan sized volcanic mountain chain in the arctic, for example.
It makes sense to me that superheated sea water welling up from volcanic activity must have some measurable affect on ocean temps, if not the main driver.
I’d suggest that geothermal heat affects the West Pacific more. Warm salty waters collect in the abyssal deep held down by the less salty continental run-off. Eventually, like a lava lamp, globs of abyssal warm water contact the West Pacific Warm Pool and El Ninos predominate. After 30 years or so the abyss is drained and La Ninas dominate while the abyssal reservoir recharges, for 30 tears on so.
As some older news, there’s been knowledge of megaplumes for quite some time.
http://news.nationalgeographic.com/news/2005/12/1212_051212_megaplume.html
Brian Handwerk for National Geographic News December 12, 2005
Hydrothermal megaplume in the Indian ocean that covered some 43 miles (70 kilometers) in length, as well as mention of a study (not cited) that suggests a far larger volcano-ocean heat flux than previously believed, potentially in this single plume up to 100,000 megawatts.
http://www.nature.com/nature/journal/v393/n6686/abs/393643a0.html
Nature 393, 643-647 (18 June 1998) | doi:10.1038/31397; Received 20 January 1998; Accepted 14 April 1998
http://discovermagazine.com/1999/mar/megaplumes
Not a new branch of science, not much talked about.
http://www.pmel.noaa.gov/pubs/outstand/bake1050/discuss.shtml
Well, have fun folks!
Crustal temperature does determine subduction. The subducting plate must be denser than that of the overriding plate. Crustal density is determined by temperature and the heavier crust is subducted.
Bermuda was formed by a mantle hot spot, like Hawaii, then modified by coral reef structures. the hot spot seems to have died out. So no more eruptions.
I repeat, at the position of hot region that seems to originate from below the surface, off the coast of Costa Rica, there is no volcanic activity because of the subduction boundary. whether there is any at triple junctions is not known but even off the coast of Peru there is no obvious volcanic activity at the junction probably because of the subduction.
I can’t imagine it would be what “causes” El Nino/La Nina in the sense that if it didn’t exist, we wouldn’t have El Nino/La Nina. I could imagine it could have some impact on relative frequency, however. Tho it is often PDO phases that get pointed at for that.
There is a known “ring of fire” cyclical, isn’t there? We’ve been on a upswing of that during the most recent warming period? I would think that would imply that plate boundary sub-sea volcanos are being more active as well, and, maybe, enough so during that period to have increased the incidence of El Nino. I don’t think the known PDO cyclical matches the ring of fire cyclical however, so even if there is some contribution figuring out if/how they reinforce will be more complicated than just saying “the cyclicals match –ta da!”
http://www.theage.com.au/environment/climate-change/scientist-accepts-cash-for-climate-20120215-1t7ho.html
Care to comment Anthony?
But, but, but….
How can the heat be coming from below if it doesn’t show up in the 1000m data?
It’s gone missing…
AJ Strata writes: “The Peruvian region I highlighted in the previous post and is linked to the Pacific Rise. Higher volcanic activity in these areas clearly cause more warm water to rise and heat the surface, creating the conditions for El Niño. Lower activity allows the cooler currents to dominate, bringing on El Niña [sic].”
The warm water for an El Nino comes from the west Pacific Warm Pool, not from the coast of Central America. There’s a very good, and very basic discussion of ENSO here:
http://faculty.washington.edu/kessler/occasionally-asked-questions.html
And in my (just-published) ebook here:
http://bobtisdale.wordpress.com/2012/02/15/ebook-if-the-ipcc-was-selling-manmade-global-warming-as-a-product-would-the-ftc-stop-their-deceptive-ads/
Re Surfer Dave’s SMU map. Note the units: 25 milli-Watts/m^2.
Here is a link back to Jan 13 “Earth Baseline ..” for a good marine heat flow map in a
But, as a source of localized heating that could influence current flow, it’s an idea worth evaluating. Also keep in mind that current flow by depth can change greatly. Figure 2 in Interannual atmospheric variability forced by the deep equatorial Atlantic Ocean, Brandt-2011, Nature 473,497–500(26 May 2011). show surprisingly rapid reversals of E-W and W-E current flow in as little as 300 m of water depth.
When I became convinced that a sudden change in land surface temperatures took place in the NW Atlantic region (Iceland, Southern Greenland) in the early 1920s (1922, perhaps in September) I contacted a Norwegian Professor who was studying volcanism in the arctic, north of Siberia. (Incidentally I still believe this!). I suggested that my hypothesis of an approximately 1 deg warming in places like Nuuk and Reykjavik might be due to under-ocean heat upwelling, possibly on the plate boundary, she told me that in her work she was hoping to measure temperature changes of one hundreth of a degree due to undersea volcanoes.. Clearly her opinion was that her volcanoes could hardly contribute to real changes in ocean temperatures.
The way I look at things, the main value of any hypothesis is the ability to foretell the future. Now, to date, the record of people forecasting what will happen to El Nino/La Nina is not very good. What does this hypothesis forecast for the future development of ENSO? If the forecast turns out to be consistently correct, then the hypothesis may have merit.
If any of this is true then there should be a lot of water out there that is less dense than the water around it. GRACE should see that, and the sea level should show a depression in the plume area. Other knock-on effects – the ARGO floats should reveal uncharted waters – there’s no way an ARGO float is going to remain in the area of plumes – they will be pushed aside, and even in the plume the energy level to maintain depth against rising warm water should show up in the energy budget of the floats. There are more dots to connect before this story can get traction.
Color me skeptical.
This subject is very interesting. Daniel Walker, now retired, published several articles suggesting that El Ninos were highly correlated with increased vulcanism on the sea floor in the East Pacific Rise, in particular near Easter Island, where he had installed instrumentation to measure earthquake activity, a likely proxy for increased volcanism on the sea floor. Here is a link to a 1995 article on the subject, “Hot Vents in the Sea Floor May Drive El Nino”:
http://www.nytimes.com/1995/04/25/science/hot-vents-in-the-sea-floor-may-drive-el-nino.html?pagewanted=all
Walker’s theory has yet to be accepted, but perhaps it will be at some point.
As Bob Tisdale correctly points out, the east Pacific rise near Easter Island, where Walker put his seismographs, is thousands of miles from the coast of Costa Rica. So there is the obvious difficulty of no direct relationship that we can see between warming of very deep waters well south of the equator and warming surface waters off western Central America.
But this might be too simplistic a criticism. Suppose that a large increase in warmth of deep waters rose to the surface in the areas south and east of the Galapagos. This would essentially cut off the rise to the surface of the cold Humboldt current, which in La Nina makes waters around the Galapagos cold. Looking at the animation we can click on, in El Nino years, the Humboldt current cold area is limited to a narrow band of the Chilean and Peruvian coast.
There might be something here, but we need more explanation. If it turns out that El Ninos are driven by vulcanism, is there a cause for the rhythm of volcanism in the East Pacific Rise?
I really do appreciate the work done by people like A J Strata, especially since they do it unpaid on their own time. So thank you A J and Anthony for giving this conjecture air time.
My understanding of the ENSO phenomena is as follows:-
There is continual upwelling of cold water along the coasts of Chile and Peru. These cold waters travel along the deep only to rise up due to the shallow coast line.
The default condition for the equatorial Pacific is one of very warm surface waters due to the strength of solar insolation. El Nino is the default condition if you will.
When the upwelling along the SA coast increases (reasons as yet not fully understood), those cold waters spread out and away from the coast line and begin to affect the atmosphere above, causing the trade winds to strengthen.
These trade winds push the cold surface water westward, with the warm water ahead of it piling up against the coasts of Australia and Papua New Guinea. This ‘warm pool’ can be as much as one metre higher than the ocean further east.
These trade winds also have a strong cooling effect on the surface water.
When the cold upwelling slows down to ‘normal’, trade winds subside and can even reverse. In fact this is what’s happening right now.
http://www.pmel.noaa.gov/tao/jsdisplay/plots/gif/sst_wind_anom_5day_jsd.gif
As the trade winds die down, the previously piled up warm water along the Aus PNG coasts start to slosh back eastward.
Eventually, almost all of the equatorial Pacific surface water returns to a warm phase.
When the PDO is positive, it enhances El Nino conditions as it has done late in the 20thC
When the PDO is negative, it enhances La Nina conditions as it has done with the 2011 and 2012 La Ninas and those in the 60s and 70s.
If and when we understand what causes the upwelling along the SA coast to change and the time line involved, we’ll have a better grip on the ENSO phenomenon.
CO2 has nothing to do with ENSO, and I’m afraid volcanos and underwater vents are in the same boat until and unless more evidence is presented as Bob Tisdale suggests at 5:03am Feb 15th
But, … he didn’t correlate it with volcanic activity yet. I mean, if you’re going to correlate A with B, then it’s not simply a case of showing measurements of A and assuming that it must be correlated with B. You also have to show measurements of B. That’s what correlation is all about, and that’s not even the science part yet: proving that the correlation between A and B is caused by A or B. Apart from saying that there are fault lines in those areas, the blogger hasn’t shown any volcanic activity figures/statistics. And even if (a really big if) there was a correlation between El Nino and volcanic action (which would require cyclical volcanic action!), it’s a long, long road to proving, in a scientific sense, that the correlation is caused by volcanic action.
Megaplumes from the Carnegie Ridge cause El Niños?
In 1988 we published a book on seabed features dealing with fluids leaking up from the sub-seafloor, including so-called hydrothermal vents. By 1988, the first ‘Megaplume’ had been observed in the East Pacific Ocean (see Anderson, 1987), over the Juan de Fuca spreading ridge. A large plume of anomalously warm water was discovered measuring 19 km across and about 1 km in height (above the seafloor).The top of the plume was about 1.3 km below the ocean surface. The enormous excess heat in the plume was estimated to represent about 10 billion kWh of energy. The venting, which terminated after about 10 days, was found to be equivalent to the yearly output from 2000 small (normal) hydrothermal vents. Based on this observation, we speculated that there may be a close link between mantle convection, and/or the subduction of heated ocean crust slabs, and regional ocean surface warming (Hovland and Judd, 1988, p. 258),.
Thus, the main driver for for the El Niño would be hot water contained in the a-seismic Carnegie Ridge, located between Galapagos and mainland Equador. The warm water mass would be released as a 10-fold Megaplume due to a regional earthquake or some tectonic disruption. The erratic nature of the El Niño is also a reason supporting this hypothesis.
References:
– Anderson, I., 1987. ‘Megaplumes’ tips the balance in the oceans. New Scientist, 112, 1540/1541, 24.
– Hovland, M., Judd, A.G., 1988. Seabed pockmarks and seepages: Impact on Geology, Biology and the Marine Environment. Graham and Trotman, London, 295 pp.
For further information on Megaplumes see also:
– http://news.nationalgeographic.com/news/2005/12/1212_051212_megaplume.html
– http://discovermagazine.com/1999/mar/megaplumes
– http://www.sott.net/articles/show/210023-Ocean-Warming-Not-Global-Warming-Hydrothermal-Megaplume-Found-in-Indian-Ocean
And on the Carnegie Ridge:
– http://adsabs.harvard.edu/abs/2005AGUFM.T13D0506D
– http://www.sciencedirect.com/science/article/pii/0012821X72900209
John Marshall,
This does not have to be a volcano in this region to be the source (I think volcanoes off the coast of Peru and the Pacific Rise are the more likely source). I see more of the Yellowstone model, with cyclic ‘boil ups’ through the cracks of the subduction zone.
I agree with John Marshall. There’s no significant submarine volcanic activity off the coast of Costa Rica. The Central American peninsula lies where it is because that is where the subduction melts rise to the surface above the subducting oceanic slab, far east of the subduction trench.
More to the point: El Nino-La Nina temperature patterns are defined in space and time across the equatorial Pacific and they oscillate with observable frequencies. There is no spatial/temporal correlation between submarine volcanism and El Nino-La Nina, and no known decadal periodicities for volcanic activity.
The discussion about volcanic heating of sea water is immaterial to the El Nino-La Nina patterns
Those who speculate that the atmosphere heats the oceans (in any significant way) should try warming the bath water with a hair dryer. Good luck with that.
Perhaps KNOWLEDGE of the atmospheric circulation in Central America would be of help? May I suggest Dr. Emmanuel Barbier PhD thesis and the argo “hot spot” may find a more mundane explanation…
http://tel.archives-ouvertes.fr/docs/00/04/73/65/PDF/tel-00007550.pdf
The dynamic of weather and climate in Central America
The Central American isthmus is characterised by a lowering of the relief which supports the aerological communication between the Atlantic and the Pacific. Because of their power and drain exerted by the relief, the Moving Polar Highs (MPHs) penetrate deeply in the tropical zone. The displacement of the MPHs and their progressive deceleration in direction of the Tropics, the meeting of the continents and their relieves and the effects on the mass flow form Anticyclonics Agglutinations. The MPHs get agglutinated and the Lines of Pulsation become gradually the trade winds and/or monsoon circulation. Tropical flows of the two weather hemispheres meet along the Meteorological Equator. The Central American isthmus constitutes a single climatic crossroads in the world. The study of the disturbances gives the key of dynamic analysis of weather and climate in Central America. Recent climatic evolution shows a modification of the style of general circulation since the Seventies.
mots-clés en anglais : Mobile Polar High (MPH) – Anticyclonic Agglutination (AA) – Pulse Line (PL) – Trade/Panamanian Monsoon – Meteorological Equator (ME) – Vertical Meteorological Equator (VME) – Inclined Meteorological Equator (IME) – Nortes/Northers – Temporales – Cordonazos
OT, but important nevertheless…
[snip see the thread on the main page ~mod]
Strata has shown an obvious change. To Anthony’s question: “Do underwater volcanoes have an effect on ENSO?” the answer must be “Yes” – by the butterfly effect.
The more important question is whether the effect is detectable or how significant it is.
Bob,
Yes, the next step is to stitch theory to hard data. I began to dig into earthquake and volcanic data to see how it maps in. I was going to look at specific Argo float data until I saw this and realized it answered the first question – is there hot upwelling.
Recall the hotspot seen at 100m down is the size of a large county or small state. When it finally bursts to the surface it will spread out.
Now, do I have the time to take this home? No. My first day job is running a small aerospace company. Second one is getting satellites on orbit. 3rd, family. 4th, family …
What I hope is someone takes this home and gets the credit for knitting it all together. I have enough space system, planetary experience to know this is the right answer and will be proven. While circumstantial, it is overwhelming.
Among the major problems with this idea are (1) the volume of water required to heat is huge relative to the amount of possible heat from a volcano (like trying to heat a bathtub with a cigarette lighter), (2) volcanoes erupt sporatically for only a year or two, and are then dormant for long periods, and (3) volcanoes don’t turn on and off with a regular cycle like ENSO (which has been going on for a long time). Volcanic eruptions causes of climate change just don’t work because of this. Look elsewhered for the cause of climate change.
You’re naively using data (or, more properly, a visualization) produced by someone else, this is not a good idea. There’s ~3500 Argo floats in the entire ocean, so there’s a lot of interpolating going on between casts made by those floats (they’re presumably using things like the TOGA TAO array along the equator too). Interpolation routines are prone to artefacts, and sometimes produce little “bullseyes” where there’s no data if the interpolation is too fine. That’s most likely to occur near the coast too, which is where the density of floats is generally lowest (they don’t go up on the continental shelf). If you wish to be credible, you should look at the data yourself – it’s freely available on the web.
Take this with a grain of salt. I was wondering if these underwater volcanoes influence the strength of a La Nina or an El Nino. Was the El Nino of 1998, for example, an ordinary one but which had the enhancement of some strong and well timed underwater volcanoes to make it a super El Nino?
DP,
Willis posted a few days ago on Argo Floats and noted how they do not stay in this region due to upwelling:
http://wattsupwiththat.com/2012/02/06/where-in-the-world-is-argo/
“In other areas, such as off the westernmost point of South America and the area on the western side of South Africa, the cause for the lack of samples seems to be the local upwelling in the areas. Presumably, since the water is radiating outwards at depth as well as at the surface, the floats are moved away from that area.”
It was this comment that led me to Argo data.
And if you follow the floats in the area (3900878-3900791) you see his is correct.
J Storrs Hall says:
February 15, 2012 at 2:45 am “…By a hurried back-of-the-envelope, it’s not totally ridiculous….”
Slow down, and do an unhurried back of the envelope calculation. Your mega-volcanic blast, with all that heat going to raise the temperature of water, is off by at least three orders of magnitude. 10**19 joules volcanic heat; 10**21 ml water; spec. heat water 4; 2.5˚C increase in T.
A very interesting line of research. An excellent Doctorial thesis. Should also look at the biologic activity associated with the ocean floor hot spots/black smokers. There may be enough combined energy in the geologic/biologic systems to modify ocean currents.
I don’t want to sound negative, but before everyone goes off on a tangent, there is one other point to consider,
and that is that we must assume that for the past 3 or 4 decades the volcanic activity has been more or less constant, or why should it have increased? So it cannot be directly pointed to as a source or reason for global warming. In fact I can prove what is causing the global warming that is not global.
I have now statistically analysed the daily results of 22 (surface) weather stations,
randomly chosen, balanced by latitude & 70-30 sea-land
and the results show me that, since 1974,
Maxima have risen by 0.047 degrees C per annum in the SH and by 0.027 degrees C per annum in the NH
Average temps have risen by 0.000 C per annum in the SH and by 0.029 C per annum in the NH
Minima have declined by -0.017 C/yr in the SH and increased by 0.034 C/yr in the NH.
http://www.letterdash.com/HenryP/henrys-pool-table-on-global-warming
So, what happened? Note the results for maxima.
the extra heat from the sun (due to higher intensity sunshine and/or less clouds and/or less ozone/ etc)
is going into the SH oceans and it is taken by weather and wind and currents to the NH.
In the NH, some of it is trapped, as witnessed by increasing minima, partly due to it having a bigger landmass and increasing greenery.
Your premise is that the sun and atmosphere cannot warm the Humbolt current that much and that it requires volcanic activity. However, the Humbold current heads west off the coast of Peru, not Costa Rica or SW Mexico where the Argo data indicates the strongest hot spots. Revise your premise.
Volcanic heat can certainly play a part in warming the ocean, witness the Antarctic peninsula warming from the undersea volcanic activity there. However, both Costa Rica and SW Mexico are north of the equator and El Nino, LaNina is primarily a SH phenomenon.
Bill
I will remain skeptical of this idea. el Nino/la nina are way too periodic. The effects way too broad
AJ Strata “…It is infeasible that El Niño can arise from atmosphere and sun alone by warming this mass of water. Neither air temp or solar radiance change enough to cause this phenomena….”
It would seem that the map you post is a perfect test bed. In the space of an area 10˚ lat x 10˚ long the water goes from green to orange, whatever that signifies in actual temperature. Willis has posted some stuff here showing that area and the water in it could receive 500 to 1500 watts/meter**2 for maybe 10 hours per day – and lose some back to cooling all the rest of the day.
The numbers are in the link here:
http://wattsupwiththat.com/2011/08/14/its-not-about-feedback/
Given some reasonable assumptions you should be able to calculate whether or not that kind of change related to solar heating can occur in that distance. I’ll guarantee you that volcanism has not one thing to do with it. Go take a look at J Storrs Hall’s (February 15, 2012 at 2:45 am) post and do the math there.
I’ll side with John Marshall and Bob Tisdale, and so won’t repeat the things they have written.
It appears to me, though, that folks need a better grasp of Earth with regards to (a) shape & size, (b) volumes & flows, and (c) time. I do not know of single papers that present expositions of the first two of these. They just require lots of reading. On the last of these (time), the essays of Stephen Jay Gould might do, as in his writing on “Deep Time.”
—————————————
Regarding what John Marshall wrote @ 6:27: Bermuda is explained in the link below. Its build-stage began about 45 million years ago.
http://www.bermudaislandfacts.com/index_files/Geology.htm
For a time context, the land link between North and South America (Isthmus of Panama) formed about 3 million years ago.
And for context regarding temperature at depths and heat flow:
In northern Idaho’s Silver Valley, at several thousand feet under the surface (been there), rocks are so hot they can’t be touched with your bare hand. 10 feet under the surface layer the ground is cool to the touch. At the surface, in June, one might question how all that hot rock down there passed heat to the surface without warming your deep garden soil !? In late December, the ground surface is frozen and snow covered. Therefore, I think that one has to discount the internal heat as a significant factor for ocean and atmospheric heating. Geologists have examined this issue – search with “geothermal gradient”, and investigate.
May I ask something, following Socrates mayeutics?. And what does it cause such an increase in volcanic eruptions?
Maybee this solar systems gravity push and pull changes(planetar instabilty,)gravital instability, is responsible for both Solar changes and earth teknotinic changes, at the same time?
You say:
“It is infeasible that El Niño can arise from atmosphere and sun alone by warming this mass of water. Neither air temp or solar radiance change enough to cause this phenomena. ”
And then list no supporting facts…you’re not very good at this whole ‘science’ thing, are you? Maybe more practice would help?
Information from 100m down card
2007 / 05-02
2007-2008 10-31 / 05-21
2008-2009 10-01 / 06-03
2009-2010 10-28 / 06-16
2010-2011 10-13 / 05-05
2011-2012 11-30 /
. Alway from October/ November until May /June.
“But I simply can’t see enough energy in this venting to account for the massive energies dissipating in ENSO events.”
The question you have to ask is how an undersea volcano change the trade winds. I don’t believe it can. Also, the Eastern Pacific has actually been trending cooler. But in any case, the change in surface temperature is quite consistent with the change in trade winds. When the trade winds pick up, surface evaporation increases and the equatorial pacific cools. Same things happen in the Atlantic. When the trades slacken, temperature at the surface increases. And as you mention, there just isn’t enough energy from a volcano to heat up that much water over that much area.
Also, when there is a La Nina condition, the Western Pacific Warm Pool increases in temperature. Does this imply that when one volcano in the Eastern Pacific stops, one in the Western Pacific cranks up and the two are exactly 180 degrees out of phase?
The point is that the temperature anomalies can be explained by wind anomalies. Take a baking pan and put a dish towel in it. Add a couple of cups of water. Shine a heat lamp on it. Take the temperature of the towel after it stabilizes. Now turn on a fan blowing on the towel. Take its temperature again.
This is not to say that there ISN’T significant volcanic activity under the ocean off of the West coast of equatorial South America as there very likely is. Where the Cocos and Nazca plates meet is a spreading center like the mid-Atlantic ridge is, only much shorter. Same with where the Cocos and Nazca meet the Pacific plate. This would have been the original “mid-Pacific ridge” but most of it has now subducted under North America in the Northern Hemisphere and only the Southern Hemisphere portion remains except for a few small bits off the coast of Oregon and Washington.
But I believe it is a bit of of a reach too far to say that any volcanically induced upwelling off the coast of South America is the CAUSE of these cycles. I would say that at times we might see such upwelling corresponding to a cycle, and at other times not. The cycles of the trade wind patterns match cycles of pressure gradient changes in the atmosphere which match changes in regional ocean surface temperature. My guess here is we have a case of mistaking a period of correlation with causation.
John F. Hultquist says:
February 15, 2012 at 9:20 am
——————————————
John, regarding Bermuda I recall a paper describing a drillhole 430 m deep that intersected two separate layers of volcanic rock, one age-dated to 90 Ma and the second to about 34 Ma. That paper suggested Bermuda was formed along the mid-Atlantic ridge when the Atlantic was much narrower. Problem is that the first pulse is explained but the second pulse would have the mid-Atlantic ridge over 1,000 km away. The second theory regards Bermuda as a mantle plume. Both pulses are explained as these hot-spots stay in the same place over a long period of time and originate deep below the crust (so they wouldn’t move by ridge spreading).
Back to the hot spot off Costa Rica … we have a real measurement that seems very discrete and I can’t see how it can be linked to circulating currents without additional heating. Whether it controls climate in any way we don’t really know. But the anomaly is still there waiting to be explained. Could there be a mantle plume forming a new volcanic island off the coast of Costa Rica?
Baa Humbug – Thanks much for the Hat Tip
JimF: yes, off by exactly three orders. I was thinking Calorie on one end of the calc and calorie on the other.
The one flag I will throw preliminarily is that the study attempts to show that gyers, and not solar output, causes el Ninos. Why place the theory in competition like this when the two aren’t mutual contradicting to begin with?
Maybe we need to establish whether the varying magnetic influence on the Earth by the Sun affects volcanism?
Tom Rude, Bob Tilsdale, et al –
First off, that plume is 100 meters down not at the surface. So when you can explain how trade wins caused that to happen I am all ears.
Also, when you run the surface animation – the currents are flowing East-West (as they do at 100 meters down).
Again, the trade wind model cannot explain this as far as I know.
Proper Analysis Required,
I noted the Argo data was sparse and why much of the other up wellings may have been missed.
Folks, this is not a scientific paper! It is a hypothesis with strong supporting evidence. I suspect some enterprising folks will have access to the right data to confirm or reject the idea. All I wanted to was open discussions and see if it made sense. Sounds like it is more than plausible, but not yet proven.
Rizzo,
LOL! Knock yourself out and show me how its done….
In fact, compute how much air/solar energy is required to warm the Humboldt current on the South and its companion in the north. Prove it – know one is holding you back!
When you’re done and you realize the amount of heat required to raise that much water that many degrees (and that deep down) would roast (or boil) most organic life, wel can have the next round.
Sorry, but go back to studying South America waters. The warming that you noticed on the west side of Central America is not from volcanoes.
It’s winter in Central America, and that means that it is mountain jet season. You’re not seeing the warming in deeper water because this heat is roaring between the mountains and down onto the surface of the water.
AJStrata says:
February 15, 2012 at 10:18 am “…It is a hypothesis with strong supporting evidence….”
I beg to differ. It has no supporting evidence – for virtually every element of it. I, as a geologist, like “arm-waving” but that’s when there is really no way to make a sensible calculation. Here, you have lot’s of data on which you can make some reasonable estimates. Instead, you ridicule those who tell you to pick up a pencil and do some googling, and then reiterate your “hypothesis”.
In my 10:50 post, “lot’s” should be “lots”.
If this hypothesis is correct, I would expect it to be correct in the form of a highly nonlinear amplification — the source of nucleating fluctuations that drive a global oceanic current oscillator with a very long period, whose actually primary energy input is probably solar.
The way it might reasonably work is by providing a nontrivial source of heat over “large enough” areas right at the bottom of the ocean. Ordinarily the temperature there is a boring and static 4K within a hair, but there may be enough heat to actually warm the water significantly above this temperature — that’s the kind of thing Argo data will eventually answer. Warmer water will of course experience an enormous buoyant force and create a large semi-permanent upwelling zone that bridges the thermocline and the depths.
Upwelling in one place has to balance downward transport everywhere else, so this sort of thing both facilitates the storage of solar energy in a larger volume of water and its eventual release. It might well act as a modulator in a global transport system that blocks transport of water from the tropics so it becomes anomalously warm, then suddenly gives way and lets a large bolus of it move through relatively quickly to suddenly warm a place that has cooled. This sort of chaotic semi-periodic oscillation is not uncommonly seen — or heard — in differentially heated flowing fluids with some sort of resonances in the convective roll dynamics.
However, that’s all talk. To move beyond the bullshit stage, it might be good to build a very simple toy “ocean” (one with a relatively simple geometry) and solve the Navier-Stokes equations, even approximately, numerically. Heated from the top and with only ordinary transport and no feedback, one might well end up with stable tropic-to-pole lateral convection on top of a nearly stable thermocline (what one in fact sees in most of the ocean, with the shape of the rolls determined by a lot of things and with variations in salinity and density being as important as just raw solar-driven differential heating and thermal expansion in helping to drive the system).
Turning on heating in selected areas on the bottom, one could at least get an idea of the kind of things the ensuing deep vertical transport (if it emerges) can do to the surface patterns. If driving chaotic semiperiodic oscillations with significant amplitudes is one of them, that would be close to a smoking gun.
That leads to fascinating co-hypotheses. Continental drift and tectonic subduction is perhaps at least partly driven by tidal forces and may well have resonances with the lunar cycle, not “monthly” but longer period variations in eccentricity driven by orbital resonances. If heat production in the hot zones is thus modulated, that could be all that is needed to provide the nucleating period that is then nonlinearly amplified in the global convective system.
In the meantime, I have no good feel for the orders of magnitude of the key numbers or the likely size of the effect. The pictures above are very interesting — they more or less prove that they are large enough to have a macroscopic impact on SSTs and affect the distribution of heat for much larger pieces of ocean than just the “hot spots” themselves. This isn’t quite evidence that they can feed back into a driven global resonance and help sustain it.
rgb
I’m also happy enough to bow to crosspatch, who sounds like he has thought about a lot of this more than I have and whose input I generally respect. My previous post was more in the line of a thought experiment — if the hypothesis “geothermal heating at the bottom modulates (some) global oceanic oscillations” how might it happen? and everything…;-)
I think there is general agreement that there isn’t enough heat to have any globally significant direct effect. El Nino is (almost certainly) not simply extra heat produced by the Earth, the energy it releases is solar energy one way or another. However, relatively small perturbations can make big global changes in turbulent convective flow, and small periodic perturbations can easily be phase locked and amplified if the potential for positive feedback in a bands of frequencies that includes the perturbation exists. You can demonstrate this with e.g. microphone-driven audio feedback pretty easily, but the idea is more general.
OTOH, trade winds or the solar cycle itself are just are reasonable sources for frequencies to feed back and amplify, although the former could be as much effect as cause, could they not? I rather like having an external frequency source to phase lock to, because the large decadal oscillations are quite perisistent and at least moderately stable. Since they are clearly so very important in the climate, it would be nice to know that ENSO isn’t going to spontaneously period double or period halve (as it might, if it is purely internal nonlinear feedback driving an essentially chaotic oscillation). An external driver or drivers can stabilize a system just enough that this sort of thing is rare, at least.
But as I said before, this is all really bullshit until someone does a lot more work, with Real Math
rgb
It doesn’t seem like underwater volcanoes can do much in terms warming the surface, but can they cool the surface and/or cause movement of ocean waters?
Could warmed deep water does cause plumes of rising water?
And by time very hot water get to surface it could colder than the surface water, so not warming as much a mixing, affecting various larger ocean streams.
Suppose warmed as body gains vertical velocity, and continues upward despite cooling to existing surrounding water- in this way hot volcanic water could cool ocean surface temperature.
AnonyMoose says:
February 15, 2012 at 10:30 am
It’s winter in Central America, and that means that it is mountain jet season. You’re not seeing the warming in deeper water because this heat is roaring between the mountains and down onto the surface of the water.
So I was right when I said:
Robertvdl says:
February 15, 2012 at 9:43 am
Alway from October/ November until May /June.
But I did not know the reason why. Thanks AnonyMoose .
J Storrs Hall says:
February 15, 2012 at 2:45 am
There might be an error there. Wikipedia puts the eruption of the Krakatoa volcano, one of the largest ever, at a hundredth of your number, 10^17J. But even taking 10^19J, I think you’ve made a mistake. I get a 2.5° warming to 20 feet over only about 50 thousand square km, not 50 million. Here’s my numbers.
1.00E+19 joules availble
4.00E+06 joules/tonne/degree
2.50E+12 tonnes raised by 1°
2.42E+12 cubic metres raised by 1° (sea water is slightly more dense than fresh)
1.21E+11 square meters 20 metres deep raised 1°
120,968 square kilometres 20m deep raised 1°
48,387 sq. km 20m deep raised 2.5°, or 0.01% (a hundredth of one percent of the ocean surface)
Check my numbers, but I think that’s correct. If so, even Krakatoa couldn’t do much … and that was one of the largest volcanoes in history. So I’d have to say the numbers are way, way too small for undersea volcanoes to affect El Niño.
w.
Karl Popper presents a falsification:
So how much energy are we talking about here? The parameters are 100 m deep of water, ? m^2 area and delta T. Fill in the blanks.
So on your back of the envelop calculation how much energy is required?
What is the average energy output of a volcano? How many average volcanoes would it take to equal the estimate? Is the result reasonable?
Before anyone says it’s possible or not possible, an informed estimation is in order otherwise you are not advancing the cause of science. Is it falsifiable? Can it be falsified? Is sunlight the only source of heat energy input to the oceans? If not, can the tidal (gravitational) energy of the sun and moon deforming the earth’s crust partially create the conditions observed via volcanoes? Is tidal energy cyclical? What are the cyclical periods? Do any of these periods show in the observed data?
Of peripheral relevance……….
‘Submarine Geothermics; Hydrothermal Vents and Electricity Generation’
http://www.iingen.unam.mx/es-mx/SitiosWeb/Proyectos/Impulsa4/Publicaciones/Documents/Submarine%20Geothermics%20Hydrothermal%20Vents%20and%20Electricity%20Generation.pdf
My synopsis (with added “rough” estimate):-
Of the 67 000 km of Ocean Ridges that are constantly recharging their thermal activity by the uprising of magma, so far 13 000 km have been studied representing 20% of the global ridges of the world. There have been reported 280 sites of hydrothermal vents along the ridges.
Hydrothermal vents in the ridges can be so extensive that plumes of heated water (60 °C up to as high as 464 °C) are continuous for upward of 100 km along axis.
13 000 km of explored ridges with a ph of 0.3 gives the equivalent of a long active ridge of 3 900 km long. An average width of this equivalent vent as 10 cm and a flow out at a velocity of 1 m/s at 250 °C, one gets a heat flow of 400 TW thermal using as a sink temperature 30 °C.
So a (rough) estimate of heat flow from the oceans hydrothermal vents is that 2,000,000,000,000,000 Joules (2 PJ) of heat is being pumped into the ocean PER SECOND.
Most of the hydrothermal vents are at a depth of 2000 to 2500 meters.
Krakatoa was a large explosion, but we’re discussing the amount of heat delivered, not the amount of rock moved by a steam explosion (in a very short period of time).
Actually, a better place to look for warming is probably over the spreading ridges in the center of the Atlantic. Those are known to be rather active and warm in places (Hello, Iceland!). However, it is arguable whether the spreading ridges are usually volcanoes rather than hot places…but it is probably an easier argument to conduct than finding many volcanoes off the coast of South America.
Personally, I know that molten rock contains a lot of heat, but it also takes a lot of heat to warm water, so I am skeptical of this idea and particularly near South America. Due to the subduction patterns on the west side of South America, I expect most volcanoes would be on land rather than underwater (and there are plenty on land there). I also haven’t had time to fetch the back of an envelope, but I see that others had a ready supply.
This is 46 days early!
Richard C (NZ) says:
February 15, 2012 at 12:49 pm
That’s an interesting paper. However, it’s not internally consistent. They say they have found 280 vents in the ~30% of the ocean surveyed, some as high as 60 megawatts thermal power. If we assume the average is half of that, 30MW, the total output from the 280 vents is 8.4e+9 watts.
Now a watt is one joule per second, so that’s somewhere around 8.4e+9 joules per second for the area studied, which they say is 30% of the total. That gives a total of about 3e+10 joules/sec for the whole planet … whereas you and they are claiming that the whole planet is putting out 4e+14 joules/second, which is about 10,000 times the figure calculated from numbers of vents.
So that would be the first question I’d have, why are their numbers so much greater than a calculation based on vent numbers? Even if we assumed that every single vent put out 60MW the number is still way smaller than their calculation.
Next, they say:
Now, that seems totally bogus. They are taking the amount of flow from the very fastest (“super fast”) vents, and assumed that the entire ocean is made up of that kind of vents. I would not describe that as “quite speculative”, I’d describe that as crazy assumptions.
In addition, the area of the ocean is right about 400 square terameters (358e+12 m^2). That means that by their calculations, the ocean is being heated from the bottom at an average of 1 Wm2 over the entire bottom … and I simply don’t believe that, it’s too big. Since that is only occurring a few places in the ocean the local heating would have been huge, and we would have seen it boiling and bubbling if that were the case.
Check my numbers …
w.
Yes Willis, I know that there’s some WAG assumptions and I can’t speak for Hiriart et al. or Baker and German but i think we can conclude that:-
a) There’s a huge amount of energy (by whatever estimate) flowing in to the ocean at depth and more attention should be given to it as AJStrata has done (with updates as new research progresses, not enough is known).
b) To neglect it as the Climate modellers have done in the O-GCMs is ludicrous.
Maybe a stupid question, but how is it this hotspot is just drifting along at 100 km and is retaining its heat for 2-3 months in rather cold waters?
That is my point – does observation of the ARGO floats validate the presence of these plumes in the areas you expect them to be? And what about the GRACE gravity footprint?
I don’t see this as likely. The periodicity of the ENSO can’t be due to volcanic activity. I’d consider the possibility that volcanoes play a part, but I just done buy the major premise.
Richard C (NZ) says:
February 15, 2012 at 2:57 pm
It is a huge amount of energy, but it’s a much huger ocean … yes, the flows (60 MW) sound stupendous, it’s true. But the ocean is a mighty big place. And in the overwhelming, vast majority of the ocean, you know how much hot water is gushing out of the sea floor?
Zero. Zip.
It’s the same on land. Volcanos on land put out vast, stupendous, unimaginable amounts of heat. Think about the flowing magma on the Big Island of Hawaii … but on most of the planet the ground is, well, cold, not to put too fine a point on it.
It’s not hot. It’s not tepid. Not even slightly warm. It’s cold. No hot springs.
As a result, the total energy averaged out over the entire ocean is small.
There is another consequence of the hot water vents being concentrated in a small area of ocean. It puts a limit on the total heat coming from them. For example, if there is 400 terawatts of energy as your source claims, that’s about 1 W/m2 over the whole ocean.
But it’s not over the whole ocean. It’s over maybe at most 1% of the ocean. That means it would have a local intensity of 100 W/m2 or more for thousands of miles of length … and that would have the oceans bubbling and boiling above the hot vents in short order.
In other words, the concentration in such a small area puts a limit on the total heat flow.
To make claims like that without doing the numbers is … never mind.
The average global geothermal heat is often taken to be around tenth of a watt per square metre or less. In addition, it is a static flow by and large. By that I mean it changes more on geological than human time.
Since it is small and changes very slowly, I would ignore it in my model. And for the current generation of climate models, a fraction of a watt is way below their error bounds in any case.
w.
The superheated water (100 C plus) that has been measured already does not produce “bubbling and boiling” because the pressure raises the boiling point, see Superheated water http://en.wikipedia.org/wiki/Superheated_water
“I would ignore it in my model”
That is your prerogative Willis, others may be so dismissive.
BTW not far from where I live on the coast of NZ (Bay of Plenty volcanic region), geothermal energy is being exploited at pace. The same geology extends into the Pacific up through the Kermadec Trench, one of Earth’s deepest oceanic trenches, reaching a depth of 10,047 metres. A compendium of recent studies of it is here:-
‘The Kermadec volcanic region: An overview of geological discoveries from the last decade’
http://www.thekermadecs.org/symposium/abstracts
Including:
‘Submarine massive sulfide mineralization and hydrothermal activity along the Kermadec Arc, the world’s most hydrothermally active’
Matthew I. Leybourne,
GNS Science, Lower Hutt
“The Kermadec intra-oceanic arc is ~1,220 km long, the result of subduction of the Pacific Plate beneath the Australian Plate. Attention has only recently been given to arc systems as locations of hydrothermal activity and formation of significant submarine massive sulfide (SMS) mineralisation, compared to the mid-ocean ridges. Exploration along the Kermadec arc began in 1998, followed by three systematic hydrothermal exploration cruises in which the entire arc was surveyed – NZAPLUME I in 1999, NZAPLUME II in 2002 and NZAPLUME III in 2004. Additional cruises have explored the Havre Trough, the back-arc to the Kermadec arc, as well as submersible, ROV and AUV studies on specific volcanoes. Our exploration along the arc has shown that the majority of the volcanoes and calderas are hydrothermally active, ranging from diffuse low-temperature venting to robust black-smoker style venting, with temperatures up to >300 °C and with associated SMS mineralisation. Incidence of hydrothermal activity varies from ~67% of the volcanoes along the southern portion of the arc, to ~83% in the central portion, to essentially 100% in the northern part of the arc.
The primary exploration tool has been the mapping of hydrothermal plumes in the water column overlying submarine volcanoes”
So yes, “the ocean is a mighty big place” but it’s still being explored let alone any knowledge of the time frames of changes to oceanic geothermal heat outflows. We don’t even know the current figure with any certainty (“around tenth of a watt per square metre or less” = WAG) so how can we know the change?
I’m surprised that no one mentioned Kelvin Waves.
http://earthobservatory.nasa.gov/IOTD/view.php?id=43105
excerpt:
Where do Kelvin waves come from? Under normal conditions, the tropics’ prevailing easterly winds push Sun-warmed surface waters across the Pacific from the Americas toward Indonesia, creating a deep pool of warm water in the western Pacific. During an El Niño, the trade winds falter, and sometimes even reverse, for months. When the winds that maintain the warm pool falter, a large pulse of warm water from the western Pacific slides back toward the east.
The missing heat, according to Hansen, hides on the ocean bottom “still in the
pipeline”, as everybody knows, and these hot spots in the Pacific are NOT volcanoes
but pipeline leaks or one end of the PIPELINE! Volcano nonsense…. Its the
pipeline, stupid…….This is where the heat is coming out…..
…….and steaming….. Hansen is smart and detected this already before WUWT
got the clue…..as always….
AJSttrata says:February 15, 2012 at 4:12 am
Great post and thought provoking.
My first impression, when viewing the animation I am struck by the temperature differential between the Pacific side and the Caribbean side of Central America. One would expect solar gain in the protected/isolated Caribbean basin to achieve uniformly higher temperatures than in the Pacific that is exposed to wide ranging cold currents. Quite the contrary. The depths are not dissimilar. The shallower reaches between Honduras and Jamaica should be warmer yet are not. It is absolutely conceivable that there is something else contributing to Pacific temperatures. Where do I apply for our grant?
Just as global warming causes colder temperatures, maybe the reciprocal is true that colder currents cause warmer ocean temperatures /sarc.
People should bear in mind the distinction between hydrothermal venting and active vulcanism. There is widespread hydrothermal activity in the pacific northwest that is not associated with any active vulcanism. Isotope dating indicates that many of these waters are thousands of years old, indicating very slow recharge cycles if in fact there is surface recharge. Some is “new” water. We cannot think of aquifer recharge rates in human terms or lifetimes.
A sample inventory: 6,155 geothermal springs and wells are mapped in this publication.
http://pubs.usgs.gov/of/1995/of95-689/
“Digital Maps of Low- to Moderate-Temperature Geothermal Springs and Wells in the Pacific Northwest: A Contribution to the Interior Columbia Basin Ecosystem Management Project”
I have always thought that there is no way that the sun and atmosphere can heat the oceans to any depth at all other than in very shallow water, so the obvious cause is the heat coming from within the earth.
Could the periodicy be caused by some sort of tidal motion affecting the molten magma beneath the sea floor as it does the oceans causing more heat to be released during times when earths orbit brings it closer to the sun as it has been in the recent past I think.
Sorry no data, just gut feel.
I said this a LONG time ago, based on falsifying the assumption that the Earth-source heat values in the heat balance diagrams is zero. Plus the fact that they keep finding more vents. Plus the locations of the vents
PLUS, I kept asking what is the SOURCE of the El Niño heat? And EVERYWHERE I looked online, all I could find was that El Niñ was, itself, the source – if they even asked the question.. Which was ridiculous
I got zero response here, which was very disappointing.
I am glad that someone has taken it and run with it, though. Right or wrong, it is a question that NEEDS to be asked.
More comments later. This is something I’ve put a lot of thought into…
Steve Garcia
http://www.geostreamconsulting.com/papers/Leybourne_Oceans_Fin.pdf
Check above out.
and
http://chiefio.wordpress.com/2011/06/24/megaplumes-and-volcanic-gasses/
From ‘Megaplumes and Volcanic Gasses’:-
“The energy content is an order of magnitude greater [than ordinary plumes], and the thermal power may be many orders of magnitude greater,” Murton said.
“A normal hydrothermal vent might produce something like 500 megawatts, while this is producing 100,000 megawatts. It’s like an atom bomb down there.”
Recent studies have attempted to factor the heat from the world’s known hydrothermal ridges into ocean circulation models.
“Some studies estimate that for the Pacific, background thermal heating might increase ocean circulation by up to 50 percent,” Murton said.
==========================================================================
Looks like at least some of the modellers made a start if they “attempted to factor” the “known” hydrothermal heat into the models – but how much is known?
Gerlach, T.M., 2011, Volcanic versus anthropogenic carbon dioxide: Eos Trans. AGU, v. 92, n. 24, p. 201-202.
Gerlach, T.M., 1991, Present-day CO2 emissions from volcanoes: Eos Trans. AGU, v. 72, n. 23, p. 249 and 254-255.
http://hvo.wr.usgs.gov/volcanowatch/2007/07_02_15.html
http://www.agu.org/pubs/pdf/2011EO240001.pdf
This guy needs to be debunked. Seriously, this is USGS’s only main pillar that’s holding up the volcanoes don’t produce much CO2 myth (esp the 3million underwater ones…)
How can you measure all these things you don’t even see or monitor? How did we monitor Pinatubo and Iceland volcano?
http://www.agu.org/pubs/pdf/2011EO240001.pdf
Like this article, where is the material and methods? And why does it specially attack Ian Plimer? Whats the point, it’s a journal article is it not?
Willis Eschenbach says:
February 15, 2012 at 3:37 pm “…Volcanos on land put out vast, stupendous, unimaginable amounts of heat….” Yes they do put out lots of heat, over amazingly long periods of time. To us little humans – especially ones who aren’t geologists who have had to grapple with these things to some extent – the heat and time seem unimaginable – but they can be quantified (Willis, I’m just using your words as a springboard to get to a point).
The map that AJ shows of the volcanoes above the subducting Cocos Plate is interesting. Let’s pick one volcano – San Salvador in El Salvador. 3000 meters high (apparently lost a 1000 meters to an eruption), 14 kilometer base. Volume = ~155 cu. km.
Assume the magma chamber supporting that cone is 10X the volume = 1550 cu km
That’s ~1.6e18 cu cm of rock, with a density (we’ll assume basalt – although this guy erupts andecite-dacite material – because it’s a bit denser and hotter) of 2.8 gm/cm = 4.5e18 gm of hot magma. How hot? About 1200˚C. Basalt has a specific heat of about .95 j / g˚K.
Now let’s put it underwater and instantaneously – as opposed to tens of thousands or even millions of years – release that heat into the water, cooling the basalt from 1200˚C to 0˚C. This releases 4.5e18 gm x .95 j / g˚K x 1200˚K = ~5e21 joules into water. That will heat ~1e21 grams of water 1.0˚C. The ocean contains about 1.3e24 cu cm water; this heat will affect 7/10,000 of those cc’s. You will never detect it over the entire ocean; but it would have some, perhaps a great deal, of effect locally. (I’m glossing over density issues with water, just assuming 1g/cc).
Now I’ll wave my arms: All the submarine volcanoes in the world, including the volcanic activity along the seafloor spreading trenches, probably amount to no more than 10 times that kind of heat input into the ocean. And there is no heat leaking through the basaltic floor of the ocean from the asthenosphere, except at the trenches and seamounts. The seafloor is cooling and becoming dense so it can be subducted. Cold basalt is a very good insulator.
So the undersea volcanoes can’t heat the oceanic bathtub and neither can the solar hair dryer.
So what’s left?
this is something of a brain sail, derived from the brain storm and concept map notions.
I haven’t read much about it and have no doubt that my ignorant questions will test some participants. nevertheless there may be some considerations worth following up
I was viewing the area on google maps – a trench ends close by, there is a slight shelf, the area is tectonically dynamic. the equator is close by, is there orographic weather? I wonder about cloud cover over the area in question.
I wonder about geo magnetic considerations – harmonics, grid theory. I recall reading about peculiar events at magnetic equators, to wit, instability, loss of integrity. a quick search reveals ionospheric currents, toroidal fields, but not the schematic I’m looking for. is there possibly toroidal action or magnetic anomalies in the area of consideration? I wonder what goes on at the intersection of the magnetic equator and the trench?
I’m thinking that we are looking for similar rhythm patterns to el nino and la nina appearances.
a seasonal inquiry is reasonable. I understand el nino to be derived from seasonal influences. the accumulation of heat occurrs in a period of a few months and dissipates over a few years. conversely, la nina sends cold that dissipates in a shorter period.
sea currents are muchly set by land and sea floor. the sea floor under consideration does have the end of a trench in it, possibly allowing for dynamic mixing of water. it’s reasonable to assume the trench has a profile on the other side of it, with possibly similar dynamism, but a lot hotter.
my guess at this stage is that there are several events which lead to the formation of el nino. I’m leaning towards cloud free doldrum like conditions.
but my first question is what events show the same periodicity?
My spanish has grown weak. I cannot find the right information at http://www.ovsicori.una.ac.cr/sismologia/sismologia.htm
But, a hotspot with near surface magma would be seismically active. I cannot find references to that area having swarms of tremors that would confirm volcanic activity. While an interesting idea, other things may not bear it out. Did I miss a seismological record that infers this activity might be there?
Final comment on this post. If one goes to the website where the pictures posted at the beginning of this article come from:
http://bulletin.mercator-ocean.fr/html/produits/bestproduct/welcome_anim_en.jsp?zone=pa1
and watch the animations over a long enough time period, there is absolutely no doubt that the heat spreads from west to east (Indonesia to Central America). The hot spots along the Central American coast wax, wane and translate. They must represent some near-shore interaction of wind and water and sun, and I strongly believe they have no relationship to volcanism (that’s happening onshore in Central America, many miles to the east).
PDO, ENSO, and MJO all seem a bit of the same critter, albeit at different temporal and spacial scales. Since MJO is very clearly wind driven, propogating from East to West, it seems folly to discount the wind and Eckman transport in ENSO. Nevertheless, it has long been troubling that global average temperature seems responsive to PDO and ENSO. Why should GAT care which side of the Pacific the winds encouraged the abyssal waters to upwell on? Either our measurements are more biased than we can imagine, it is as simple as “who turned off the air conditioner”, ore something else is going on.
@Just The Facts Please 2:33 am:
“I think it’s pretty well established that changes in the trade winds are what cause the ENSO.”
Not meaning to be argumentative, but I’ve looked for anything that shows this to be anything but an assumption, without success. Can you possibly point at some paper?
Steve Garcia
I think this is a very interesting post. One of the charts (mar 2009) shows what appears to be two or possibly three point sources of heated water off South and Central America. The surface plumes affect regions both above and below the equator.
I read something earlier today (can’t find the link again) that showed a diagram w/ explanation of an expansion / tension zone in the Nazca tectonic plate. It showed a thinning of the oceanic crust located west of the typical trench and subduction zone along the Peruvian coast. I’m sure it was a theory or hypothesis. I’m only making ‘observations’ here and no claims.
Some observations and questions to ponder south of the equator along the Peru (Humboldt) Current came to mind as follows:
1. How fast would the Humbolt Current travel at depth?
2. A possible Nazca tectonic plate expansion / tension zone running in the same direction and under a very strong oceanic current releasing great amounts of heat into the water. The molten reservoir is much closer to the ‘surface’ of the Earth’s oceanic crust under the ocean as opposed to the land surface and would be continually opening with regards to width. Even one or more vents could have the same effect.
3. The cross sectional ‘shape’ of the heated current at laminar flow could likely become similar to an upside down teardrop over distance.
4. In a fast moving current the time for convection and conduction of a rising mass of water could travel a very long distance before reaching the surface and vary surface locations due to other surface and/or current factors.
5. This would not likely be the only factor in the upwelling far from its initial source(s) or regions of origin. Other factors such as trade winds, other ocean currents, underwater geography, etc would all be at play.
6. Consider volcanic activity on land. It can expel it’s content at atmospheric pressure with little resistance. Pressure must build to ‘blow the plug’. Most internal pressure would possibly be released explosively and rapidly.
7. Consider that volcanic activity at deep oceanic depths. It will be restricted to a release against a much greater pressure and viscous medium that may cause a more uniform release.
I’m making no claims, just saying. We don’t know what we don’t know until we know it.
“It is infeasible that El Niño can arise from atmosphere and sun alone by warming this mass of water. Neither air temp or solar radiance change enough to cause this phenomena. “
Wrong conceptualization & wrong variables. Be careful with anomaly-think. Conceptualization needs to be consistent with recorded Earth Orientation Parameters. Interesting article. There is coupling, but we’re not yet at a stage where we can discuss this efficiently. I apologize for not having time to comment in more detail. Best Regards.
It has long been thought that the Mesozioc was a time of unusal spreading of the Pacific and tectonic activity in general. Indeed, for the vast majority of earth history the continents have been swept into a pile by a predominant spreading center in a Panthalassic Ocean. The Pacific is in some sense a relict of the Panthalissic. The Tertiary (and Quaternary, our era) is extraordinary in the dispersion of the continents. This is largely due to the spreading of the Atlantic.Previously there was Tethys, but to nowhere near the extent. It seems like the opposite of a tug of war, a push of war, if you will, depending on which spreading center had a better grip on the continental margins.
The radioactive decay towards the core of our planet supposed to be driving all this is poorly understood, at best. Shame on us to presume anything. First, we need way more data.
If the seafloor is “cooling”, it is being cooled by something. That would be the water which is being warmed by the seafloor. It should be measurable in (missing) degrees Kevin. ;p
AJ Strata;
Edit: “this phenomenon“. It takes at least two to be phenomena. 😉
John Marshall says:
“I repeat, at the position of hot region that seems to originate from below the surface, off the coast of Costa Rica, there is no volcanic activity because of the subduction boundary.”
True, but there is a seamount along the Tehuantepec ridge at about 450 km from the coast that rises about 1818 meters above the ridge line.
It’s apparently similar to the Steel Vendor seamount along the Mendocino Ridge, which is about 420 km from the coast and rises 1806 meters above the ridge.
Dunno if either is volcanic.
GeoLurking’s February 15, 2012 at 10:57 pm
Continued:
Additionally, Costa Rica has several subsea peaks scattered around 7.67°N 85.86°W. One of the taller ones rises 1958 meters above the surrounding seafloor.
FYI –
At http://www.peteraldhous.com/vents.html is a map of the Earth’s undersea vents, including unconfirmed ones.
Almost all appear along plate boundaries, and all in that region appear to, at least of those known. It is possible that people are only looking only along plate boundaries (which makes sense). ONE appears right about where AJ points to. One vent does not seem within magnitudes of being able to do what AJ says volcanoes are doing, but where there is one vent, the map shows there sometimes are more. There are a running string of them on the western edge of the Nazca Plate, for example. It might be a matter of “we won’t know they are there until we look for them.” Even though we are just beginning to find them, thus far a LOT have already been found. How many there are in total is any person’s guess. And how many are along that trench, who knows right now?
That vent is for all purposes ON/IN a trench (the map may be showing its location or the trench location off a bit). This appears to belie what some are saying here, that vulcanism does not happen at subduction zones.
Steve Garcia
@Paul Vaughan 9:40 pm:
Paul, I would tend to disagree. If the sun and atmosphere alone could account for this, the climate guys wouldn’t be talking about “upwelling” of heat sequestered at depth (which I am certain is a speculation trying to explain it within current paradigms). While that sounds reasonable, it leads to further questions, like why is the (needed) huge amount of warm water at depth not rising or staying at the surface to begin with?
Correct – we are not at the stage where we can discuss this efficiently. It is the flounder stage of figuring something out, so it is inefficient by definition. We are looking for the right questions – and that is the most fun part of anything! We lack knowledge about most of it – among which are undersea volcano locations (and their heat output and if they are active in a cyclic way), undersea vent locations (numbers and locations – there is ONE known one, right there – and their heat output and cyclic nature, if any), how the currents mix with the convected heat plumes.
I think it may not be unconnected that Indonesia’s really active and wide seismic zone is right where that 30C water is located in the western Pacific. There may be similar things going on at that end, too. It is a question that cannot be ignore, I don’t think. If undersea vents/volcanoes are capable of causing heat plumes in the Costa Rica area, then the whole world is fair game for the same thing. But that would also be putting the cart ahead of the horse.
I feel it is possible there could be some local effect in Nino 1-2, but a problem is the fact that variations in the trade winds always precede ENSO..this has been well documented.
What varies before the trade winds are various processes in the stratosphere, though I’m too strapped for time at the moment to explain myself. But in my view, the culprit clearly seems to be the magnetic sun.
There is an immediate mechanism, and a mechanism lagged 6 yrs involving CMEs. I’m strapped for time at the moment so can’t be detailed, but the immediate effect of a low AP index is more understandable, in modulation of various atmospheric circulation cells, seen after the 2005 AP index drop and systematic response…basically a more favorable regime for La Nina.
As for specific ENSO variation, I am firmly in tbe Landscheidt camp.
Phil –
Trade winds precede ENSO? Which phase? El Niño?
Steve Garcia
A 6-year lag time for some CME mechanism seems a bit of a stretch to nail down for a 2-5 year variable cycle time. They thought for a long time that tree-rings correlating with temps was valid, too. And after 70 years of non-correlation, they still insist it’s real. A CME 6 years ago does something in the eastern Pacific now? Why there? Why only there? I hope you don’t mind my politely being skeptical.
AJStrata says: “First off, that plume is 100 meters down not at the surface. So when you can explain how trade wins caused that to happen I am all ears.”
You’ve misinterpreted what I wrote earlier. I wrote, “You’ll have to discuss how that small plume of water [warm] water would weaken the trade winds in the western Pacific, which is what initiates an El Nino.”
The basic mechanics of ENSO are well understood. And one thing that’s certain, the warm water that’s seen during an El Nino does not come from Central American coastal waters. The warm water comes from the western tropical Pacific. During ENSO-neutral and La Nina periods, the trade winds “pile” warm water in the western tropical Pacific. The surface of the western tropical Pacific is about 0.5 meter higher in the west than it is in the east because of the trade winds. Gravity wants to erase that difference in height. When the trade winds relax in the western tropical Pacific, gravity causes the warm water there to slosh east. The Equatorial Countercurrent (Scroll up to your map.) increases in size and carries that warm water to the east. That’s a very basic description of how an El Nino starts.
You may also want to study confluences in the eastern tropical Pacific to see if you’re mistaking a confluence for a volcanic plume.
feet2thefire says: “Trade winds precede ENSO? Which phase? El Niño?”
And La Niña.
http://i41.tinypic.com/ifcsn7.jpg
Interesting observation which has led to fascinating discussion.
It seems clear that something is adding heat in the east, different from the back-slosh from the west. I was interested in Bill Issis’s comment, back at 3:46 on February 15, where he suggests, “The coastal upwelling is composed of three different upwelling gyres, Tehuantepec, the Costa Rica Dome and the Gulf of Panama. The thermocline is right at the surface in these three upwells and they alternate between warm and cold upwelling.” What I have trouble getting my mind around is the idea of a “warm upwelling.” Would that have to have a very shallow sourse? It gets pretty cold right below the thermocline.
Obviously what is needed is a cluster of Argo floats in the area of this phenomenom. Also some grologists studying the sea bottom there.
What a pity it is that Gore diverted money, away from Bill Gray’s grant applications, to Hansen’s dreary “adjustments” of old and musty data, back in the 1980’s. If Bill Gray had his way, we would have had Argo buoys twenty years earlier, and much more actual data.
Tisdale has done great work, just using the power of observed data. However I think there may be other factors effecting ENSO besides the ones he so wonderfully points out. Observations such as AJ Strata’s give us more to think about.
I ventured some ideas, couched in humor, concerning hydrolic influences, (which I mistakenly called Pneumatic,) in a WUWT post http://wattsupwiththat.com/2011/09/18/a-laymans-paper-pneumatic-effects-on-thermohaline-flow/
It doesn’t matter so much if our ideas are weak, or incorrect, as long as we are free to discuss them. You learn a lot, when you are humble, and don’t pretend “science is settled.”
Bob Tisdale says: February 16, 2012 at 2:28 am
Thanks for that helpful explanation, Bob.
Haven’t read all the replies here today..
Has anyone layered the maps into Google Earth to compare the structure found under the ocean at the locations of these upwellings?
Where’s Pam when you need her. If we take off ice/mass at the north pole of the planet, what is the tectonic response at the equatorial regions. North pole compressional, south pole extensional.
In Google Earth there appears to be a raised region north of the upwelling region. But south closer to S. America connection region its a mess. Could some of that pressure being released north?
Rhys Jaggar says:
February 15, 2012 at 3:03 am
“One thing to think about: Piers Corbyn has been saying (and is now making predictions based on it) that CMEs which hit earth’s atmosphere have effect on earthquakes..”
No he isn`t, he was using his weather event impact dates for EQ timing, but now, directly from my research, he is saying that it is when coronal holes are Earth facing, that means 3-4 days before the coronal hole stream will have reached us.
Maybe we should start looking for smoker patterns. in this region..
Ask me there’s quite a bit of pressure in that corner where central America meets South America. Shows weakness in size first off and in time frequent increases in fractures.
Wasn’t there a backwards quake at the Northern end of central America in Mexico back in hmm in 2008? Pressure and heat release hmmm….
ooops backwards quake was 2007. But check this..”Suddenly, in the latter half of 2006, the plate began moving the other way and quadrupled its speed, scientists announced today.”
In Surprise, Major Earthquake Fault Slips Backward
Robert Roy BrittDate: 02 August 2007 Time: 11:15 AM ET
A vast chunk of Earth sliding under Mexico has surprisingly reversed direction, puzzling geologists and leaving them wondering whether the ground might be poised to pummel Mexico City with a devastating earthquake.
The offshore tectonic plate had been sliding toward Mexico City at a rate of 1 inch per year, as recorded by Global Positioning System measuring stations near Acapulco and Guerrero, which is about 175 miles southwest of Mexico City.
That movement was normal, as predicted by theories of how Earth’s crustal plates should move. At subduction zones, like this one, an oceanic plate typically slides beneath a continental plate, and now and then major temblors occur.
Suddenly, in the latter half of 2006, the plate began moving the other way and quadrupled its speed, scientists announced today…..
http://www.livescience.com/4590-surprise-major-earthquake-fault-slips.html
So why does the warmest flush of surface water appear at the coast of Central America from every Vernal Equinox (with a weaker flush just after the Autumn Equinox) regardless of ENSO phase ?
Doesn’t it seem that 2012’s ‘missing’ Arctic ice is down current from Katla and her merry band of hotheads (aka Iceland)? If underwater vulcanism can change ENSO, wouldn’t it be able to affect Arctic ice and ‘decouple’ arctic ice from temperature (arctic or global)?
Sorry on a roll..
In the recent past as far as glacial iso rebound, permafrost and ice/mass loss Northern plate raising..coupled with Coriolis effect on central plate..causes backwards quakes?
J says:
February 16, 2012 at 6:18 am
~
I dunno, lots of interesting recent devopments though..
Surprise: Explosive volcanic eruption under the Arctic ice found
Posted on June 25, 2008 by Anthony Watts
..“The Vesuvius erupted in 79 AD and buried thriving Pompeii under a layer of ash and pumice. Far away in the Arctic Ocean, at 85° N 85° E, a similarly violent volcanic eruption happened almost undetected in 1999 – in this case, however, under a water layer of 4,000 m thickness.” So far, researchers have assumed that explosive volcanism cannot happen in water depths exceeding 3 kilometres because of high ambient pressure. “These are the first pyroclastic deposits we’ve ever found in such deep water, at oppressive pressures that inhibit the formation of steam, and many people thought this was not possible,” says Robert Reves-Sohn, staff member of the WHOI and lead scientist of the expedition carried out on the Swedish icebreaker Oden in 2007…
http://wattsupwiththat.com/2008/06/25/surprise-explosive-volcanic-eruption-under-the-arctic-ice-found/
Ulric Lyons asks:
So why does the warmest flush of surface water appear at the coast of Central America from every Vernal Equinox (with a weaker flush just after the Autumn Equinox) regardless of ENSO phase ?
The ITC, the convergence zone of the Trade Winds, passes Central America twice each year, very nearly at the equinox, since Central America is very near the Equator.
For anyone still interested, I have an update posted
http://strata-sphere.com/blog/index.php/archives/18096
This is my works:
http://expianetadidio.blogspot.com/2011/12/el-nino-e-un-effetto-del-vulcanismo.html
http://expianetadidio.blogspot.com/2011/12/el-nino-sotto-la-crosta-terrestre-ii.html
http://expianetadidio.blogspot.com/2011/11/el-nino-sotto-la-crosta-terrestre.html
http://expianetadidio.blogspot.com/2011/10/geotermiail-fattore-meno-conosciuto.html
http://expianetadidio.blogspot.com/2011/06/i-segni-di-un-grande-aumento-geotermico_12.html
what do you think?
I mentioned earlier it’s the mountain jet effect which happens during winter.
That great red spot on the charts above looks like this.
http://www.open-ocean.org/?page=16
This may very well be the result of a vortex. This gallery of pics at this website has some very interesting graphs concerning vortexes, and currents in general. Worth a look at them.
Another thing I noticed is the ocean current along the Central American coast is moving south while further out to sea the current is moving north. Depending on their strengths, that could whip up a strong vortex.
@Ulric Lyons 6:06 am:
“So why does the warmest flush of surface water appear at the coast of Central America from every Vernal Equinox (with a weaker flush just after the Autumn Equinox) regardless of ENSO phase ?”
Ulric, I noticed that, too. But it doesn’t seem to have much of the same effect south of the Equator. Odd, isn’t it? And probably instructive.
Though I think this is an important question to ask, late last night I stayed up and really, really got into looking at the animation cells (you can arrow down and up, one at a time.), and I found some things that seems to put it to rest.
1. If you look at the ‘surface’ animation, there are heat plumes doing all sorts of things. And they at times cover the entire -10°S to +10°N tropical Pacific.
2. If you look at the ‘100m’ animation, the boundaries don’t seem to change that much.
3. In the ‘100m’ animation the area where the hot spots arrive never seems to heat up overall due to them. That area overall stays quite cold. They just appear and then race across – still small – and join the large plume in the west and central tropical Pacific.
4. Those hot spots at 100m don’t seem to time well with the ones at the surface.
5. But most of all, if you look at the ‘1000m’ animation, the temps all across the Pacific are nearly completely flat, at about 4C-5C. (It is hard to be sure of the temp readings, because when the image does its small-to-large jump, the colors change and stay changed.) This holds true throughout, and from coast to coast, not counting where the water is too shallow in Indonesia.
Number 5 clinched the argument for me. If there were hot sources below – especially ones that affected very large areas – those should show up all the way up from the bottom.
What I see is that the massive changes on the surface do not come from down below, based on there being no warm areas at all at 1000m and no warming of the eastern areas at 100m, other than those small hot spots.
To me, these clinch it, and this idea – which I had written about myself months ago – seems to be falsified. No matter what kind of heat source might have been considered, there simply is no heat showing up at the deeper levels. Therefore, I conclude that the heat is not coming from below.
@Ulric Lyons 6:06 am:
“So why does the warmest flush of surface water appear at the coast of Central America from every Vernal Equinox (with a weaker flush just after the Autumn Equinox) regardless of ENSO phase ?”
One more thing on this:
The Sun is directly over the Equator on the NH spring equinox, and moves northward right after that. So, it will be directly overhead of this area in that time span each year. It will also be passing it again, going south, just before the NH autumn equinox. Perhaps in the NH summer its affect is delayed for some reason. No good explanation comes to mind on that aspect of it.
Another thing to consider is as this hotspot was developing at 100km the surface temps were cooling off as well. Down welling of warm water with the upwelling of colder water.
http://www.nsof.class.noaa.gov/saa/products/search?sub_id=0&datatype_family=SST50&submit.x=27&submit.y=6
Homepage: http://www.nsof.class.noaa.gov/saa/products/welcome;jsessionid=FD720E08FE2E21F235ACCF8D28C0007F
Can click on SST data on the right.
Using this tool, you can set your parameters at 50km resolution for SST data for the time frame, and you can use your mouse to box the area on the map. Hit search and new page will give results. Drop down at top of page holds time frame links to move ahead in time.
Currents are quite variable in this area as depicted by this map.
http://www.open-ocean.org/?page=17
I would consider vortex in this area before hydrothermal activity.
feet2fire,
I discussed the lack of 1000m data – not enough floats, not enough data. Plumes are small a 10 times the depth of the 100m. Maybe 1/10 the size. So you need 10 times the floats to detect it.
Understand most of the swath of blue in that area is smearing of data. I think there may be 5-20 floats total in the area. Plus if you go East of the East Pacific Rise you don’t find any floats in that region – where you would see the small starts.
As someone noted, you have to use those animations with care.
AJ –
Point taken. I expect that you are completely correct on the plume thing. But from 100m to 0m there should be some reasonable similarity in the plume patterns and their surgings and recedings.
As to the 1000m readings, I have a question: If in Indonesia where there are no 1000m readings they show white, then why don’t show white in the east where are no readings?
In addition, at 100m I still don’t see any heat near the American coast. At that depth, there doesn’t seem to be any appreciable movement of the colder-warmer zones. Those hot points are real, but not significant, not in any way I can see. They leave the coast and merge, and don’t seem to have any effect. Yes, the surface temps have their surges, but I don’t see any of that emanating from below. I wanted to see it, but I don’t. I don’t see any way that proposed ocean bottom heat in that zone could possibly make it to the surface without showing up at the 100m depth. It has to show somewhat of the same activity; I don’t expect it to be as big, but I see none at all, other than those three hot points.
Although it was a good enough idea – one that needed to be asked – I don’t see it in the ARGO data.
Steve Garcia
For what it’s worth. I looked at Google Earth and focused on the Pacific ocean along Peru and up along Mexico. I don’t have any idea how accurate the ‘view’ is but it was fascinating. Somewhere off the coast of the Peru/Chile border there appear to be a cluster of sub-sea mounts that had a distinct shape of a volcano. If the elevations indicated on GE were correct I believe the water depth was 16k – 18k feet. The trench at the subduction was even deeper.
I was never able to find any info as to the speed of the Humboldt Current. Question is: If there were a powerful hot vent heating a plume / strand of water over 3 miles below the sea surface in a fast moving current, how long or far would it take for that plume to reach the surface?
Another interesting point was the sea floor just off Panama. There is a very large rise there that would have a major influence on any currents that may be present.
Check it out. It’s fascinating and much more so if accurate. If there is a link that would reference to the speed of the Humboldt Current, please advise.
When you look at the sea temperature anomaly maps from the NASA site file AMSRE_SSTAn_M it is clear the huge hot spots occur raising the temperatures by about five degrees in tight regions before dissipating in the way one would expect any localised heat source to do. Can anyone explain the mechanism whereby heat is transferred to these highly contained regions from hotter areas but then are unable to continue to contain them once released there?
Could it be that these hot spots are the actual location of the source of the warming especially that in the remaining areas there is a clear and undeniable cooling effect dominant?
How much has been spent on physical research into these regions compared to the lavish spend on computer modelling to eliminated the possibility of volcanic or other heat sources. Since we are told the science is incontrovertible it should be sufficiently large to be readily quantified?
Thanks, Strata, for a great post – very thought provoking.
Sandy says:
February 15, 2012 at 6:20 am
“I’d suggest that geothermal heat affects the West Pacific more. Warm salty waters collect in the abyssal deep held down by the less salty continental run-off. Eventually, like a lava lamp, globs of abyssal warm water contact the West Pacific Warm Pool and El Ninos predominate. After 30 years or so the abyss is drained and La Ninas dominate while the abyssal reservoir recharges, for 30 years on so.”
I agree. We know so little about what goes on in the depths of the ocean it’s hard to understand what we observe in shallower areas of the ocean and at the surface. I think both Strata and yourself have identified at least two areas of conjecture worthy of further research, but until we have some numbers for the magnitude of these effects, we are still just left with unknown unknowns and speculation.
Here is something that may be related.
At least 264 dead bottlenose dolphins have washed ashore over a stretch of Peru’s northern coast, officials said as they seek to discover what killed the marine animals. The dead dolphins were found over a 103 km stretch of sandy beach, Edward Barriga, an official with Peru’s Oceanic Institute, said. “We have taken samples to determine the cause of death,” said Mr. Barriga, speaking from the city of Lambayeque, adding that vast quantities of dead anchovies had also been found in the region. The dolphins may have been killed by the impact of off-shore oil exploration and drilling in the region, said Carlos Yaipen with ORCA, a non-governmental group that focuses on helping ocean creatures in the South Pacific. The mass dolphin deaths are a “very serious” issue, Mr. Yaipen said. The head of a Lambayeque group representing aqua-farmers, Jorge Cabrejos, said the anchovies appeared to have eaten contaminated plankton, which then sickened the dolphins that ate the small fish. Thirty-four of the world’s 81 cetacean species are found off the Peruvian shores, 17 of which are dolphins. Of those, the most common is the bottlenose dolphin.
http://www.ntnews.com.au/article/2012/02/14/288701_fishing.html
Mike K says:
The dolphins may have been killed by the impact of off-shore oil
Henry@Mike K
Let us keep and/or wait for the facts, before we start blaming,
otherwise we make the same mistake as previously,
blaming the (poor) CO2 (carbon dioxide) for global warming,
when the facts clearly showed me that it was not so.
http://www.letterdash.com/HenryP/more-carbon-dioxide-is-ok-ok
I once wrote a post here called The Trade Winds Drive the ENSO.
http://wattsupwiththat.com/2009/02/17/the-trade-winds-drive-the-enso/
It’s still working as outlined.
Eastern Pacific Trade Winds versus the ENSO.
http://img525.imageshack.us/img525/2231/ensovs175wtradewindsjan.png
Full Pacific Trade Wind Index versus the ENSO..
http://img513.imageshack.us/img513/5108/ensovstradewindsjan12.png
I think they are going to slow down soon and we’ll move into an El Nino (but that remains to be seen.)
Marine Mammals die for a lot of reasons some of which we are still quite clueless. Why do dolphins and whales of all kinds beach themselves to essentially commit suicide? Did they get bored with life and the futility of their existence? Is it a bacterial infection of some kind as some have suggested? Is it the changing magnetic lines of force from the earth that confuses them? What will happen when the poles shift their magnetic polarity?
Making claims the oil company did it is rather a far fetched assertion since we have been doing off shore drilling for decades without similar results. Sorry, it doesn’t pass the sniff test.
Strong Suggestion for Everyone: Take down the anomaly-blinders for just long enough to re-acknowledge the dominance of the year.
Bill Illis (February 17, 2012 at 7:07 am) is right. It’s about wind. Everyone here needs to read up on what climatologists call “thermal wind“. I can’t see the discussions at WUWT EVER advancing much if people don’t. I’ve posted a bunch of animations (will run on Firefox but not Internet Explorer) to help stimulate better multivariate awareness:
http://wattsupwiththat.com/2012/01/31/a-japanese-puzzle/#comment-882297
People who persist in an exclusive focus on TSI & the heat capacity of air are totally missing the boat. One gets the impression that most contributors here think the oceans just circulate themselves, without any input from wind. Such conception is fundamentally wrong. I encourage readers to make an effort to shed some ignorance. Start by just lifting a finger today. Watch the climatology animations comparatively and learn that ABSOLUTE (not anomaly) equator-pole temperature gradients drive the pressure gradient force that drives wind that drives ocean gyres. More details can come later, but people need to first understand that ocean surface currents are driven by wind. (Climatologists aren’t wrong about everything!) The animations should help people efficiently establish this MISSING connection in their conception. Vukcevic in particular: Please stop ignoring this; it’s FUNDAMENTAL. Best Regards.
Henry@Paul
Well, here are the facts, as I see them happening,
since 1974,
http://wattsupwiththat.com/2012/02/15/do-underwater-volcanoes-have-an-effect-on-enso/#comment-893299
Obviously you are unaware that the ozone layer is shielding us from at least 20-25% of all incoming sunlight?
The heat is coming from the other side of Central America, and the regions are small because the winds are passing through valleys and lowlands. The temperatures on the west side vary based upon the temperature on the east side and, literally, upon which way the wind is blowing.
Step through the animation at:
http://earthobservatory.nasa.gov/GlobalMaps/view.php?d1=AMSRE_SSTAn_M
You’ll see that the mountain jets on the west side of Central America reflect the temperature on the east side. The jet across Mexico in winter tends to be cold, because the Gulf of Mexico waters tend to be cool. When the water is warm on the east side, the wind hitting the water on the west is warm enough to offset the cooling effect of moving air.
Paul Vaughan says:
February 17, 2012 at 10:34 am
Thanks, Paul. Some ocean surface currents are indeed caused by wind. However, if there were no atmosphere at all, there would still be ocean currents, driven by things like thermal and thermohaline circulation … so while climatologists aren’t wrong about everything, if your claim is that climatologists think all ocean currents are driven by winds, you are wrong. Wind is most assuredly very important in the climate, but climatologists are well aware that things other than winds both create and affect ocean currents.
Finally, in general winds are a function of ∆T, a temperature difference between one place and another … and as such, if winds are as important as you claim (and I think they are), a focus on T and ∆T and TSI and the heat capacity of the air and a host of other wind-related questions must also be very important.
w.
The Trade Winds are directly related to the temperature of the equatorial Pacific in the upper 300 metres.
If it is colder in the East Pacific then there is little convection and little cloud and little rain in the eastern 2/3rds of the Pacific (almost none in fact). If the West is warmer, then there is more convection there and more rain and so on. So a cold East, warm West and the Trade Winds then blow stronger, which draws up even more cold water from below and then the winds blow even stronger and it becomes a self-reinforcing oscillation.
Eventually all the colder water is blown to the West, which pushes the warm water down and it recirculates back underneath in the Equatorial Pacific UnderCurrent which then eventually surfaces in the East at the Galapagos Islands. Now we have a warm East and a cold West and opposite convection cells. The Trade Winds then slow down and the warm water remains at the surface and even sloshes back to the East and viola, an El Nino.
http://img859.imageshack.us/img859/6401/ensoeuotavs175wtradewin.png
A self-reinforcing oscillation (up to a limit at which time it reverses and becomes self-reinforcing oscillation in the other direction).
The El Nino (which is now at 150 metres depth and between 135E and 160W) is coming sometime.
http://www.cpc.ncep.noaa.gov/products/analysis_monitoring/ocean/anim/wkxzteq_anm.gif
A few days ago I came across something about the radioactivity driving the tectonic plate movements, which was mentioned by gymnosperm says:
February 15, 2012 at 10:43 pm, I post for interest.
http://www.madsci.org/posts/archives/1998-10/905866177.Es.r.html
“Thank you to Mike Fox, who pointed out that radioactivity is the primary source of the roughly 10% excess heat that the Earth radiates, and further that radioactivity provides the heat which drives geophysical processes such as plate tectonics, the Earth’s internal dynamo, and other effects of convection within the Earth.”
I’ve been looking at the Holocene Maximum and came across this on ENSO – posting for interest:
http://www.fs.fed.us/ccrc/bibliography/5_3_holocene.shtml
^ topLoubere, P., M. Richaud, Z. Liu, F. Mekik (2003). Oceanic conditions in the eastern equatorial Pacific during the onset of ENSO in the Holocene. Quaternary Research 60 (2): 142-148
“ABSTRACT: Records from South America show that modern ENSO (El Nino-Southern Oscillation) did not exist 7000 cal yr B.P. and has developed progressively since then. There has been little information available on oceanic conditions in the eastern equatorial Pacific (EEP) to constrain explanations for ENSO onset. We report quantitative observations on thermocline and mixed-layer conditions in the EEP during ENSO start up. We found important changes in both the thermocline and the mixed layer, indicating increased upwelling of cooler waters since 7000 cal yr B.P. This resulted from change in the source and/or properties of waters supplying the Equatorial Undercurrent, which feeds upwelling along the equator and the Peru margin. Modeling shows that ENSO is sensitive to subsurface conditions in the eastern equatorial Pacific and that the changes in the thermocline we observed were driven by extratropical processes, giving these a role in conditioning the development of ENSO. This is in contrast to models that call for control of equatorial Pacific oceanography by tropical processes only. These infer stronger upwelling and cooler surface waters for the EEP during the mid-Holocene, which is not supported by our results.”
So could it be that glacial conditions suppress tectonic/volcanic activity and these resurface, as it were, after the peak of warming in interglacials? Will this start to reverse back as we return to glaciation? Or am I reading this wrong?
Willis, WUWT used to be graced by the comments of an oceanographer going by the online handle “sky”. Sky patiently explained on a number of occasions that the wind-driven ocean currents are an order of magnitude above the other types of currents. Almost everyone ignored sky on that important point, possibly an unfortunate consequence of widespread, excessive, & often even exclusive anomaly-think. Sky’s notes dovetail cleanly with patterns in EOP (Earth Orientation Parameters, not to be confused with earth orbital parameters) & AAM (atmospheric angular momentum). Anomaly-think blocks the conceptualization of newcomers (& perhaps even some veterans) from a more lucid awareness of a simple, dominant mode of variability: the year. This is part of the reason why I’m visually [ http://wattsupwiththat.com/2012/01/31/a-japanese-puzzle/#comment-882297 ] drawing attention to the HUGE quantities (climatologies) subtracted out to obtain anomalies. EOP & AAM are not drivers, but rather INDICATORS of climate; this is probably at the root of some of the misunderstandings that pop up every time we try to have a sensible discussion at WUWT about LeMouel, Blanter, Shnirman, & Courtillot’s (2010) seminal demonstration of the solar cycle in terrestrial wind. I’m sure it will take MANY more discussions before more are ready to understand how interannual variability masks the solar cycle envelope in semi-annual terrestrial wind. Hopefully sky will drop by again. In the meantime, people can watch the animations and note the crystal clear parallels between winds, water vapor fluxes, & the major ocean gyres [ http://wattsupwiththat.com/2012/01/31/a-japanese-puzzle/#comment-882297 ]. It could be VERY entertaining to see someone TRY to argue that no such parallels exist. Regards.
Paul Vaughan says:
February 17, 2012 at 4:49 pm
Willis, WUWT used to be graced by the comments of an oceanographer going by the online handle “sky”. Sky patiently explained on a number of occasions that the wind-driven ocean currents are an order of magnitude above the other types of currents. Almost everyone ignored sky on that important point, possibly an unfortunate consequence of widespread, excessive, & often even exclusive anomaly-think.
Like the
http://www.usatoday.com/weather/antarc/sun/2001-01-30-katabatic-winds.htm ?
I really don’t know what this argument is about, I was just browsing, but isn’t that wind a result of warming at the equator and if this is cold, and presumably deep, water flowing northward it will be displacing the warmer waters it meets which will add to the evaporation levels which in turn will strengthen it? Is it part of the Trade Winds pattern that Bill Illis mentions?
Paul Vaughan, thanks for all the puzzle pieces. The link on Low Level Cloud Cover explains a lot. Albedo.
http://i52.tinypic.com/auw1s0.png
The cure for ignorance is more vitamin K (knowledge).
So many variables, so little time.
@Bill Illis says:
February 17, 2012 at 7:07 am
Bill – Thanks for the link. I’ll first out myself as someone who has a lot of difficulty seeing how winds – which pack 1/200th the pushing power of water – blowing at the surface can ‘entrain’ water more than a few feet below the surface. Especially when we are taught that waves are not water moving laterally, but moving up and down in a cycloidal way – this implies that though stronger wind gives more amplitude to waves, it doesn’t do any more than that. And, yes, the more amplitude, the deeper the effect of the wind – but it still is not moving laterally. Or are there things they don’t teach us?
This comment is more for my education than anything, but these following questions I need to get a handle on.
I see what you are saying – there IS a really strong correlation between the Trade Winds and ENSO. As we discuss here fairly often, though, correlation isn’t cause and effect. Especially when you say this:
From my perspective those two facts – very good correlation and that you don’t know what causes the Trade Winds – suggests to me that they might have the equation backward.
From a strictly logical perspective, It seems as likely that the ENSO is driving the Trade Winds as the other way around.
Alternatively – and still just in terms of logic – both ENSO and the Trade Winds might be being driven by some third X factor.
Your uncertainty even carries over to the Western Trade Winds:
Tied together with my doubt that winds actually move water at all (other than up and down, according to the textbooks), the Trade Winds seem to only correlate with ENSO, not necessarily cause it. (Or cause other ocean currents, either.)
Again, I am commenting not to argue, but in order to be educated, with these seemingly contradictory ‘facts’ in my head preventing me from being able to accept this “winds cause currents” concept or “Trade Winds cause ENSO” concept, on the authority of what the climatologists tell us – even with such good graphs as you showed us.
The contradictions lead me to think the answer is not really known, but that someone is confusing correlation with ’cause-and-effect’.
Bill Illis –
I guess what I am saying is, more or less, a question of, “Which came first – the chicken or the egg?”
In the case of chickens and eggs, we know that both actually came from reptiles/dinosaurs.
But then that always begs the question of, “Which came first, the dinosaur or the egg?”
And it certainly applies to all life, as well.
And the life of ENSO, too.
There is a cycle, perhaps, like the carbon cycle or oxygen cycle, in which there is no start – or in which every step is its own start, based on what the local environmental variables are.
Steve Garcia
Paul Vaughan says:
February 17, 2012 at 4:49 pm
Paul, I read what you wrote, and I looked through a selection of the links that you linked in your “A Japanese Puzzle” post … and I came away totally confused.
Perhaps you could boil your main points down to about three, and just put them out there? I’m not going to wander around through the 29! links you posted and try to infer what you are trying to say.
In the classes I’ve taught I emphasize what I call “BCI”. That stands for “brief, clear, and interesting”. I suspect you have interesting points to make … I just don’t know what they might be.
w.
Myrrh says:
February 17, 2012 at 3:33 pm “…that radioactivity is the primary source of the roughly 10% excess heat that the Earth radiates…”
Some of the heat in the Earth’s core and mantle is the result of radioactivity, but more of it is simply heat of compression built up as the forming Earth accreted more and more material and grew larger. Much of that original heat is still contained in the core and mantle, but it tries to escape as it can. Direct conduction through the crust is not very effective – google “geothermal gradient” or go here:
http://www.geol.umd.edu/%7Ejmerck/geol100/lectures/10.html
More efficiently, the innards (asthenosphere) of the Earth are hot enough to flow and thus convect, and bring hot stuff directly to the surface in the spreading centers (mostly hidden in the ocean basins, but cutting through Africa in the East African Rift). In other places, the asthenosphere puts up small plumes of hot material, forming volcanoes as in Yellowstone or Hawaii. Finally, the asthenosphere heats and partially melts cold oceanic crust that is dense enough to sink back into it, and forms arc-related volcanoes, just like the line of volcanos AJ depicts in one of the figures at the top of this page.
That’s where the Earth’s inner heat is escaping, and it is nowhere near amounting to 10% of the Earth’s radiated energy. There is thorium and uranium and some other radionuclides in the Earth’s crust, but the heat they generate is a small number.
Myrrh says:
February 17, 2012 at 4:36 pm “…So could it be that glacial conditions suppress tectonic/volcanic activity and these resurface, as it were, after the peak of warming in interglacials? Will this start to reverse back as we return to glaciation? Or am I reading this wrong?…”
About the only thing glacial cover can do relative to a volcano is increase the pressure on the material beneath it. This pressure might stop a cool magma from reaching the surface (again go here and look at the discussion of “How do magmas form?”:
http://www.geol.umd.edu/%7Ejmerck/geol100/lectures/10.html
On the other hand, if the volcano melts its way through the ice, the pressure release may stimulate an even greater volcanic episode. Recall the situation last year in Iceland where a volcano went active beneath its glacial cap.
As far as tectonics, which I take to mean “plate tectonics” a glacier the size of Antarctica would probably have no measurable effect on the rate of one plate crunching into another, or subducting beneath another. If nothing else, the masses involved are likely different by orders of magnitude, and the glacier is the lightweight.
The hot spot west of Costa Rica is associated with a surface eddy on 02/25/2009.
http://i.imgur.com/L2hMk.gif
More images at http://bulletin.mercator-ocean.fr/html/produits/bestproduct/welcome_anim_en.jsp?zone=pa1
1-2-3 for those short on time/motivation…
1. Near-Surface (850hPa) Wind:
http://i52.tinypic.com/nlo3dw.png
2. Column-integrated Water Vapor Flux with their Convergence:
http://i51.tinypic.com/126fc77.png
3. Wind-Driven Ocean Surface Currents:
http://upload.wikimedia.org/wikipedia/commons/6/67/Ocean_currents_1943_%28borderless%293.png
Question:
What drives the SHARED basin-loops (gyres) of 1-3?
Answer:
Net Surface Solar Radiation:
http://i53.tinypic.com/2r5pw9k.png
—
Extra – for those with time/stamina…
“Apart from all other reasons, the parameters of the geoid depend on the distribution of water over the planetary surface.” — N.S. Sidorenkov
4. Monthly Maximum of Daily Precipitation:
http://i41.tinypic.com/34gasr7.png
5. Evaporation Minus Precipitation:
http://i43.tinypic.com/2isvynb.png
6. Precipitable Water:
http://i52.tinypic.com/9r3pt2.png
Sidorenkov, N.S. (2005). Physics of the Earth’s rotation instabilities. Astronomical and Astrophysical Transactions 24(5), 425-439.
http://images.astronet.ru/pubd/2008/09/28/0001230882/425-439.pdf
Credit: Climatology animations have been assembled using JRA-25 Atlas [ http://ds.data.jma.go.jp/gmd/jra/atlas/eng/atlas-tope.htm ] images. JRA-25 long-term reanalysis is a collaboration of Japan Meteorological Agency (JMA) & Central Research Institute of Electric Power Industry (CRIEPI).
–
Suggestion for feet2thefire:
Consider the relationship between evaporation & wind.
–
For those wishing deeper understanding, carefully study ALL of the animations COMPARATIVELY…
http://wattsupwiththat.com/2012/01/31/a-japanese-puzzle/#comment-882297
…in conjunction with the first few google hits for “thermal wind“:
1. Thermal Wind
http://en.wikipedia.org/wiki/Thermal_wind
=—
“Jet Stream
A horizontal temperature gradient exists while moving North-South along a meridian because the curvature of the Earth allows for more solar heating at the equator than at the poles. This creates a westerly geostrophic wind pattern to form in the mid-latitudes. Because thermal wind causes an increase in wind velocity with height, the westerly pattern increases in intensity up until the tropopause, creating a strong wind current known as the jet stream. The Northern and Southern Hemispheres exhibit similar jet stream patterns in the mid-latitudes.
Using the same Thermal Wind argument, the strongest part of the jet stream should be in proximity where temperature gradients are the largest. Due to the setup of the continents in the North America, largest temperature contrasts are observed on the east coast of North America (boundary between Canadian cold air mass and the Gulf Stream/warmer Atlantic) and Eurasia (boundary between the boreal winter monsoon/Siberian cold air mass and the warm Pacific). Indeed, the strongest part of the boreal winter Northern Hemisphere jet is observed over east coast of North America and Eurasia as well. Since stronger vertical shear promotes baroclinic instability, so the most rapid development of extratropical cyclones (so called bombs) is also observed along the east coast of North America and Eurasia.
A similar argument can be applied to the Southern Hemisphere. The lack of continents in the Southern Hemisphere should lead to a more constant jet with longitude (i.e. a more zonally symmetric jet), and that is indeed the case in observations.”
—=
2. What is the thermal wind?
http://www.theweatherprediction.com/habyhints2/407/
=—
“The first word in the term is thermal. Thermal as you may have guessed deals with temperature. The thermal wind is set up by a change in temperature over a change in distance. When thinking of how the thermal wind sets up think of the polar jet stream. To the north of the polar jet stream the air is cold. Since the air is cold the thickness values (and heights) are lower since cold air is more dense. To the south of the polar jet stream the air is warm. Since air is warm the thickness values are higher since warm air is less dense. A north to south temperature gradient is set up and the height values slope over this distance. When height values slope (think of height contours close together on upper level charts) the pressure gradient force is put into action. It is the Pressure Gradient Force that causes the wind to blow. Whether it is the jet stream, a mid-latitude cyclone or a sea breeze it is the change in temperature over distance that sets the wind in motion. The thermal wind occurs above the boundary layer since friction is not an influence on altering the wind direction aloft.
The wind direction in association with the jet stream generally travels from west to east. This is because the Pressure Gradient Force moves air from higher heights toward lower heights and the Coriolis deflection deflects the air to the right of the path of motion in the Northern Hemisphere. Thus, air moving from south toward north is deflected to the east due to Earth’s rotation. […]
The thermal wind flow parallel to thickness lines. Remember that thickness is a function of temperature. […]
The magnitude of the wind will be a function of how strong the temperature gradient is. When the height contours or thickness values of packed close together then the wind will be strong.
[…] The thermal wind can be thought of as a steering influence for the direction and magnitude that storms move.
[…] the thermal wind is a wind that flow parallel to the temperature gradient in the troposphere. The thermal wind explains the magnitude and direction the wind will take when a temperature change occurs over a horizontal distance.”
—=
3. Thickness and Thermal Wind
http://www.aos.wisc.edu/~aalopez/aos101/wk12.html
=—
“Summary of the Thickness and Wind presentation [ http://www.aos.wisc.edu/~aalopez/aos101/wk12/ThermalWind.ppt ]:
• Cold air is more dense, therefore thinner
• Warm air is less dense, therefore thicker
• Temperature is the only factor that changes the thickness of a layer
• When you have a temperature contrast, you create height variations for a layer
• Height variation create a pressure gradient
• Pressure gradient creates a PGF [pressure gradient force]
• The change in the Geostrophic Wind is directly proportional to the horizontal temperature gradient
This is the Thermal (temperature) Wind relationship”
—=
4. Fronts and the Thermal Wind Equation – Narrowing the Jet Stream
http://www.mit.edu/~predawn/jetstream/thermalwind.html
=—
“One can combine the equations for the geostrophic wind and the hydrostatic balance as discussed in previous sections to obtain the Thermal Wind Equation as shown below. The thermal wind equation states that the change in wind speed with height (here expressed in pressure coordinates) is equal to the (-R/f) times the change in temperature across the front on a constant pressure surface, divided by the pressure. The most important concept from these relations, is that the steep temperature gradients created by the fronts generate winds to satisfy this thermal wind equation, proportional to the strength of the front. The winds are geostrophic and flow along the constant pressure isobars around both poles [2].”
“The effects of these polar fronts are two fold: they concentrate the west to east geostrophic flow at the frontal boundaries where the large temperature gradients induce large thermal winds. Secondly, they also increase the flow with altitude, creating the very fast Jet Stream at high levels around 250mb. […] The strong, high altitude wind centers indicate the location of the Jet Stream!”
—=
Regards.
I wasn’t saying that drilling was killing dolphins. I was quoting the article about the dolphin deaths and I guess I forgot the parenthesis. What I was trying to point out is that there is an unusual event occurring in the neighborhood of this anomaly. Hundreds of dolphins, and who knows how many anchovies, have died. Maybe it is connected in some way – or not.
Paul Vaughan says:
February 17, 2012 at 7:38 pm
No way I’m gonna hack my way through all of that verbiage, Paul. What is your point?
Re-read my request that you be BRIEF. CLEAR. INTERESTING.
I regret to say your post was none of the three. What is it you are trying to say? What is your point, your central core idea that you are trying to get across? It sounds like it might be interesting, so spit it out.
Never mind the citations, they are USELESS unless we first know what it is you are on about. Then, and only then, are they helpful. Until then, following your endless citations is just a guessing game trying to figure out what you mean … and I’m not even slightly interested in playing that game.
w.
If you want to learn about our oceans, I mean really learn,
go here:
http://bobtisdale.wordpress.com/
If you don’t, be careful what you say.
The Earth is a rotating sphere with an atmosphere. As we see with even the gas giant planets this sets-up a general pattern of atmospheric circulation. For Earth, the equatorial winds generally blow to the West, the mid-latitude winds generally blow to the East and vortexes are established at the poles. On Jupiter, there are more latitude bands, some going East, some going West. This is what a rotating sphere with an atmosphere does.
After that, Earth has continents and the geography of mid-depth continental shelves confines the ocean currents to a certain geography. Generally, at least 200 metres of ocean is required to carry a strong current.
ALL the ocean currents are driven by these prevailing winds subject to the confinement of continental geography (and the Earth’s rotation also contributes).
Watch this animation of winds and clouds over one full year, every hour. It is 40 mb but well worth downloading as it is the best explanation of the climate you will ever see.
https://www.ucar.edu/publications/nsf_review/animations/ccm3.512×256.mpg
Now observe the main ocean currents over 30 days last November.
http://www7320.nrlssc.navy.mil/global_nlom32/navo/WHOSP1_nlomw12930doper.gif
Now let’s zoom in and see how the Gulf Stream is really defined by these two issues; equatorial winds blowing west, confinement by mid-depth continental shelves, mid-latitude winds blowing east.
http://www7320.nrlssc.navy.mil/global_nlom32/navo/IASSP1_nlomw12930doper.gif
http://maps.google.ca/maps?hl=en&ll=20.920397,-70.092773&spn=29.197817,67.456055&t=k&z=5
The westerly Atlantic Trade Winds pile the water up against South America. The geography forces the water to the north into the Intra-Americas Sea, the water follows a path which is mid-depth and it flows between Cuba and Mexico into the Gulf of Mexico. Over time, the push of the water from the equator has formed a Loop Current in the Gulf of Mexico. It then flows between Florida and the Bahamas, confined by the available mid-depths again. It flows up to Virginia, where the prevailing winds now shift to blowing East. At 45N, it starts flowing directly across the Atlantic, eventually moving into the north Atlantic north of Norway where again the continental geography and the prevailing winds have forced it to. The Kuroshio Current in the Pacific follows exactly the same pattern. The Agulhas Current follows the same pattern, the Brazil-Malvinus Confluence follows the same pattern.
The Antarctic Circumpolar Current is also driven by the prevailing winds and the continental geography. Sailing Ships could not get through the Drake Passage to the Pacific because of the strong winds and strong currents caused by the West-East winds.
Now this is just the surface. Once the water piles up against a continent, it has to go somewhere. The wind is continually piling up the water. Sometimes it will flow down and form under-currents. Sometimes it will flow backwards against the winds, as the equatorial counter-currents. Most of the time, it will establish large ocean-wind gyres of which there at least 5 major ones.
Wind, geography and rotation.
JimF says:
February 17, 2012 at 6:55 pm
&
JimF says:
February 17, 2012 at 7:09 pm
Thank you JimF, for both posts and the link.
I put in the radioctivity quote for interest because I’d never heard of this before and thought the 10% a lot, doesn’t say where that figure came from.
The other link to http://www.fs.fed.us/ccrc/bibliography/5_3_holocene.shtml
“^ topLoubere, P., M. Richaud, Z. Liu, F. Mekik (2003). Oceanic conditions in the eastern equatorial Pacific during the onset of ENSO in the Holocene. Quaternary Research 60 (2): 142-148
“ABSTRACT: Records from South America show that modern ENSO (El Nino-Southern Oscillation) did not exist 7000 cal yr B.P. and has developed progressively since then. There has been little information available on oceanic conditions in the eastern equatorial Pacific (EEP) to constrain explanations for ENSO onset. etc.”
I found more interesting, but it’s only an abstract and I don’t have easy familiarity with the references, I wondered what the reason for ENSO not existing and then gradually coming into being – just my own speculation about the glacial conditions ‘relaxing’ somehow. I think this would be around the beginning of the Holocene Optimum for that region (but still exploring HO so not yet sure of the sequence), so sea levels would likely be coming up the 300′ plus they rose when we came out of the glaciation – and there would have been the accompanying rises in the land masses as the very great weight of ice disappeared. These don’t always do what one might think, like in Britain for instance, as Scotland rose a couple of hundred feet the South of England sank, Scotland was fully under ice while the South of England not before our Holocene. Anyway, is there an explanation of how it came into being?
@Willis Eschenbach (February 17, 2012 at 9:30 pm)
The comments of Bill Illis (February 18, 2012 at 4:31 am) might be a translation acceptable to you Willis. Note particularly Bill’s last 2 sentences:
“Most of the time, it will establish large ocean-wind gyres of which there at least 5 major ones.
Wind, geography and rotation.”
Thanks Bill – a post well-worth bookmarking and sharing to help efficiently enlighten others:
http://wattsupwiththat.com/2012/02/15/do-underwater-volcanoes-have-an-effect-on-enso/#comment-896133
Bill, it’s obvious that you have experience communicating these concepts.
Willis: Once people get these basics into their heads, we can revisit LeMouel, Blanter, Shnirman, & Courtillot (2010). They made a game-changing finding, but without a handle on the basics of atmospheric circulation, ocean surface currents, & the spatiotemporal nature of interannual terrestrial variability, almost no one around here has recognized the power, simplicity, & beauty of their seminal finding. That includes (very unfortunately) Judith Curry — and there’s really no longer a good excuse as there has now been plenty of time since 2010 to study works like the following to develop the background necessary to understand:
Zhou, YH; Yan, XH; Ding, XL; Liao, XH; Zheng, DW; Liu, WT; Pan, JY; Fang, MQ; & He, MX (2004). Excitation of non-atmospheric polar motion by the migration of the Pacific Warm Pool. Journal of Geodesy 78, 109-113.
http://202.127.29.4/yhzhou/ZhouYH_2004JG_PM_Warmpool.pdf
Gross, R.S. (2007). Earth rotation variations – long period. In: Herring, T.A. (ed.), Treatise on Geophysics vol. 11 (Physical Geodesy), Elsevier, Amsterdam, in press, 2007.
http://geodesy.eng.ohio-state.edu/course/refpapers/Gross_Geodesy_LpER07.pdf
http://geodesy.geology.ohio-state.edu/course/refpapers/Gross_Geodesy_LpER07.pdf
Sidorenkov, N.S. (2005). Physics of the Earth’s rotation instabilities. Astronomical and Astrophysical Transactions 24(5), 425-439.
http://images.astronet.ru/pubd/2008/09/28/0001230882/425-439.pdf
Paul Vaughan says:
February 18, 2012 at 11:34 am
You mean the part where Bill makes the extraordinary and unsupported claim that
I see this all the time. People get a good idea, and then they decide that their good idea is the best idea. Then they get the idea that every single thing is ruled by their good idea.
No, guys, ALL currents are not driven by the wind. If there were no atmosphere at all, we’d still have thermal currents and thermohaline currents. The latter in particular are some of the largest currents in the ocean, so the claim is totally false.
w.
Willis, your conception is wrong. You’ve just lost what little trust I had of you.
JimF re your previous: More efficiently, the innards (asthenosphere) of the Earth are hot enough to flow and thus convect, and bring hot stuff directly to the surface in the spreading centers (mostly hidden in the ocean basins, but cutting through Africa in the East African Rift). In other places, the asthenosphere puts up small plumes of hot material, forming volcanoes as in Yellowstone or Hawaii. Finally, the asthenosphere heats and partially melts cold oceanic crust that is dense enough to sink back into it, and forms arc-related volcanoes, just like the line of volcanos AJ depicts in one of the figures at the top of this page.
I’ve been looking at divergent boundries – http://geology.about.com/library/bl/blnutshell_divergence.htm
“In divergent zones this pulling motion uncovers the hot deep mantle rock of the asthenosphere. As the pressure eases on the deep rocks, they begin to partially melt even though their temperature may fall. (This is called adiabatic melting.) The melted portion expands (as melted solids generally do) and rises, having nowhere else it can go. This magma then freezes onto the trailing edges of the diverging plates, and so the plates grow.
New lithosphere is born hot and cools over millions of years. As it cools it shrinks, thus the fresh sea floor stands higher than the older lithosphere on either side. This is why divergent zones take the form of long, wide swells running along the ocean floor: mid-ocean ridges. The ridges are only a few kilometers high but hundreds wide. The very gentle slope of a ridge means that diverging plates get an assist from gravity, a force called “ridge push” that together with slab pull accounts for most of the energy driving the plates. On the crest of each ridge is a line of volcanic activity. This is where the famous black smokers of the deep sea floor are found.
Plates diverge at a wide range of speeds, giving rise to differences in spreading ridges. Slow-spreading ridges like the Mid-Atlantic Ridge have steeper-sloping sides because it takes less distance for their new lithosphere to cool. They have relatively little magma production so that the ridge crest can develop a deep dropped-down block, a rift valley, at its center. Fast-spreading ridges like the East Pacific Rise make more magma and lack rift valleys. ”
Seems to me could well explain this in AJStrata’s opening post:
“It is fascinating and proves my earlier conclusion that the warm waters of El Niño arise from the eastern pacific and travel west – not the reverse as is the current (now defunct) theory. You need to set the start date on the left to the earliest date in 2007 and the end date to the latest in 2012.”
I wonder if this divergent ridge in the East Pacific is different in being fast spreading because it is newer? If this could account for there being no such critter ENSO before 7000bp, and so, maybe does have something to do with heaving land masses after end of glaciation, and around the Holocene max?
“ABSTRACT: Records from South America show that modern ENSO (El Nino-Southern Oscillation) did not exist 7000 cal yr B.P. and has developed progressively since then.”
Hey, I’m quite taken with the idea…. 🙂
AP?
Thermohaline currents:
http://www.pik-potsdam.de/~stefan/thc_fact_sheet.html
“What is the thermohaline circulation (THC)?
As opposed to wind-driven currents and tides (which are due to the gravity of moon and sun), the thermohaline circulation (Fig. 1) is that part of the ocean circulation which is driven by density differences. Sea water density depends on temperature and salinity, hence the name thermo-haline. The salinity and temperature differences arise from heating/cooling at the sea surface and from the surface freshwater fluxes (evaporation and sea ice formation enhance salinity; precipitation, runoff and ice-melt decrease salinity). Heat sources at the ocean bottom play a minor role. ”
..or maybe they don’t.
http://www.killerinourmidst.com/THC.html for good pics.
P.S. Re my ENSO beginning idea – the abstract I quoted said not much is available on why this didn’t exist – so this idea could be important, couldn’t it (if it was right)? Would that make me a scientist???
Oh yeah, there is the thermohaline ocean circulation of the deep oceans and other medium-depth ocean currents as well. They are driven by the indirect magnetic influence of Saturn.
Myrrh says:
February 18, 2012 at 3:23 pm “…“It is fascinating and proves my earlier conclusion that the warm waters of El Niño arise from the eastern pacific and travel west…”
The spreading ridges have NOTHING to do with El Nino. The East Pacific Rise tops out several thousand meters below the surface – which is where El Nino cavorts. The ridges expand at dizzying rates of 0 to 6 cm (0 to 2.5 inches) a year – not exactly sloshing water around. They don’t contract – acting like an accordion – to put a back and forth motion into water.
They are fascinating in their own right, showing us how the interior earth handles its massive heat content, and giving rise to situations where materials of economic importance can be formed and concentrated. But they don’t have much effect on oceanic water movement, or Earth’s oceanic and atmospheric content, or lot and lots of other things.
Bill Illis says:
February 18, 2012 at 4:07 pm
Oh yeah, there is the thermohaline ocean circulation of the deep oceans and other medium-depth ocean currents as well. They are driven by the indirect magnetic influence of Saturn.
OK, I’m a newbie to all this, but, why can’t they both be in play? We’ve got two huge oceans around us, both heavy fluids subject to density variations. In the atmosphere this fluid is gas and it’s in the differences in density of the gas from temperature, as heated gases become less dense and rise and cooled gases become more dense and sink, which creates the great wind systems, which drive ocean currents. How does the fluid liquid water in the ocean get off being subject to similar effects from temperature differences producing its own convecting ‘winds’? Wind is volumes of air on the move.
If the Earth wasn’t spinning, the atmosphere currents, the winds, would form from the basic heated air rising at the equator and heading towards the poles with the colder polar air coming in beneath, with the spin we get an added pattern.
Maybe this similarly drives the fluid liquid water ocean.
http://www.killerinourmidst.com/grafix/THC%20Frakes.jpg
Actually, how can it not?
“is that part of the ocean circulation which is driven by density differences. Sea water density depends on temperature and salinity, hence the name thermo-haline. The salinity and temperature differences arise from heating/cooling at the sea surface and from the surface freshwater fluxes (evaporation and sea ice formation enhance salinity; precipitation, runoff and ice-melt decrease salinity”
Hot water rises, colder sinks, just as in the ocean of air above us, and salt alters temps, and so on, and, the pull of planets is bound to have an effect – our tides are two-thirds due to the Moon and one third to the Sun – or are you saying these are wind driven?
It would be interesting to contrast the two systems. The atmosphere currents don’t cross the equator.
AJ says in his text:
“It is fascinating and proves my earlier conclusion…”
I hate it when anyone – warmist, skeptic, indie – says something proves something. There are so few things that are actual proofs of anything whatsoever.
The correct assertion is that some bit of evidence “is consistent with” what someone’s conclusion is. Anything beyond ‘consistent with’ displays how black and white someone’s perspective is.’
The statements by Bob Tisdale and Willis are also sometimes couched in such terms, that it is already “known” that such and such is a fact. Given the number of ‘facts’ in science that have been shown to be wrong, I take such statements with a grain of salt, no matter who made them – even Nobel prize winners. After all, if Newtonian physics can be superceded, pretty much everything is fair game. Let’s not forget that everyone ‘knew’ that Aristotle was right – for 2,000 years. Heavy things fall faster than light things, right?
Especially in the field of climatology, every piece of evidence is only an interpretation. Every bit is seen by the warmists one way and by skeptics another. You couldn’t dream up a science that is less certain and less unsettled than climatology. It is, as so many here say, in its infancy. I started out with that perspective, that it is in its infancy, over ten years ago, and I have seen nothing in that time to disabuse me of that perspective. “Jump-to-conclusions-ology” might as well be its AKA.
No piece of evidence proves anything. Least of all in climatology. Climatology doesn’t even have its feed underneath itself yet, and won’t, for probably another 50-100 years. Years from now people WILL look back and laugh at all the claims of proof running around right now. And the one they will laugh loudest at is global warming being caused by humans and our CO2.
But let’s not give them more to laugh at.
Steve Garcia
Given how much statistics there are in climatology, let us never forget Mark Twain’s perspective:
Steve Garcia
Bill Illis (February 18, 2012 at 4:07 pm) wrote:
“Oh yeah, there is the thermohaline ocean circulation of the deep oceans and other medium-depth ocean currents as well. They are driven by the indirect magnetic influence of Saturn.”
Might as well be (for all the minor relative-amplitude they have) — Great sense of humor Bill – (no offense vukcevic!)
Ocean-atmosphere interactions occur guess-where? At the surface. They’re HUGE at the ANNUAL timescale. (yes that’s a sarcastic bite, intended to hopefully awaken those overlooking the obvious…)
I think sometimes that with all the drunken anomaly-think that goes on around here people loose proper perspective on the relative amplitude of THE YEAR.
It’s tragically comical seeing a regular, respected contributor putting multidecadal variations above the year in amplitude. Willis, you’re popular around here, but even you can’t get away with that!
Paul Vaughan says:
February 18, 2012 at 8:41 pm
Bill, you are the one that claimed that ALL currents were driven by the wind. When I point out they’re not, you fall into nonsense. How about a simple “Gee, folks, I was wrong about ALL of currents being caused by the wind.”

Not only that, but you seem to think that the thermohaline currents are in the “deep ocean” …
BZZZT! Nice try, but the thermohaline circulation is at the surface as well as down deep.
Bill, when you are wrong, trying to weasel out of it doesn’t work with me, even if you think it’s funny to bring in Saturn. It’s not, it’s just a sneaky way to avoid admitting you were wrong.
Get away with what? With pointing out that ALL ocean currents are not driven by the wind? You seem to be suffering from some strange fantasy that I said something about the amplitude of “multidecadal variations” … where did I do that, Paul?
As I have said many times, Paul, QUOTE MY WORDS if you disagree with them. Just exactly WHAT are you claiming that I said was wrong? Because your kind of vague attack is underhanded and scurrilous, you are very passionately and emphatically accusing me of doing something very wrong … but what?
w.
PS—And what is “drunken-anomaly think” when it’s at home, other than another way to attack people without actually providing a scrap of evidence for any of your nasty claims?
Of course, not every single ocean current on the planet is driven by the wind. My post was already way too long and I’ve talked about the thermohaline ocean circulation many times before.
There was just some confusion above about the utlimate driver of most of the surface ocean currents so I added in my perspective. It should have been viewed as helpful.
Bill Illis (February 19, 2012 at 4:08 am) wrote:
“There was just some confusion above about the utlimate driver of most of the surface ocean currents so I added in my perspective. It should have been viewed as helpful.”
I certainly viewed Bill’s comments positively.
The key word here is “surface”. Above Bill left it inferred from context when he wrote “ALL”. Here he has clarified explicitly. I often forget to write “surface” when writing of ocean surface currents, so this episode has been instructive.
Hopefully the clarification has resolved the issue for Willis.
To first order, ocean surface currents are wind-driven.
Near-Surface (850hPa) Wind:
http://i52.tinypic.com/nlo3dw.png
Wind-Driven Ocean Surface Currents:
http://upload.wikimedia.org/wikipedia/commons/6/67/Ocean_currents_1943_%28borderless%293.png
Best Regards to All.
Willis,
The diagram of the thermohaline currents you posted is the same as the one at wikipedia, where the explanation begins with the wind:
Wind-driven surface currents (such as the Gulf Stream) head polewards from the equatorial Atlantic Ocean, cooling all the while and eventually sinking at high latitude…
http://en.wikipedia.org/wiki/Thermohaline_circulation
So it appears that wind is an important factor in driving even that current.
This concept was first published at ClimateRealists.com in May of 2009 as “Motive force for All Climate Change” and read into the US Congressional Record as part of the Minority Report on AGW. This “Unified Earth Science Theory” has been further expanded in over 100 articles describing details of these complex processes and is the subject of my chapter in “Slaying the Sky Dragon”. These articles have been crosslinked to over 250,000 websites in twenty languages, and repeatedly dismissed by ‘experts’ who have more orthodoxy than objectivity.
The most revelant of these articles are now posted at the Faux Science Slayer website under the “Geo-nuclear” tab. The undersea “ring of fire” is in fact a near continuous vent line for thousands of miles, discharging massive amounts of heat and the “elemental” by-products of Earth’s variable fission furnace at 3000 to 7000 ft depths. In addition to controlling the climate, this process provides the feedstock for our atmosphere and our planets petroleum production. This is described in “Fossil Fuel is Nuclear Waste”.
An even more stunning insight was the manor in which this massive geothermal energy is stored and hidden in plain sight. That is explained in “Earth’s Missing Geothermal Flux”. All you ‘know’ about Earth Science is flawed and it is past time for a new paradigm
Bill Illis says:
February 19, 2012 at 4:08 am
Bill, what you actually said was:
Now you want to waffle about it, and say “Of course” your statement wasn’t true at all … but that’s what I said, that your statement wasn’t true.
Things are only helpful if they are accurate. Saying (as you did) that ALL surface currents are driven by the wind is neither helpful, nor is it true. You may not like that, and you may not like me for pointing it out … but it is not helpful in the slightest to spread misinformation.
w.
Paul, I’m still waiting for you to explain your attack … you said:
w.
fauxscienceslayer says
http://wattsupwiththat.com/2012/02/15/do-underwater-volcanoes-have-an-effect-on-enso/#comment-896973
Henry @ fauxscienceslayer
The problem is that your theory and the one posted here does not fit in with the results that I am seeing from surface weather stations. Namely, similar to the theory of global warming being caused by increased GHG’s (CO2/CH4 etc), any theory that alleges that more heat than previously is caused by volcanic activity causing some extra warming of earth, presumes that more water vapor and CO2 is released into the atmosphere, forcing minimum temps. up, slowing down cooling, which in turn forces the average temps. up.
That is not happening. Global RH has been declining, not rising. Global warming by increased GHG’s is not happening. So, in the same way, global warming by more volcanic activity is not happening as evident from the results.
http://wattsupwiththat.com/2012/02/15/do-underwater-volcanoes-have-an-effect-on-enso/#comment-893299
It is not the minima rising, during the night, that is forcing up average temps.
It is the maxima increasing, during the day, that is forcing up the average temperature.
http://www.letterdash.com/HenryP/henrys-pool-table-on-global-warming
That clearly implies: the warming of earth must be due to: more (intense) sunshine and/or less clouds and/or less ozone
(there is someone who even thinks that more solar wind can force up maxima, but I have to get some more details on that theory)
Willis
The thermohaline current is driven by the wind.
The currents you depicted as a counter-example are driven by the wind.
Bill was correct. His post on the topic was very enlightening.
Henry P
I am more than happy to discuss science, but that requires you be informed of my Variable Fission Energy Theory, prior to dismissing same. Decay of higher order elements creates multiple ‘daughter atoms’ from the remnant neutrons, protrons and electrons as well as substantial heat. Svensmark made big news with his ‘cosmic rays cause clouds’ by nucleation of atmospheric SOx molecules from 3 nm to 50 nm needed for cloud formation. There is no mention of the continuous source, but supporting charts on the “Forbush Decrease” suggest that these “elemental SOx molecules” have a five day lag time between solar events and atmosphereic changes.
Cosmic and solar neutrinos do not leave known proxies, so variations over time are best shown by proven Sunspot corrolation. A drop of cosmic activity causes a drop in fission heat and fission produced SOx cloud seeding. If you lower the heat into the system, it follows that there would then be a drop in RH. I have been an Earth Science student for decades. There is no other possible explaination for the cyclic and well defined two base temperature states for the Glacial and Interglacial conditions. The Milankovitch Cycle is not set by CO2 changes, nor by “forcings or feedbacks”. It may well be that our Sun is a bit player. The Sun’s signal is strongest due to distance, but it is possible that all solar and Earth climate cycles are part of a Galactic or even Universal harmonics. Ignoring reality neither alters nor removes reality.
I think there is confusion about components and systems. The thermohaline current is not driven by the wind. It is merely the downward-flowing current in certain regions. Wind-driven surface currents happen to deliver water to the surface in those regions. Without the surface currents, different circulations would be created by the thermohaline forces. Without the thermohaline movement, the surface currents at those locations would flow someplace other than down. The existing thermohaline circulation is caused by the combination of its components (including the present continental boundaries).
Faux science player says
If you lower the heat into the system, it follows that there would then be a drop in RH
Ignoring reality neither alters nor removes reality.
HenryP says
Well, I would be interested in reading up on your theory if it conforms more or less to the mechanism of my observations, i.e.
more heat coming in, at a ratio of 7:3:1 maxima:means:minima , meaning it must be due to more to intense heat from the sun and/or less clouds and/or less ozone and / or whatever combination of processes you want to add,
like for example, consider some specific magnetic action or solar wind from the sun that pushes the clouds (that usually does contain small iron particles) more towards the poles instead of allowing it to linger longer at the tropics.
(W/m2 coming in at the equator is 684 whereas on average on earth it is 342 W/m2, going much lower towards the poles)
and,
AT THE SAME TIME
relative humidity dropping at (global) average rate of about -0.02% per annum since 1974.
http://www.letterdash.com/HenryP/henrys-pool-table-on-global-warming
From 2001 (probably already linked up-thread)
El Nino Tectonic Modulation in the Pacific Basin
Leabourne and Adams
http://www.geostreamconsulting.com/papers/Leybourne_Oceans_Fin.pdf
The “Radiative Balance” is a completely FALSE matrix. Massive amounts of Earth’s variable fission energy are hidden in the liquification of super heated, high pressure gases at the undersea vents AND in the endothermic reaction of elemental atoms forced into elemental molecules and elemental compounds. This is understandable if you read “Motive Force for All Clmate Change” and “Earth’s Missing Geothermal Flux” posted at the Faux Science Slayer website.
There is an ongoing private email exchange currently among the worlds top Earth scientists and
i will produce additional articles adding to this already well documented process in the near future. We will first Free Science from the Imperialist….we will then deliver Honest Science to the Empericalists.
FSS says
Massive amounts of Earth’s variable fission energy are hidden in the liquification of super heated, high pressure gases at the undersea vents AND in the endothermic reaction of elemental atoms forced into elemental molecules and elemental compounds
Henry says
It (your theory) does not fit in with (my) observations of surface temperature… If there were some unknown, unaccounted for, heat causing modern warming, or a part thereof, should it not be increasing minima driving up the average temps? That is not happening, if we look at the average global results. Similarly, that is how the carbon dioxide scam can be easily exposed.
http://www.letterdash.com/HenryP/more-carbon-dioxide-is-ok-ok
Thermohaline currents:
http://www.pik-potsdam.de/~stefan/thc_fact_sheet.html
“What is the thermohaline circulation (THC)?
As opposed to wind-driven currents and tides (which are due to the gravity of moon and sun), the thermohaline circulation (Fig. 1) is that part of the ocean circulation which is driven by density differences. Sea water density depends on temperature and salinity, hence the name thermo-haline. The salinity and temperature differences arise from heating/cooling at the sea surface and from the surface freshwater fluxes (evaporation and sea ice formation enhance salinity; precipitation, runoff and ice-melt decrease salinity). Heat sources at the ocean bottom play a minor role. ”
===========
Like the wiki page, this gives some real physics and blows it by fictional fisics memes.
These currents are not wind driven, true, they are driven by density differences, true. The ocean is a fluid liquid medium, these are convection currents arising out of the differences in density between hot water and colder water – this is a huge system. It is inconceivable that the massive amounts of heat being created at the ocean floor by volcanic and divergent ridges isn’t the major player here.
Not a minor role, but the main role in the “thermal” of thermohaline. The heat has to come from somewhere!
Just as in the atmosphere, which is also a heavy fluid medium, (gas is a fluid), heated fluid liquid water in one part of the ocean will rise as it becomes less dense and colder denser water will come in beneath it. This is how we get our winds in the atmosphere – the movement of parcels of air as one hot parcel rises and denser colder air comes in beneath it, volumes of air on the move, convection.
Including water vapour, the fluid gas water is anyway less dense than air, but becomes more so as it takes up heat from the Earth’s surface and rises to the colder heights where it releases it and condenses back into liquid water.
DENSITY differences in both systems. Convection currents in both systems. Both systems are fluid mediums.
One of the links I posted said that divergent ridges take millions of years to cool, the east pacific is a younger system, it is very active with high temperatures: http://eqseis.geosc.psu.edu/~cammon/HTML/Classes/IntroQuakes/Notes/plate_tect01.html
“The region where oceanic lithosphere is manufactured is topographically high because of the high temperatures associated with the thin lithosphere. The thermal expansion of the material beneath the ridge maintains the high elevation and produces a gravitational force that helps slide the two plates apart (this force is called ridge push).
The ridges are regions of earthquake activity. As you should expect, the pulling apart of the two plates is expressed by normal faulting events, which are usually very shall[ow], less than 15 kilometers deep because the high temperature beneath the ridge causes the rocks to deform more easily beneath that depth (and hence you can’t store the strain energy to produce an earthquake).”
High temperatures along all the ridge, “With a little study you can also deduce that the growth rates vary. For example, the east Pacific region is spreading faster than the central Atlantic.”
http://iceagenow.com/Three_Million_Underwater_Volcanoes.htm
http://iceagenow.info/category/volcanoes-leading-us-into-an-ice-age/submarine-volcanoes-more-important-than-we-realize/
AnonyMoose says:
February 19, 2012 at 6:15 pm
I think there is confusion about components and systems. The thermohaline current is not driven by the wind. It is merely the downward-flowing current in certain regions. Wind-driven surface currents happen to deliver water to the surface in those regions. Without the surface currents, different circulations would be created by the thermohaline forces. Without the thermohaline movement, the surface currents at those locations would flow someplace other than down. The existing thermohaline circulation is caused by the combination of its components (including the present continental boundaries).
The downward flowing current would be cold water. Heated water like heated air, will rise.
I’ve just posted this link elsewhere, it has a good description, with pictures, of how convection works in the ocean – the key to this in thermohaline heat is that convection begins by the fluid being heated at the bottom, because of the nature of gases and liquids, that’s how we get currents in air (wind) and ocean, they’re both fluids. Wind is volumes of air on the move and the thermohaline volumes of water on the move.
http://www.qrg.northwestern.edu/projects/vss/docs/thermal/1-how-does-heat-move.html
“When there is heat at the bottom of this air or water, the air or water molecules in contact with the heat start to move, and the molecules spread apart. The heated air or water becomes less dense. It rises up until it gets to air or water with the same density as it has, and when it gets there, it pushes the air or water that was there out of the way. At the same time, new air or water fills the space that was vacated when the heated molecules rose up. The air or water that gets pushed out of the way falls down. This sets up a circular motion. Air or water is heated at the bottom, travels to the top, cools, gets denser, falls, is heated again and the whole cycle starts again. Convection does not occur in space because there is no gravity. “
Myrrh says: “These currents are not wind driven, true, they are driven by density differences,”
No Myrrh. They ARE driven by wind. If density drove the current upon freezing, then the current would oscillate between the poles each year as ice froze and melted at the alternate poles. But it doesn’t oscillate annually, because it is driven by the wind.
The wikipedia page correctly identifies “thermohaline” as a poor and misleading term.
Willis was wrong, Bill was right.
Faux Science Slayer says:
“There is an ongoing private email exchange currently among the worlds top Earth scientists and
i will produce additional articles adding to this already well documented process in the near future. ”
Looking forward to reading the latest.
This has been around a while going by this paper that Google Scholar says is cited 29 times but AGU EOS says 0 times:-
‘More evidence indicates link between El Niños and seismicity’
Daniel A. Walker 1995
In 1988, evidence showed a correlation between the five extreme lows in the Southern Oscillation Index (SOI) from 1964 through 1987 and episodic seismic activity along the East Pacific Rise (EPR) from 20°S to 40°S. This area contains one of the Earth’s most rapidly spreading ridge systems (Figure 1), where large amounts of energy are released through submarine volcanism and hydrothermal activity. Now that another El Nin˜o/Southern Oscillation (ENSO) episode may have drawn to a close, it is time to examine additional seismicity and SOI values.
Observed coincidences are often the basis for discovery, and reviewing the available data led us to note several. Two distinct phenomena—El Niños and earthquake swarms—seem to occur almost simultaneously in spite of their irregular recurrence rates and durations. Also, we found that what may be the longest lasting of the past six Niños coincides with the longest lasting and most anomalous episode of seismic activity, which occurred from 1964 through 1992 along the EPR from 15°S to 40°S.
http://www.agu.org/pubs/crossref/1995/EO076i004p00033-01.shtml
Khwarizmi says:
February 20, 2012 at 2:52 pm
So your claim, Mr. Algorithm, is that it is the wind that causes the ocean water to sink around Antarctica?
I’ll wait here while you explain how that happens, how the wind drives the water from the surface right down to the bottom of the ocean at both poles …
w.
Tide Gauge Data – for a long list of stations – worldwide
http://www.psmsl.org/data/obtaining/
Khwarizmi says:
February 20, 2012 at 2:52 pm
Myrrh says: “These currents are not wind driven, true, they are driven by density differences,”
No Myrrh. They ARE driven by wind. If density drove the current upon freezing, then the current would oscillate between the poles each year as ice froze and melted at the alternate poles. But it doesn’t oscillate annually, because it is driven by the wind.
The wikipedia page correctly identifies “thermohaline” as a poor and misleading term.
Willis was wrong, Bill was right.
I don’t know why wiki is saying that – as I said earlier, I’m a newbie to all this and, I think, I am looking at it with my usual degree of bias, I don’t care who is right or wrong, I would like to know what the truth is because it has interested me. To that end, I have spent some considerable hours searching the internet for information on the subject and reading up on it – I’ve already posted some of that which I found particularly relevant – and overwhelmingly, except for wiki, it is described as not wind driven, but density driven. This makes sense to me, because I do know about density differences in liquids. I can only think that some here don’t understand what “density driven” means because they don’t understand density. To that end, I have given information to explain the very simple science of density in this. I’ll have another go.
Our weather system is density driven. The winds arise because of density differences in the gases which arise because of temperature differences. To begin to get the picture here you first have to have a picture of our atmosphere, it is a fluid ocean of gas with volume and weight. It is not empty space.. There is an immense fluid gas mass pressing down on us, you are walking around with a ton weight of this stuff pressing down on your shoulders. There are solids, liquids and gases, however, both liquids and gases are fluids, in other words, the ocean of gas above us is an entirely apt description of the mass of air which is our atmosphere; it moves as fluids do, things happen in it as they do in fluids, heat travels through it as it does through fluids..
Now, with this picture in mind, when there is part of this ocean of gas being heated the molecules of the gas expand and become less dense. This particular volume of heated gas rises because now less heavy than the gas in the ocean around it. The ocean of gas around it is colder relative to our heated volume’s now hotter state and, being colder means being heavier, more dense, and so the colder volume falls down coming beneath the volume of rising heated gas.
That is all wind is, volumes of gas moving from temperature differences because heat makes a volume less dense and therefore lighter and it rises, and the colder denser and heavier volume of gas moves in beneath to take its place.
Look up inshore and offshore winds, this is the process in a nutshell. The temperature differences arising because water and land have different heat capacities and so different speeds of heating up and cooling down, so the volumes of gas above them are heating up and cooling down at different speeds.
These volumes have different densities, and this means they are exerting different pressures, which is another way of describing this, that winds always flow from high pressure to low. High pressure means colder denser heavier gases and low pressure means warmer less dense lighter gases.
That’s the simple basic of our density driven wind system in our fluid gas atmosphere, Air. Winds are currents in the fluid ocean of gas above us, just as currents are currents in the fluid liquid water ocean, volumes of the medium on the move.
The ocean as a huge volume of fluid will be affected similarly when one volume of it is heated, colder volumes will flow beneath.
Having just had a brief exchange with Connolley, I would think the most likely reason wiki is saying something so strange is that he’s playing his usual mind games.. As Willis has just said, if you say the thermohaline system is wind driven, then produce the winds that do this driving of the current deep in the ocean.. That’s a lot of thousand of miles to account for.
The shape of the current as I see it, will be subject to the same sort of things as currents in the atmosphere; the heat sources, the patterns from a spinning Earth and local topography, can you call it topography beneath the surface? Anyway, if you want to understand what density driven means in the ocean, then study our wind systems in the atmosphere, because they are density driven.
As above, so below..
p.s. A couple of times in my last post I wanted to use the word “gravity” to further explain density, but didn’t because that would have made it much longer, but I’ve found someone who anyway explains it much better than I could. Density driven is also called gravity driven, because basically, this is a gravity driven system which has a greater pull on stuff which has more mass, this is what gives something “weight” relative to another.
What is a gravity current?
Answer: “A density current is any current set up in a fluid because some of the fluid is denser than some of the other fluid. The denser fluid will be acted on by gravity and be pulled to lower areas in the container holding the fluid. The less dense fluid will be displaced at the bottom or lower areas of the container and be forced up. The current, that density current that is created in a fluid, is driven by gravity, and a density current is also termed a gravity current.
Whew! That said, let’s look at some things. The “definition” supplied can be applied to broad areas, and rightly so. There are some advanced applications. But let’s look at one that is often analyzed and is fairly easy to grasp.
In oceanography, water of a different temperature or of a different salt content (salinity) has different densities, and you can probably see where this is going. The colder or saltier water will be more dense, and if a “quantity” of colder or saltier water is “pooled” somewhere adjacent to warmer or less salty water, the more dense water (owing to its temperature or salt content) will, by gravity, be pulled “in and underneath” the warmer or less salty water. This flow is called a density or gravity current.
It really is that simple, but the hydrodynamics involved in the movement of ocean currents is only partly understood. We still have a long way to go to get a handle on it.
In one more example, let’s look at something you’ve already seen. In a container on a table is a chunk of dry ice (solid carbon dioxide). It is submerged in water and is bubbling away. The air in our room is still, and we see the white carbon dioxide gas flowing over the side of the container, across the table and down to the floor. It will even flow across the floor if left undisturbed. There is a physical current of carbon dioxide flowing here. And it is acting the way it is because the CO2 is more dense than the air in our room. A density or gravity current has been set up. You’ve seen this many times in films or on TV. And now you can, if you choose, put a name to the phenomenon. You know why it is happening the way it is.
Note: We’re not really seeing the “white carbon dioxide gas” because CO2 is not visible. We’re seeing just a bit of water vapor in the air condensing in the presence of the cold CO2 gas, and that is what gives the “white” to the scene. Didn’t want you to be confused there.
If you’re investigating density or gravity currents, you’ve just cracked the door. Push it open and see what else there is to see. Start by using the links below for more information.”
From: http://wiki.answers.com/Q/What_is_a_gravity_current
Willis I’ll wait here while you explain how that happens, how the wind drives the water from the surface right down to the bottom of the ocean at both poles …
I am trying to find evidence that the cold “chimneys” actually sink to the bottom in the real world, and not just in words formulated to explain. I am trying to find some quantification of the volume of water displaced downward at the ice boundary each year, and what happens to the flow during the melting phase of the annual cycle. My hasty search parameters are not revealing much, and I have go do some work – so please allow me a day or two (max) to respond in better detail. Cheers.
Happy belated birthday, btw. Every day should be celebrated, so I don’t care if I’m late to the party!
Thanks, Khwarizmi, for the birthday wishes, and for reminding me that every day should be celebrated.
Regarding vertical currents at the poles, you could start with the observations of the noted explorer, Roald Amundsen.
w.
Willis,
The wikipedia page on thermohaline currents begins with wind as the primary factor driving not only water to the poles, but driving most of the density gradient, with evaporation of water causing both (i) cooling and (ii) increased salt concentration at the surface. Salinity increase at the ice growth boundary during winter is just a small seasonal contribution to this bigger thermo-haline picture, apparently, with wind doing most of the thermo-haline work by evaporative cooling. I guess that is why the thawing part of the annual sea-ice cycle doesn’t matter too much in the bigger picture.
At two regions in the North Atlantic to the west and south of Greenland, this cold dense water apparently plunges thousands of meters to the ocean floor without much mixing during transit, arriving at the bottom where it diverted southward in a current that flows morbidly over the wreck of the Titanic (an ideal place to measure the current, according to the maps). But at the next point in this story, where deep cold water is thrust or pulled upward into warmer surface regions, against the apparent gradient, I got lost in what seemed like haline-forced mumbo-jumbo, and returned instead to the pursuit of data supporting the theory.
Apparently there isn’t any.
There is evidence that a trickle of water flows downward from surface regions near the poles, e.g.:
==========
In May 2005, Peter Wadhams reported to The Times of London about the results of investigations in a submarine under the Arctic ice sheet measuring the giant chimneys of cold dense water, in which the cold dense water normally sinks down to the sea bed and is replaced by warm water, forming one of the engines of the North Atlantic Drift. He and his team found the chimneys to have virtually disappeared. Normally there are seven to twelve giant columns, but Wadhams found only two giant columns, both extremely weak.
http://en.wikipedia.org/wiki/Shutdown_of_thermohaline_circulation#Measurements_in_2004.2C_2005.2C_2008_and_2010
==========
But where is the evidence showing that these weak “chimneys” under the Arctic ice “normally sink to the ocean floor”? Again, there isn’t any:
==========
The actual flows in this model are based on current theories of the thermohaline circulation rather than actual data. The thermohaline circulation is a very slow moving current that can be difficult to distinguish from general ocean circulation. Therefore, it is difficult to measure or simulate.
Author: NASA/Goddard Space Flight Center, 14 November 2011
http://en.wikipedia.org/wiki/File:Thermohaline_Circulation_using_Improved_Flow_Field.ogv
==========
So all the currents that we know about are driven by the wind.
Bill didn’t say all currents are driven “exclusively” by the wind, incidentally. Bill was totally correct both semantically and technically, not totally false.
Even the so-called “thermohaline circulation”–if it actually exists as theorized—is driven by the wind, almost exclusively.
Algorithm, a simple thought experiment.
Take the atmosphere away from the earth, and leave everything else the same. Is it truly your contention that under those conditions there would be no currents at all, that the ocean would stop moving?
I say that as long as you heat the ocean at the equator and cool it at the poles, you will have currents with or without an atmosphere. If you want to believe it would all magically come to a halt, I fear I can neither stop you nor help you.
w.
Willis Eschenbach (February 22, 2012 at 10:13 pm) wrote: “[…] a simple thought experiment. Take the atmosphere away from the earth”
An open ocean not permitting evaporation? Fine example of abstract conception hopelessly divorced from thermodynamic reality. Apply for a teaching job at IPCC modeling school. You’ve proven yourself qualified.
Paul Vaughan says:
February 25, 2012 at 7:22 am
Paul, that’s why they call it a “thought experiment”. You could imagine a monomolecular layer of oil on the surface of the ocean if you wish. Or you could make the entire ocean out of oil if you wish.
The point, which you are flailing mightily trying to avoid, is this: thermal circulation is a reality and it doesn’t require wind. The ocean sinks at the poles, not because of the wind, but because it is cold.
As to your snide nastiness about applying for a teaching job, you can stuff that where the sun don’t shine. [trimmed, excessive. Robt]
w.
“We beckon so we can make amends,
and with the same flip of the hand we curse our friends.”
— Lights [ http://www.oilandgasinvestments.com/videos/video/GUXGAKg1o-4/Lights-Peace-sign-lyrics.html ]
Tip: Harald Yndestad, Norway (long record tide gauge data exploration…)
http://ansatte.hials.no/hy/bio/defaultEng.htm
cheers
Discussion raging in a similar vein at Hot Topic. My last comment in response to Mike Palin:-
—————————————————————————————————————————————————–
Richard C2 March 4, 2012 at 6:17 pm
Your comment is awaiting moderation.
“This is absolutely ridiculous. The vast majority of the energy supplied to the oceans comes from above. Period, end of report” –
No Mike, the earth’s heat flows are:-
84 TW solar (reduced by albedo)
44 TW geo (KamLAND)
See:-
http://hot-topic.co.nz/people-talking-6/#comment-30319
http://hot-topic.co.nz/people-talking-6/#comment-30307
http://hot-topic.co.nz/people-talking-6/#comment-30314
http://hot-topic.co.nz/people-talking-6/#comment-30317
http://hot-topic.co.nz/people-talking-6/#comment-30318
http://hot-topic.co.nz/people-talking-6/#comment-30320
From the last comment (30320):-
45.9 GW (climate science geo flux)
44.0 TW (geo-science geo flux)
Climate science is under-estimating geo heat by a factor of 958.6.
But feel free to check my calcs.
——————————————————————————————————————————————————
Willis, I’ve taken your critique of my hydrothermal estimate into account in comment 30317 – you may have further objections.
The thread sequence is broken in a few cases due to it being moved there from another post but we are making do. There is a lot going on up and down from the links above that might be of interest to anyone taking this feed.
The link to the quoted comment above is http://hot-topic.co.nz/people-talking-6/#comment-30322
Re my last comment.
I’m wondering if I’ve found Trenberth’s missing heat.
BTW Willis, I’ve made a comment subsequent to the links above making the correction that I’ve probably over-estimated hydrovent heating by a factor of 100 more or less (rather than 2).
I’m in ‘Permanent Moderation’ at Hot Topic so my comments get held up but others go straight through so give it time.
Re “I’m wondering if I’ve found Trenberth’s missing heat”
Nope, found MUCH more than that. Trenberth’s missing energy is about 1 W.m2, see:-
http://4.bp.blogspot.com/_0ZFCv_xbfPo/S80kvmdKttI/AAAAAAAAAW0/dUxsHgoNpzo/s1600/tren.sci.jpg
That only equates to 510 GW (Surface Area of Earth: 510,065,600,000 m2 )
But 44,000 GW (KamLAND, geo science) – 45.9 GW (0.09 W.m2, climate science) = 43,954 GW
Trenberth’s missing heat (as per Global Net Energy Budget linked) is a minor problem.
KamLAND reports a geo flux of 44 TW (44,000 GW), If the area of the surface of the earth is 510 Gm2, the geo flux is 44,000/510 = 86 W.m2.
‘Earth’s Global Energy Budget’ (TF&K09) allocates a geo flux of, wait for it………
0 W.m2
The salt water/fresh water/land split is: Total salt water surface area: 69.03%; Total fresh water surface area: 1.77%; Total land surface area: 29.2%. http://chartsbin.com/view/wwu
Therefore;-
Geo flux to ocean = 44,000*0.6903 = 30,373 GW
Geo flux to land = 44,000*0.292 = 12,848 GW
I’ve been corrected, the area of the earth is 519,000,000,000,000 = 519 Tm2
519 Tm2 * 0.09 W.m2 = 45.9 TW (climate science geo flux)
This approximates 44 TW (geo-science geo flux)
The fact remains that the geo flux to the ocean is: 44*0.6903 = 30.37 TW
Getting interesting at Hot Topic, my last comment:-
Richard C2 March 6, 2012 at 12:34 am
Mike, working backwards.
My figures:-
84 TW / 510 Tm2 = 0.16 W.m2 (solar)
44 TW / 510 Tm2 = 0.09 W.m2 (geothermal)
Your figures (TF&K09)
82,000 TW / 510 Tm2 = 161 W.m2 (solar)
44 TW / 510 Tm2 = 0.09 W.m2 (geothermal)
I cannot find a reference to your figure of 82,000 TW (82 PW) but I can find 84 TW (Google it). Can you provide a link to a reference supporting 82 PW please?
http://hot-topic.co.nz/people-talking-6/#comment-30366
Off topic here but Rob Painting (Dappledwater), an officionado from Skeptical Science is pushing Peter Minnet’s (Real Climate) bastardization of the cool skin effect at the ocean surface in an attempt to invoke a GHG OHC “forcing” (actually an insulation effect apparently – and bogus) . The posited effect does not appear in IPCC AR4 2007 but the actual physics is documented in ‘Cool-skin warm layer’ Fairall et al 1996. Painting has regurgitated Minnet’s opining at Skeptical Science.
Painting’s response here:-
Dappledwater March 5, 2012 at 10:09 pm
Richard c2 – “The opinion of Peter Minnet that you have been pushing does not appear in IPCC AR4 2007. In short, you are making stuff up.”
Oh, the irony! So why is it that the spectra of outgoing radiation shows carbon dioxide blocking more heat escaping to space? Nothing to do with the tropical tropospheric hotspot by the way – that just shows, once again, that you don’t know what you’re on about.
http://hot-topic.co.nz/people-talking-6/#comment-30363