By Joe Bastardi, Weatherbell Analytics
When the PDO turned cold, most of the meteorological and climate community understood that the pattern was turning very similar the last time of the PDO reversal, the 1950s, and it was a matter of time before the global temperatures, which have leveled off, would start falling in the same herby jerky fashion they had risen when the PDO turned warm at the end of the 1970s. I am not going to rehash the sordid details of how the AGW crowd simply ignores the major drivers of a cyclical nature. We all know that. Nor am I going to question them as to why they believe a trace gas like CO2 (needed for life on the planet) with a specific gravity of 1.5 as compared to the atmospheres 1.0, was going to mix with air in a way to affect the earth’s temperatures. Instead I am going to drive home points I have been making since 2007 and are now dramatically validating.
The La Ninas of 2008-09 and now this one had rapid mid level temperature drops that followed their onset and this years was nothing short of the most dramatic mid tropospheric drop since the start of the millennium. It is much more plausible to believe that rapid cooling in the mid levels would have an effect at leading to extremes, rather than what the warmingistas claim, which of course is anything that happens. In any case, one very interesting level that cooled to record cold levels was 400 mb, the very levels that the so called trapping hot spots were going to show up because of CO2…again a neat trick since somehow CO2 was going to defy the laws of Gravity, since, as mentioned above, its specific gravity is higher than the atmosphere (of course even if it was, it a) has not been proven to cause warming and b) man’s contribution is so tiny as to render it a non item anyway in climate considerations.
However first came the flip in the PDO, seen nicely here on the Multivariate Enso Index chart, which clearly illustrates the colder Pacific when the earth was colder, the start of the warming period coinciding with the satellite era, and now.

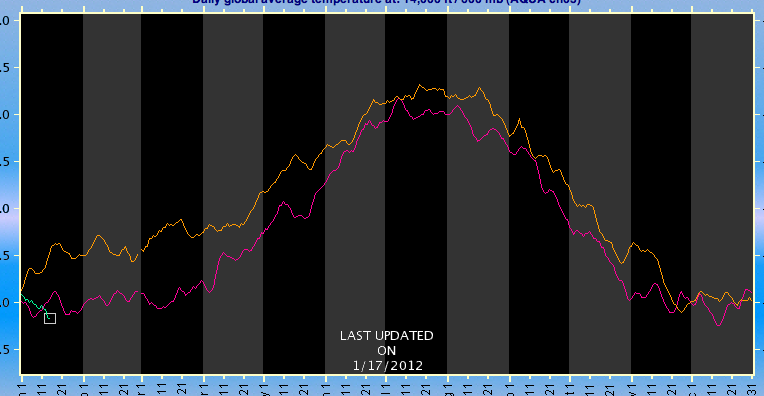
Now from the AMSU site, the amazing one year drop in temperature, the orange tan line being after the El Nino of 2009/10, the purplish line this past year and one can see the green this year, we are near record cold levels again.

600 mb (14,000 feet) (enlarged)
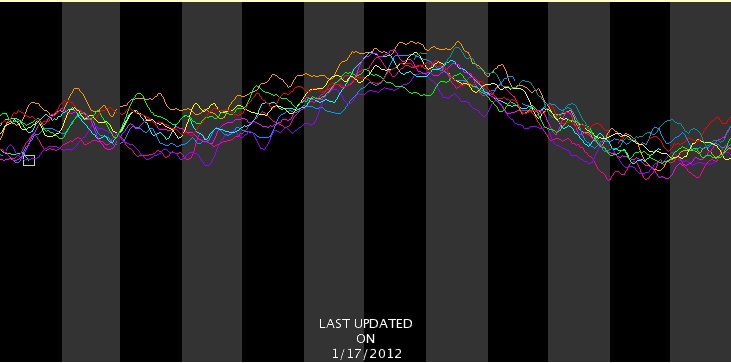
And oh my my, the trapping hot spot itself.. 400mb or 25,000 feet… coldest in the entore decade

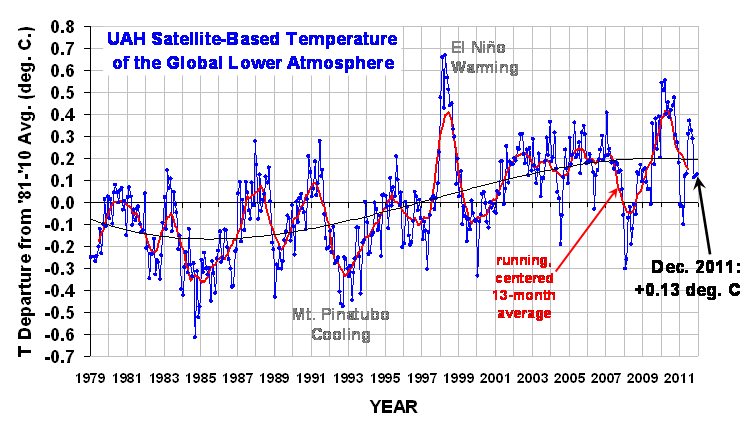
But the 2 meter temperatures, being in the boundary layer, do not respond as fast as the ocean, or a transparent atmosphere above
Nevertheless three downturns in a jagged fashion started predictably after the last El Nino now falling again in fits and spurts through December.
From Dr Roy Spencer’s site:

(enlarged)
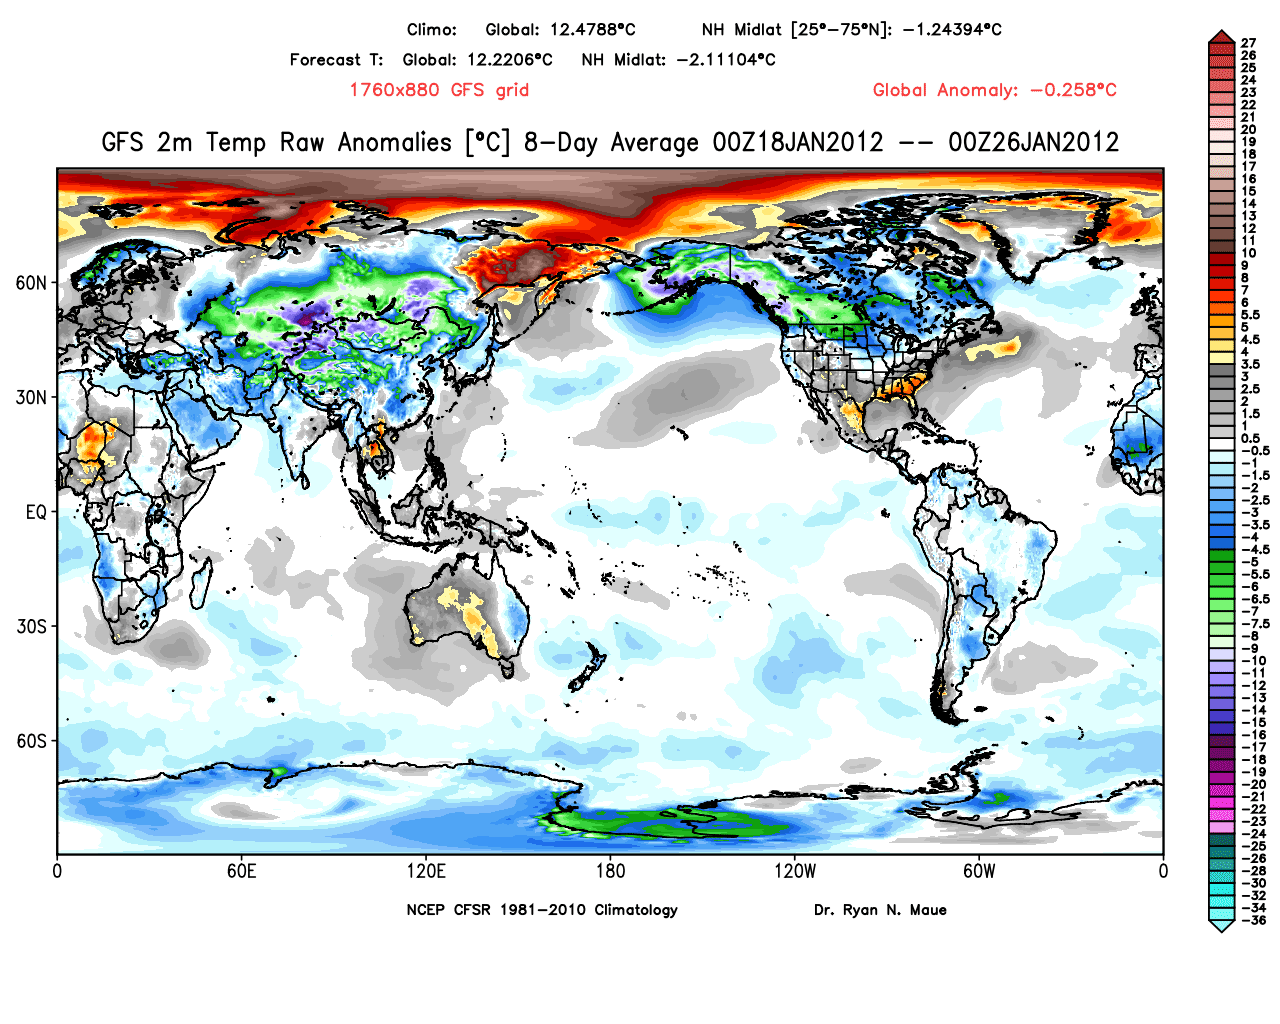
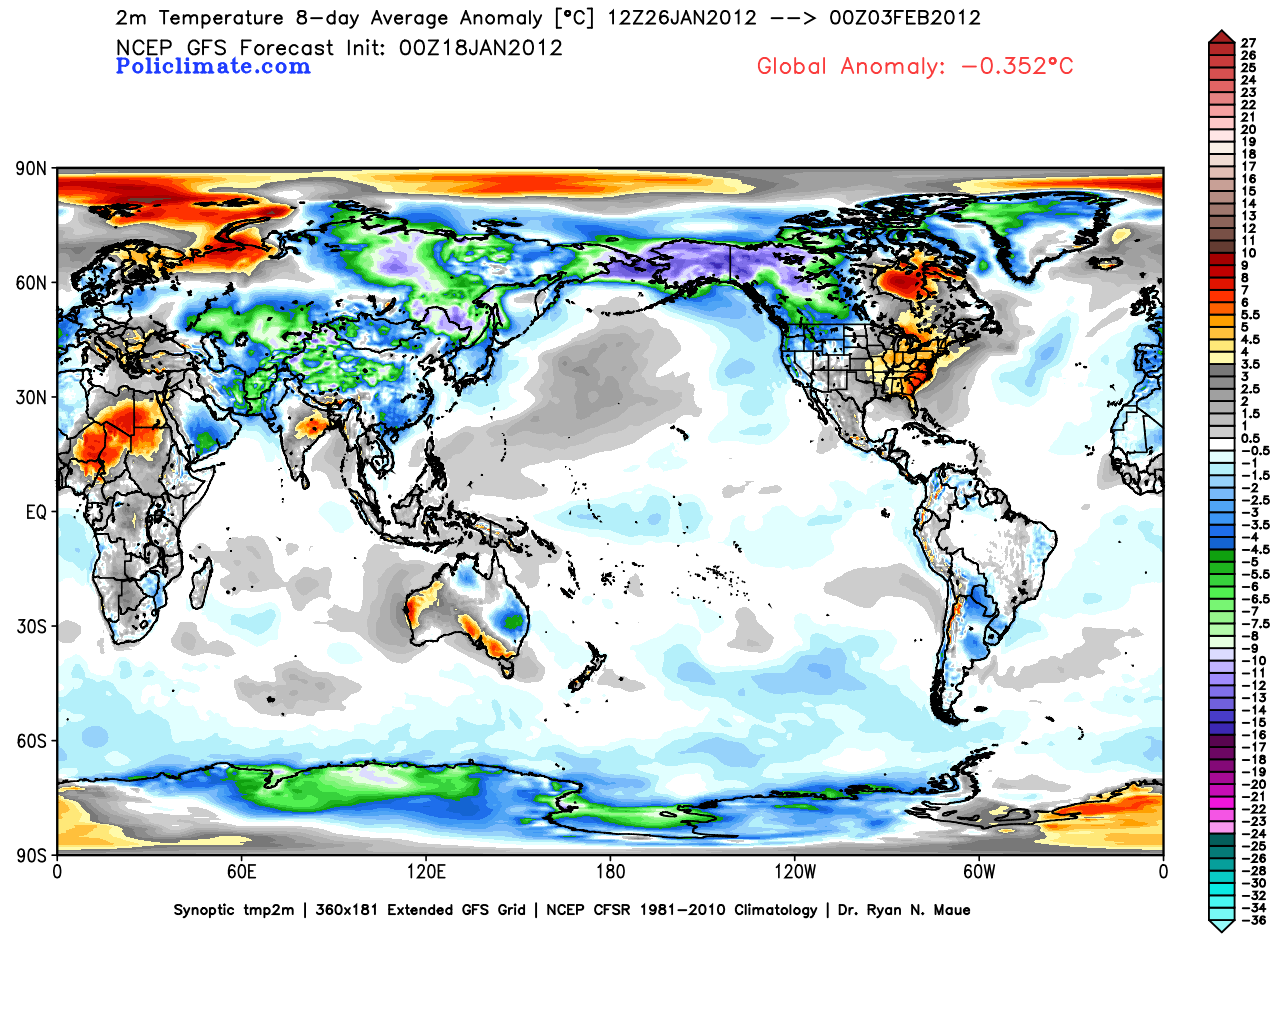
In May, I forecasted the global temperatures to fall to -0.15C in one of the months – Jan, Feb or Mar this year, and perhaps as low as levels we saw in the 2008 La Nina. A rapid free fall has begun. Dr. Ryan Maue at his site (http://policlimate.com/weather/) maintains a plethora of useful forecast information including GFS global temp projections over the next 16 days.
They have been routinely reading greater than 0.2 C below normal and I suspect the Jan reading will plummet quite a bit from December with February even lower. An example of this can be seen with these two charts off Ryan’s site,

-0.258 C globally for 2 meters. (enlarged)

Day 8.5-16 a whopping -0.352 C (enlarged)
The reason the arctic looks warm is that it has been stormy, and when it’s windy the air is well mixed and so the temperatures are not as low as if it’s calm, but it’s still frigid. Notice in the second map, that the arctic cools because the arctic oscillation is starting to go negative, leading to higher pressures and lighter winds. But the most astounding aspect of this is the northern hemisphere mid latitude temperatures, at -2.1 C.
Currently, with gas so high because we are being handcuffed by an administration that won’t drill (if gas was a 1.50 lower, it would be worth a half trillion dollars to the economy) and an EPA that is causing untold economic damage (I would conservatively etiolate a half trillion dollars, from jobs lost to burdensome regulations) along with a 100 billion dollar subsidy to fight global warming world wide, it is costing each ACTUAL TAX PAYER close to 7000 dollars (1.1 trillion divided by 150 million tax payers).
One has to wonder, how even the most dogmatic of them don’t look at the actual facts, how they can continue to carry on their denial while the results of such things handcuff the American economy and cause untold misery for many as our wealth is not only redistributed, but dwindles. One can only conclude this is being done on purpose, and with purpose.
See PDF with enlarged images.
UPDATE: Bob Tisdale disagrees with portions of this analysis and has an essay here.
Rejoice! By crashing the economy, AGWers are going to solve the immigration problem!
an interesting line in the blog there from Joe, and one I would suggest we look into in more earnest – “One has to wonder, how even the most dogmatic of them don’t look at the actual facts, how they can continue to carry on their denial….”
the D word. Perhaps the shoe is fitting the other foot now and it is those with their heads in the sand of CAWG who are indeed the “deniers” Turn their own weapon against them.
Sticking with the “…the global temperatures, which have leveled off,..” meme, Joe? That’s so last week; you must not be aware of HadCRUT4.
James Annan instructs, “… HadCRUT3 under-represents the Arctic warming, so it’s hardly a surprise that … that this improvement increases the recent warming a little relative to earlier years.” http://julesandjames.blogspot.com/2012/01/not-so-fast.html
Joe, Are you claiming that if we measure CO2 levels at altitude that we will find lower percentages than at sea level? That’s what it sounds like.
Don’t know that you will see this comment, Joe, but I’ve been a fan of your for many years (I’m from Harrisburg).
You have always been impressive. Keep up the good fight!
Just a query about the WUWT climate widget page
Is http://wattsupwiththat.com/widget/ first temp graph on page,
apparently showing a REAL TIME temperature from UAH as it shows January 2012 already at -0.01C?
If so great idea please don’t modify as it will be the only real mean (estimated) UAH temperature time graph available as far as I can tell.
Joe you’re use of common sense and basic science will get you nowhere, you need at least, a super computer, various computer models to run on it and vast amounts of green funding to get the ‘right’ answer…
Being sarcastic is tiring, I need a lie down now……
Joe vs. the English language. Joe wins!
Your not you’re! Oops!….
Bold mine. Of course it is. The only way to foist a world government on us is to break the economic back of the developed countries, with the US leading the way as the number 1 target. In a free world, such control cannot happen without creating a scare big enough to convince enough of the kingdom to hand over the keys to the stewards. Most people are willing to sacrifice liberty for security… until it’s too late to understand the true cost of that sacrifice.
Mark
Mr. Bastardi: You are constantly talking about cooling. I don’t see that in the graph from Roy Spencer. What I expect is temperatures to turn back to levels seen in 1983/85 for example. That’s cooling to me. Not what you are trying to illustrate here.
I don’t think there is a single chance that it will go there in the future as long as we keep having an influence on climate.
Face it Mr. Bastardi: CO2 is having some effect on climate. Even Roy Spencer acknowledges that. So in fact we are already looking at the human signal when staring at Roy’s graph.
Do you acknowledge that CO2 is having some effect (Let’s say 1-1.5 degrees C with a doubling of CO2) or do you think CO2 isn’t having any effect at all? I never heard you answering that question.
herby jerky=herky jerky?
I hate to be critical of an excellent piece like that, but since “specific gravity” is by definition related to the density of water, wouldn’t “relative density” be the proper term?
Thanks Joe. A related story…from Alaska
Copper Basin 300 canceled because of ‘impassible’ trail conditions
Jan 16, 2012
FAIRBANKS — The Copper Basin 300 sled dog race is the latest victim of Alaska’s weird winter weather pattern as race officials canceled the event Sunday morning, less than a day after the race started.
…
Temperatures were consistently 45 to 50 below zero, according to race officials.
(I’m assuming -40 F to – 50F, but it hardly matters…)
I think you are drawing an artificial distinction between a climate driven entirely by cyclical processes, or entirely by a linear response to CO2. Why not the two combined? [with some other processes added in for good measure too!]
Thanks, Joe!
What does everyone think of Richard Betts’ post over on nature.com? See: http://blogs.nature.com/soapboxscience/2012/01/18/climate-science-%E2%80%93-moving-beyond-a-single-issue
Nice writeup Joe! It really is sad how obvious it is when looking at the temperature charts going back to 1900 that: 1) there was unexplained “global warming” that peaked in the 40s and 2) a significant part of the recent warming is most likely cyclical too.
Of course, who are we to let facts and reason get in the way of a good cause right?
: )
Joe, your last sentence (One can only conclude this is being done on purpose, and with purpose.) is correct. Pick up a copy of Mark Levin’s new book; “Ameritopia”.
But while the Arctic appears to be warmer than normal due to stormy wather, the accumulation of ice is STILL almost on par with the average freezing pattern of about 10 years ago.
Makes me think, what might become of the northern hemisphere, once all the latent heat contained in the arctic ocean and the lower arctic troposphere will have been released and irradiated into space.
To me, this looks like we are heading into an awfully long, cold late winter/early spring, folks.
After reading McKitric’s postings, I figure that the earth will show a global “cooling” with our current economic downtrend. A lot of what we’re measuring is not global average temperatures, but waste heat from industrial activity.
http://www.rossmckitrick.com/uploads/4/8/0/8/4808045/ac.preprint.pdf
If you assume most of industrial production is concentrated in urban areas, where most of our thermometers are, you find that surface flux has increased about 3 watts or so over the last century due to an increase in energy output -comparable to the 3.7 watts we’d supposedly get from a doubling of CO2.
Oy.
“One has to wonder, how even the most dogmatic of them don’t look at the actual facts, how they can continue to carry on their denial while the results of such things handcuff the American economy and cause untold misery for many as our wealth is not only redistributed, but dwindles. One can only conclude this is being done on purpose, and with purpose.”
IMHO, they don’t look at the facts because, for them, the climate and environment are religious and ideological issues, not scientific ones. Their religious creed or ideological belief system is centered on the Gaia hypothesis with humankind’s activities disrupting the workings of the living organism known as Earth.
I cannot say to what extent the Gaia hypothesis is true. But to the extent that it is treated as a religion today, the only sicence that matters to the Green Left is the “science” that fits in with this belief — including that of climate change. The emotional embrace of and devotion to the “religion” trumps any contrary science — science that is to be ignored and suppressed because the “religion” comes first.
Again this is just my opinion, but in my mind it explains the behavior of climate alarmists and environmentalists in this day and age.
Well said. Hard to look at any particular thing in politics and make any sense at all out of it.
This is causing more and more anger, evidenced in many different ways, against the current system.
We are indeed living in interesting times.
JimB
… and it appears to be predictable:
http://www.vukcevic.talktalk.net/CET-NVa.htm
Further, on your point about the mass of a CO2 molecule, when compared to N2, a quick google search shows up a research paper by Waleter Bischoff (1961), who made a number of measurements of CO2 at different heights above Scandinavia.
He *did* find that on average the concentration of CO2 declined with height, but the rate of this decline is really quite modest – from the highest value of 318ppm below 200m to the lowest value of 312ppm at near to 3km.
This isn’t terribly surprising – there’s a lot of mixing from convection and cyclones and other processes that stop the atmosphere from settling out on the basis of weight.
The sort of fractionation that you are expecting does occur when you go higher up in the atmosphere – I guess above 90km or so.
So, there is plenty enough CO2 in the upper troposphere, and you might want to edit your article to reflect that.
“One can only conclude this is being done on purpose, and with purpose.”
Well duh…… it would be impossible (well, ok, improbable) that politicians were so utterly dumb as to fail to understand the implications of what they collectively legislate therefore we must assume that they know and understand their reasoning and actions. Are they doing this voluntarily or are they doing so under duress? Who is it that is pulling the strings? What are their ultimate aims?
There are many speculative (conspiracy theory) suggestions doing the rounds, some with extremely persuassive reasonings attached. Are there any AGW theorists with the additional global knowledge attending this blog capable of offering any further insight?
I realise this blog isn’t a political one and that this particular subject would be off-topic (of sorts) but it might reveal the thinking behind the warmist agenda and offer a possible counter argument that has greater weight than ‘nit picking’ over technical differences.
Can we allow just this one instance for off-topic speculation/reasoning?
Joe, nice article, but CO2 is pretty well (not perfectly) mixed in the atmosphere in spite of being a denser gas than N2 or O2. Hadley cells and winds do that mixing I suppose, I’m sure you know more than I do about them. And CO2 does contribute to setting the mean height of out-going long-wave radiation (OLR) at somewhere about 10km rather than at sea level. Maybe increasing CO2 can push that OLR height a few tens of metres higher, which may produce a detectable effect on sea level temperatures – or maybe not detectable.
As any lazy boss of a large organization will tell you, the easiest and quickest way not to do the job is just to say “yes” to everything that reaches your desk. When you say “no”, people get unhappy — they complain, they whine, they set up meetings you have to attend, etc. But say “yes” and it’s one quick signature then you’re off to the golf course. I think a lot of what we see from the current administration comes from that sort of dynamic — and with the way the US executive branch works, always saying “yes” leads to lots of stupid regulations from dysfunctional domestic bureaucracies like the EPA. I am confident that deep, dark conspiracies sound too much like hard work to appeal to our current president.
On purpose and with a purpose. It was NEVER about science.
It really is much worse than we thought.
Regards,
Steamboat Jack (Jon Jewett’s evil twin)
What influence does the higher specific gravity of CO2 have when convective mixing is substantial? I don’t disagree with the thrust of this post, but just don’t see the relevance of this factoid.
Joe:
there is 1% Argon in the atmosphere, and Argon’s specific gravity is very close to that of CO2. Now we agree that Argon is well mixed – yes?
Actually Joe, scientists do understand this process pretty well, via a branch of physics called “The kinetic theory of gases.”
Look at it this way: suppose that the atmosphere did settle into layers, organized by molecular weight. Then there would be (in order) a thin layer of CO2 molecules at ground level, then a layer of argon atoms (lighter than CO2), then a layer of of oxygen molecules (lighter than argon), then a layer of nitrogen molecules (lighter than oxygen), and at the top, a layer of H20 molecules. But obviously that doesn’t happen (because if it did, we would all be dead).
Perhaps you would like to amend this opening remark, so that folks appreciate that this aspect of atmospheric science is well-understood?
The other thing that’s always been misleading on their map, is the choice of map.
Take that same anomaly reading an place it on a polar projection – you’ll see just how small that area really is.
Don’t know how to post a picture here, or I’d show you myself…
Here in the Fraser Valley, BC the wind chill was -25 Celsius yesterday. The January all-time recorded low is -26.6.
Does that mean we’ve warmed by 1.6 degrees? /sarc
I like Joe’s straightforward explanations, but I wish he had a proofreader. Even on weatherbell, his writing is sometimes amiss. I don’t think etiolate is what he meant.
Same problem in the UK, stupid government who ignore climate history in favour of a few advisers who are gold plating their salaries whilst the rest of us get poorer trying to keep warm.
One has to wonder, how even the most dogmatic of them don’t look at the actual facts, how they can continue to carry on their denial while the results of such things handcuff the American economy and cause untold misery for many as our wealth is not only redistributed, but dwindles.
How can “they” deny facts and obsessively destroy wealth while Progressively confiscating whatever’s left of it for themselves? They’re Communists, that’s how. Their own poverty of mind = poverty for the rest of us. “Or else!” What they do should be studied as you would any other sub-rational animal, in order to know what they will keep doing to ‘sustain’ themselves – regardless of fact, logic, ethics, science and reason.
Joe,
Thanks for your fine work here.
Arguments pro and con CAWG – whether it’s real, how real, what to do, political / policy considerations; it’s all interesting.
But of most interest to me, are actual meteorological measurements, I mean if there’s global warming shouldn’t we be able to measure it? I am not an earth-sciences professional, but a mechanical engineer and have kept up on CAGW since Climategate 1.0.
Where’s the Global Warming? Where’s the “hotspot”? Why don’t the thermometers and satellites show the effects of man-made CO2? What am I missing? Shouldn’t the immanent catastrophe that is global warming from man-made CO2 be somehow measurable by something, somewhere?
Joe,
You Superstar, thank you for having the guts to openly voice your opinions and confronting the global warming cult.
I would greatly appreciate it if you would please favour us with your analysis of the state of the sea ice ala your days at Accuweather.
Why we have the 5 degree Celsius positive sea temperature anomaly in the North Atlantic around Cape Cod that seems to end when it meets the frigid waters of the Labrador current?
Am I right to view this as an interruption of the mighty Gulfstream heat transfer mechanism so vital to Northern Europe?
I predict the Labrador current will deliver some significant ice into the Titanic catastrophe area around 12-15 April this year to commemorate the 100th anniversary of the sinking of RMS Titanic
Thanks sincerely,
Robert.
Only one problem with this story:
why they believe a trace gas like CO2 … with a specific gravity of 1.5 as compared to the atmospheres 1.0, was going to mix with air
Well, even CFC’s with a specific gravity of over 2 are found up to 15 km in the stratosphere… If CO2 is released with huge quantities at once, it remains near ground and can suffocate (small) animals and even people. But once mixed by wind or heat (turbulence) is stays mixed, thanks to Brownian motion. Only in a stagnant air column it may show a small drop out after a long period of time, as one finds some 1% increase in CO2 after 40 years at the bottom of firn layers in Antarctica (Law Dome measurements)…
The level of CO2 in the atmosphere at sea level (Cape Kumukahi, Hawaii) is the same as at the 3400 m altitude Mauna Loa, Hawaii station…
Robbie says:
January 19, 2012 at 5:36 am
Face it Mr. Bastardi: CO2 is having some effect on climate.
“some effect”? Ok, I will, but only if you admit that “mainstream” Climate Science’s CO2 = CAGW “theory” is a complete failure as judged by and compared to real science. [Which Climate Science is intentionally not doing.]
Why won’t you face reality, Robbie?
The administration has been touting that very fact.
I don’t recall ever seeing the term “etiolate” used in this context.
Yes, we will be cooling for some time. But, the plateau will probably continue until ~2014/15 and when the sc24 starts declining, the cooling will really kick in. I predict at least ~flat linear trend for 1990-2020, if not negative.
“…those with their heads in the sand of CAWG who are indeed the “deniers” Turn their own weapon against them.”
Voila, the CDD – Climate Data Deniers
Curiousgeorge, of course you’re right. Don’t forget to learn Fox and Pivens, Alinsky (dedicated his book to Lucifer?!?) et al. I’m guessing you already know these names, I’d encourage Mr Bastardi to do the same if he isn’t already educated about them.
Mr Bastardi, many thanks for this article, and all your work! Have enjoyed you since radio days doing spots during talk shows!
If Saudi Arabia doesn’t get their income (what is a couple of billion dollars to buy off all the politicians), the Middle East would go up in flames. By not drilling and/or piping, this keeps the price up. Of course the EPA is involved, it is just a tool of the politicians. We just found out about the “back door” financing from NASA to the IPCC.
Gee, quiet Sun, the Earth cools; active Sun the Earth warms. Where else could the energy come from to form the El Ninos (guess its not volcanoes, CO2, clouds or “what ever”). What is the Solar storage mechanism?? How about a puffed up upper atmosphere due to UV???
Sun and UV for the rest of us. CO2 and dollars for them…
Missing troposphere heat, a cold ‘hot spot’, missing ocean heat, how these darned inconvenient facts keep interfering with the message. Quick someone, Mike, Phil, get rid of the PDO!
“Nor am I going to question them as to why they believe a trace gas like CO2 (needed for life on the planet) with a specific gravity of 1.5 as compared to the atmospheres 1.0, was going to mix with air in a way to affect the earth’s temperatures.”
Trace gas – irrelevant. Needed for life – irrelevant. Specific gravity – totally irrelevant. Mixing – totally and utterly irrelevant.
Quite an amazing amount of irrelevance for a single sentence. It seems that you don’t even know the mechanism by which CO2 affects temperatures.
“…somehow CO2 was going to defy the laws of Gravity…”
And it seems that you don’t even understand what convection is.
“man’s contribution is so tiny as to render it a non item anyway in climate considerations”
40% is not tiny.
Maurizio Morabito (omnologos) says:
January 19, 2012 at 5:17 am
Rejoice! By crashing the economy, AGWers are going to solve the immigration problem!
Here, in Latin America, we are witnessing the return of millions of people. It´s real!
So things happen in this world of our Lord: “What goes up…must come down” as the lyrics of a song reads.
You see? that “democratic” thing, when exaggerated, puts the world upside down.
From what Joe says about trace gas and from what he says about specific gravity it looks like Joe utterly misunderstands the mechanism of global warming. He thinks C02 traps heat. It doesnt. that is not the theory.
Joe here is how it works:
The sun radiates energy to the earth across the vacuum of space. In turn the earth radiates energy back to space. Short wave in, longwave out. The various gases in the atmosphere including water vapor are more or less transparent to IR energy. Some of them really transparent, others not so transparent. C02 is rather opaque to IR. How do we know this? Well years of measurements. In fact, we build devices that depend upon this IR blocking fact. Yes, some C02 detectors depend upon this being true. And If you work on IR missiles you also would know this. Here is a simple demonstration showing how C02 is opaque to IR
So what? what does that have to do with warming the planet. The earth must lose the energy it gets back to space. It does this by re radiating. The height in the atmosphere at which energy is re radiated is called the effective radiating height. When we add more GHGs to the atmosphere the atmosphere becomes more opaque to IR. If you need a visual, think of a screen or mesh getting smaller and smaller holes. Those holes or “transmission windows” are how the energy escapes back to space. You should understand these transmission windows. The radars you use in weather forecasting RELY ON the science of transmission windows. They work because this science is sound.
As we add more GHGs we fill up the holes over time and the atmosphere becomes more opaque. This means the effective radiating height of the atmosphere will increase. Energy still escapes back to space, but the earth radiates from a higher and colder altitude. This latter factor is important. With more GHGs the atmosphere is more opaque. Earth then re radiates from a higher colder altitude. The rate at which energy is lost back to space is thereby slowed and the surface is warmer than it would be otherwise. You see GHGs dont warm the planet by getting hot themselves, they slow the cooling of the surface. Slowly, bit by bit, over very long stretches of time
Your PC monitor must be upside down. ;O)
In the 1690s estimates suggest up to a quarter of the Scottish population died from extreme cold during the maunder minimum.
So, before anyone starts rejoicing, may I point out that the world would be a lot better if the global warmists were right.
@ Keith Pearson (formerly bikermailman, Anon no longer) says:
January 19, 2012 at 7:04 am
Curiousgeorge, of course you’re right…………………
========================================
Well, thanks, but I make no claim to being right. In fact, my wife would categorically disagree 😉
That said, there are many flavors of Utopia. These visions of Utopia espoused by various religions, for example, are consistently at odds with all others. Same for political, environmental, and so on. Each of the proponents/leaders of their brand of Utopia insists that “their way is the right way”, whether it be a pope, a president, a prophet, a chairman, or a secretary. They all believe that they are acting in the best interests of the world, and that all others are evil idiots. Hence, the never ending conflict that is the human condition.
What should be understood is that conflict – often violent – is a necessary ingredient of evolution and progress. Without conflict, there is stagnation and eventual extinction.
In Canada, we have taken the parliament back from the nutty left wing. In America they have retrieved their House of Representatives and soon will re-take their Senate and Administration. After that, we run the loons out of environmental science and the world can begin to work and prosper once more.
I think that the climate is driven by the ocean cycles like the PDO plus a 1/2 ° C warming.
There are peer reviewed studies which do a good job of explaining it.
http://people.iarc.uaf.edu/~sakasofu/pdf/two_natural_components_recent_climate_change.pdf
The real warming is the long slow 1/2 ° C which is of interest to climatologists only.
Unfortunately for the alarmists there is no CAGW in evidence now or forever.
Brian Macker says:
January 19, 2012 at 5:24 am
and
Alistair Ahs says:
January 19, 2012 at 6:00 am
I don’t assume (or know the) provenance of this:
http://greenparty.ca/blogs/169/2009-01-03/ppm-co2-altitude-and-mass-co2-atmosphere-8520-metres-beyond-which-there-practic
but must guess (based on it being on a “Green” site) it is close to the original.
steven mosher says:
January 19, 2012 at 7:24 am
“From what Joe says about trace gas and from what he says about specific gravity it looks like Joe utterly misunderstands the mechanism of global warming. He thinks C02 traps heat. It doesnt. that is not the theory.”
Steven,
Thank you for weighing in here reiterating the basics. I appreciate it as I am always learning here at WUWT.
Now considering the radiative physics – would it be incorrect to reason that there should be more instrumental evidence showing effects of the added CO2? And please understand I am not asking the question in some sort of rhetorical way – it’s just that recent satellite data shows a temperature anomaly of 0.13 deg C and here it 2012 already. (Can you believe it’s already 2012!).
The Centigrade and Fahrenheit scales cross at -40, so it doesn’t matter very much.
The Troposphere should be well mixed by weather, above that you’d expect some settling by density.
steven mosher says:
January 19, 2012 at 7:24 am
………
Hi Steven,
I think that video is wrong. Candle needs oxygen (21%) to burn, pumping CO2 next to flame reduces O2, reduce it below 10% and flame will go out, ask any fireman.
Comment from someone working in the compressed/condensed gas industry …”specific gravity” for gasses refers to their relationship to AIR. So 1.5 S.G. is a correct term.
However, Joe almost implies that there would be a layering based on the S.G. At 1 ATM that is generally not true, due to the “ideal gas” behavior of the CO2.
In the upper atm. there is a minor effect.
Max
Alistair Ahs says:
January 19, 2012 at 5:44 am
What does everyone think of Richard Betts’ post over on nature.com? See: http://blogs.nature.com/soapboxscience/2012/01/18/climate-science-%E2%80%93-moving-beyond-a-single-issue
Wise words from Mr. Betts
@steven mosher says:
January 19, 2012 at 7:24 am
Great video!………….But, what does it happen when that round “candle”, above us, diminishes its flame?
http://www.vukcevic.talktalk.net/LFC2.htm
It looks like it is dying!
@steven mosher, just what was the concentration of CO2 in that glass tube shown in the experiement? And just how much CO2, % terms of total atmosphere, will effectively fill in those “transmission windows?”
Mr. Statham – 40% of what, exactly?
steven mosher says:
January 19, 2012 at 7:24 am
As we add more GHGs we fill up the holes over time and the atmosphere becomes more opaque.
According to the “water vapor is a ghg” settled physics, water vapor should have already done it all by itself. But if not, why not? It’s not because water vapor is less “opaque” to IR than CO2, because it isn’t. But if it is, then how will water vapor assist CO2 in producing the alleged CAGW warming, when it couldn’t do it before?
Why hasn’t CO2 = CAGW produced even one relevant correct empirical prediction yet? Is it even possible to falsify CO2 = CAGW? Why not?
Why is it not obvious that the alleged cure to the alleged CO2 = CAGW disease is already well proven to be worse than the alleged disease, which itself has not even happened in any way whatsoever? Would you take a drug known to have multiple ill effects on anyone taking it, in order to prevent a disease which has never existed?
steven mosher says:
January 19, 2012 at 7:24 am
Steven, I see a problem with that CO2 experiment. The CO2 released into the tube is coming from a tank and will fill the tube with very cold CO2 gas. Putting ANY cold gas, including AIR, between the lens and the candle would interfere with the camera seeing the heat through the tube.
He would have to fill the tube with HOT CO2 to prove his claim it to me.
Mr. Bastardi:
Nice, but there is a typo I think in between the two AMSU graphs
And oh my my, the trapping hot spot itself.. 400mb or 25,000 feet… coldest in the entore decade
Mosh:
Very nice explanation of how increased GHG’s contribute to the warming process.
Joe Bastardi predicted that the Global temp would average out at negative 0.5 Celcius or lower for 2011. He was wrong – as he has been with much of his forecasting. He also forecast a recovery in Arctic Sea Ice to pre – 2005 levels – also wrong! And now, just because we see a downward spike, all of a sudden we’re into dramatic cooling territory, when in fact, we’re not much below average. To be average means average for a year – not just a quick dip below the average line, which is what everyone seems to be crowing about.
I keep on saying it and I will continue: there are no data to suggest the globe is cooling – it continues to warm despite 1998. True, it’s not warming in the catastrohic way that some have predicted but warming it is most definately, on a decadal basis.
When and only when, we start to see the graph head down the way in a long term way, can we claim cooling. This hasn’t happened since 2008, so that year is swamped and nullified by the warmth both before and after. We will need to see global temperatures return to what they were in the 1980’s in order for the last 30 years of warming to be nullified. While I concede that this will take time, there is not yet any clear evidence that the process has begun. I remain skeptical in the meantime that negative PDO, low solar irradiance etc will have any significant effect.
spencer admits that the “discover” site contains unverified, uncorrected data. There is no point using these plots
Why do you keep saying:
“Nor am I going to question them as to why they believe a trace gas like CO2 (needed for life on the planet) with a specific gravity of 1.5 as compared to the atmospheres 1.0, was going to mix with air in a way to affect the earth’s temperatures”
This is unsupported by any scientific documents. GHGs do not hold energy so their SG is irrelevant. They slow the radiation leaving the earth – thus at a fixed watts/second input the output must equal this watts/second so the watts out must rise. i.e. the surface temp must rise to radiate more.
Alan Statham says:
Ummmmm. So Alan. 40% of 0.03% is…times this…carry that…wow .That CO2 really is some great gas,eh? A 0.00001% increase cause quadrupling of surface temps! Great ponzi scheme
Speaking of job losses Joe, your administration and the green shirts just passed up 40,000 shovel ready jobs by delaying/cancelling the Keystone.
Oh, and trust me on this, it has nothing to do with wealth redistribution. There are plenty of mechanisms in both the economy and regulation to redistribute wealth. America has been supporting wealth redistribution for centuries, for example, by supporting free basic eduction for all and subsidzing higher learming for many, by supporting public transporation and a national highways program and a wealth of other programs and so on. And I also disagree with those that say these programs haven’t been highly successful.
This is purely a simple greedy money grab by jackbooted greenshirts in league with their new best friend bankers, who want to carbon trade, and with technology scammers, looking to harvest renewables subsidies. This is a concerted effort by the green shirts to return America to a peasant state and then prance around the country like Hitler in Lebensraum telling everyone how happy they are with their new condition.
JPeden says:
January 19, 2012 at 8:33 am
According to the “water vapor is a ghg” settled physics, water vapor should have already done it all by itself.
Water vapour doesn’t fill the whole IR spectrum, there is a “window” where CO2 is active at two frequencies where either water is not active at all or only fills 50% of the spectrum. Thus an increase of CO2 makes the atmosphere more opaque for total IR.
Further, water is very abundant in the lower troposphere, but rapidely lowers in concentration the higher you go, while CO2 is quite well mixed…
It seems to me there are two “camps” in this field.
The Convection/Conduction Camp, and the Radiation Camp.
The Radiation Camp thinks that CO2 is king via radiation.
The Convection Camp thinks Water Vapour is king via convection and conduction.
Meteorologists are in the Convection Camp by default, me thinks.
(Unless they are forced by their bosses to state otherwise on e.g. TV)
Otherwise they would have to deny everything they learned at school ?
I am in the Convection/Conduction Camp, of course.
Here is the latest input from the meteorologists. A real CAGW killer.
Using the alarmist’s prime weapon , models, against themselves;
http://journals.ametsoc.org/doi/abs/10.1175/JCLI-D-11-00443.1
Oreo approach:
First, Joe makes a number of good points that everybody on all sides of CAGW should consider.
Second, Joe goes overboard in his dismissing the temperature impact of CO2 AND by including denunciation of the administration policy on energy and the climate. His calculations may be correct, but their political nature detract from the key points of the article.
Third, unlike Joe’s opponents, he suffers if his conclusions are wrong. Mann, Jones, Hansen, Schmidt . . . can be wrong time and time again — and they still get government funding. If Joe is wrong, his customers will stop buying his product.
This chart should be at the top of the article http://icecap.us/images/uploads/gfs_t2m_anom_plan_16.png
And the article should be the opening article for the next week.
Great article, thanks for posting this.
I really miss Joe’s Weekly’s he did at AccuWeather and his regular comments, now supposedly behind the Weatherbell paywall that doesn’t make much sense for people outside the USA.
So I enjoyed this article written in the familiar Bastardi style.
Keep it up and good luck with Weatherbell
AleaJactaEst says:
January 19, 2012 at 5:20 am
an interesting line in the blog there from Joe, and one I would suggest we look into in more earnest – “One has to wonder, how even the most dogmatic of them don’t look at the actual facts, how they can continue to carry on their denial….”
the D word. Perhaps the shoe is fitting the other foot now and it is those with their heads in the sand of CAWG who are indeed the “deniers” Turn their own weapon against them.
I have a problem with this. As Anthony has said on multiple occasions, the word “denier” has the context of Holocaust denier. Although some on the other side are pointing their fingers and yelling “denier”, if we do the same we become like them. Let us not do this. We are above it. Do not stoop to their level. We cannot have a conversation if we are calling each other nasty names.
steven mosher says:
January 19, 2012 at 7:24 am
I see a problem with the physics of how CO2 is supposed to work, particularly p.46 of a report called the ‘Falsification of carbon dioxide’ at http://arxiv.org/PS_cache/arxiv/pdf/0707/0707.1161v4.pdf
so when can we expect a station by station analysis to justify extreme adjustments such as below which apparently Met O has adopted as the “real” Arctic temperatures Hansen has mutilated beyond recognition?
http://www.Real-Science.com/smoking-gun-hansens-arctic-data
This is beyond confirmation bias.
Henry Galt says:
January 19, 2012 at 8:02 am
There is something wrong with that list at: either it is km, not meters (although, measurements at 2400 km height?) or the ppmv’s are relative to the ground level, which is also impossible: the air pressure at 2400 m is less than at sealevel, but not that low. And real measurements at Mauna Loa (3400 m height) are similar as at the Hawaiian sealevel, because ppmv is a ratio between the number of CO2 volume/molecules to total air volume/molecules, not an absolute level…
That’s what I was thinking, Justthinkin.
Interesting post Mr. Bastardi, but I think you should check out the concept of gas diffusion before banging on too much about the specific gravity of CO2 like you expect it to settle at ground level or something.
Your understanding of weather is very enlightening , your grasp of basic physics may leave you open to criticism.
I only read the first three paragraphs of Joe’s post. They prompted me to write a response:
http://bobtisdale.wordpress.com/2012/01/19/on-joe-bastardis-post-global-temps-in-a-crash-as-agw-proponents-crash-the-economy/
I’m sure many of you have also noted these errors, but I have not yet scrolled through the comments.
Crashing the economy reduces consumption. While reducing consumption likely won’t affect the climate one bit, we will feel better about ourselves as we won’t be killing the planet as much.
~More Soylent Green!
Hmmm – seems to me that CO2, after being released and along its way to becoming this “well mixed” gas, is subject to its heavier-than-air physical reality, which keeps it lower… again, prior to getting stirred up by wind and mixed.
Coincidentally, at this lower altitude where it has just been emitted from, say, my car’s exhaust pipe or the smokestacks at the local coal-burner, a rather large number of biological agents are greedily consuming the stuff, sucking a good portion of it out of the air before it gets to “mix well”.
This is, actually, the reality. We can sit and calculate the “exact” amount of CO2 that our industry and lifestyle emits… but the reality is that only a portion of what we emit actually mixes and travels higher.
Don’t believe it? Try an experiment my dad performed while camping one time. Actually, it was an involuntary experiment, one of the propane canisters for the lantern didn’t quite go in properly and the entire contents spewed out in like 2 seconds. The resulting propane cloud, which has a mass almost identical to CO2, was visible for some time as it settled into the ditches and hung around at ground level before finally dispersing. We could still smell the stuff in the ditches near our campsite for hours, in spite of a breeze ruffling the nearby trees.
Look, the most damming evidence is the amazing drop in mid trop temps. This is above the boundary layer and it would figure the response against the normal would wait. Moreover, Dr Maue’s site was showing temps through December to be running pretty close to what december turned out to be.
You folks that are coming at me about co2 sg, apparently dont understand that simply put, it does not mix well with air. There was just an article about that here on WUWT. So how do you explain the very level that is supposed to be evidence of the GHG trapping hot spot, 400 mb, has plummeted in almost perfect timing with the la nina that came on. How do you explain, the response now evident in the global temps. And by the way, this is astounding, the Northern hemisphere between 25 and 75 n over a degree below normal, and forecasted to go to 2 below normal. You cant just blow that off, especially when you can see what temps have done in relation to the PDO in the past, and the fact that they have leveled off the last 15 years even as co2 has marched up.
So why is it you demand that I listen to your points, and then say, none of the opposite points that are occurring matter? Why is it that a simple test with objective data over the next 30 years, not proxy tree rings ( btw there is no “hockey stick in China as they have shown.. so I guess its everywhere else) or super Nino hansen readjusting temps, cant be the objective arbiter of this argument And by the way, isnt wishing for el ninos to warm the global temps in effect and admission that its the pacific that is in large part controlling the climate. Are you trying to say the minute amount of co2 in the atmosphere is controlling the tropical pacific temps.
It boggles the mind that you ask me to accept such things, when all I ask is we objectively measure right and wrong. The global temp drop now was right in line with what I forecasted in May, that a drop to one of the 3 months, Jan,Feb or Mar to -.15 c would occur. It is not brain surgery, and its not that I am brilliant, its that anyone that is objective about this can see what is going on.
And anyone objective about would agree to the test of this via objective methods ( satellite) that started when we came out of the last cold period. In the meantime enjoy the 5-6 dollar a gallon gasoline this summer and remember who said that under his plan energy prices would skyrocket, and that our energy secretary said we need gas prices the way that had them in Europe.. at that time around 8 dollars a gallon. I for one took them at their word, and you are seeing the results now, all because of a belief in what may be no more than a Utopian Ghost
Where are the trapping hot spots? How are the land masses of the northern hemisphere getting this cold in relation to norm. How can a warming world allow temperatures to crash to levels already in these area not seen since the last cold PDO. Its not Co2 its called nature, and the first part of it is the reversal of the PDO.
Echoing Alan Clark, three cheers for Canada (I can’t believe I actually said that) – the Knucks exited the Kyoto Protocol. Perhaps Oz can regain sanity, send Julia packing, and dump Kyoto too. Alas, probably no hope for the Kiwis (ovine inbreeding too strong – too ba-a-a-ad ;-> ). We need leadership! It isn’t coming from DC.
Nor Sacramento. I’m watching California implode from ground zero. AB32 (GHG limitations) has barely begun to exert its negative influence on our state economy. Projected deficits are all over the map, but likely $13 billion by June. They say the economy is recovering, but that’s all baloney.
Those in charge have benefitted from the hard work and ingenuity of those who came before. They don’t seem to understand how hard it is to build anything, although they do enjoy burning up other people’s money. And they mistake riding on the momentum of the past success of others for their own skill. They blame the creators for unfair outcome, and take from the very people who normally would get us out of this mess.
Cause and effect are reversed in Govland. In reality, you can’t pass legislation to force companies to pay higher wages, or pay higher taxes, and expect them to grow. As a result, unemployment goes up and tax revenue goes down. But the politicians can claim they worked hard for the people. It’s snake oil for the masses. Don’t you feel better now? No? Well just let me fix that some more for you. Repeat ad infinitum until the system breaks. Then they replace the thing you broke with what they actually wanted from the beginning. That’s how you get disasters like Obamacare, Acorn, entitlements of all kinds, EPA….
Baa-a-a-a.
jjthomas~ As Anthony has had to point out in a number of other articles: what part of ‘Joe Bastardi wrote this’ don’t you get?
On August 14, Joe wrote via Twitter, “August Global temps will start to fall and should be down to .2 above normal from .37 in July. Can see it on Dr Maues sit (link follows)” Well, August temps actually only fell to 0.33 C–a drop of just 0.05 C degrees, and not the 0.18 C JB had predicted.
On September 19, JB wrote via Twitter, “Global temp August: Plus .33 C My forecast for Sept: plus .18C ” Well, the September global temperature was 0.29–a drop of just 0.03, and not the 015 JB had predicted.
The December global temps rose 0.01 degrees from November, as November’s temp was unchanged from October’s–and yet Joe tells us here that “Global temps in a Crash”?
Really?
I’d like to believe Joe, I really would; I’d be among the happiest people on the planet if AGW somehow reversed itself, or–better yet–turned out to be wrong in the first place.
If Joe, or Anthony, or this site’s many users, don’t like the idea of mitigating fossil fuel CO2 and other pollutants for ideological reasons, that’s completely understandable. But shouldn’t people at least try to remain honest and unbiased where actual scientific facts are concerned?
justthinkin: “A 0.00001% increase cause quadrupling of surface temps!” – you got both numbers extravagantly wrong there. Try again.
Mardler: “Mr. Statham – 40% of what, exactly?” – The 40% increase in CO2 since pre-industrial times.
Isonomia says:
January 19, 2012 at 7:33 am
/////////////////////////////////////////
Insonomia
You are right to be concerned as to the consequences of a colder climate. With modern techology, short of an ice age, this would not be so much of a concern for us. With cheap energy, GM modified crops, fertilizers, greenhouses, insulated barns for live stock etc, we would cope.
However, the problem for us is that the pursuit of green policies has placed us in a position of unreliable energy and expensive energy at that. There will be many who will be unable to properly feed themselves (due to increase in food costs which costs will escalate if the climate gets cold) and/or properly keep themselves warm due to intermitent energy supplies and unaffordable energy costs.
If there is a downturn in global temperatures (as opposed to a simple stalling) over the course of the next 10 to 30 years things could get interesting and there could well be severe political backlash. You can fudge data but neither governments nor scientists can hide the stark reality of a cold house and ever more expensive energy bills. If brownout occur then it will be fun watching the politicians squirm to save their skins. This might be one of the few pleasures available in such circumstances.
Hi Joe!
Thankyou for a refreshing post!
Please dont take it too bad if commentators focus om some details, I´d guess generally they agree that we are headed for cooling, non the less and I think its super that your show the 400mb story.
You write: “However first came the flip in the PDO, seen nicely here on the Multivariate Enso Index chart, which clearly illustrates the colder Pacific when the earth was colder, the start of the warming period coinciding with the satellite era, and now.”
its very true indeed that Cold PDO normally comes with cooling:
http://hidethedecline.eu/pages/posts/the-siberian-pacific-climate-pendulum-251.php
(also to be found at jo novas)
Does this indicate that PDO is eventually either Sun or CO2 driven: No.
Or ? The thing is: We now have cold PDO (Indicating cooling) but the highest CO2 levels on record and this is not really a strong indicator for CO2 as driver of PDO. That was the short version :-).
Thankyou for posting Joe, we need people to shout out the essential situation.
K.R. Frank
Alan Statham says:
January 19, 2012 at 9:37 am
////////////////////////////////////////////
Leaving aside the debate as to whether the IPCC figure for pre-industrial levels of CO2 is correct, you imply (at least from your earlier post) that the increase from these levels is due to man.
However, man only contributes about 3% to the annual CO2 emissions (about 97% of which are natural). It appears that most of the increase in CO2 is simply a consequence of outgasing from warming oceans. It appears that even if man had not been burning fosil fuels much of the 40% increase would in any event have occurred.
Heh one more thing YOU SHOULD MONITOR THESE THINGS YOURSELF. I challenge each and every one of the AGW believers to watch the global temps on Dr Maue’s site ( they come in 4 times a day.. the 1-8 and 8.5 -16 day projections) and at least have the open mindedness to ask how can the pdo crash, the mid levels crash and now this, with the contention that its warming. These are not minor events. The Nov pdo was 4th coldest nov, the nov-dec was 3rd coldest… similar to the 1950s, which is what we are seeing now… (example hurricanes on east coast.. severe Texas drought, Anchorage snow records). ALL THESE THINGS HAPPENED THE LAST TIME THIS HAPPENED!!. It is astounding that this is either not known, or ignored. But here is the link, and you should be the judge, but for goodness sakes , at least look.
There is record cold at 400mb and 600 mb
and now this.
Is this all just a trick. If you arent looking, then you are hiding FROM THE DECLINE
day 1-8
http://policlimate.com/weather/current/raw_temp_8day_avg.png
day 8.5-16
http://policlimate.com/weather/current/gfs_t2m_anom_plan_16.png
heh anyone wanna bet if it gets that warm in the east, that will be used as evidence for global warming rather than the rest of globe so cold?
There a forecast most of us can agree one
This is right on the money. The AGW movement was hijacked by politics long ago. As to the effects of CO2 on climate, I’m still trying to find it as there is no evidence our climate is warmer or more severe than in previous warm periods. This administration has put green special interests and fascist economics ahead of the good of the nation.
Right on, Joe!
~More Soylent Green!
PLEASE PLEASE PLEASE ……..check out Weatherbell , it is well worth the $$$ for a years veiw of the weather from Joe …….. the daily video’s are worth it , but you get a lot more for your bucks .
Carry on the good work Joe ………. give those hamsters an extra lettuce leaf they work so hard.
steven mosher says:
January 19, 2012 at 7:24 am
“From what Joe says about trace gas and from what he says about specific gravity it looks like Joe utterly misunderstands the mechanism of global warming. He thinks C02 traps heat. It doesnt. that is not the theory.”
You don’t get the impression when you read words of world-reknowned warmists like Dessler and North; count with me: “Heat-Trapping Gases”:
http://www.chron.com/disp/story.mpl/editorial/outlook/6900556.html
Repeat after me: Warmist scientists say CO2 traps heat.
If this cooling scenario plays out in the medium to longer term we should then be justified in calling those in the AGW team “real deniers” which sort of makes it fair, doesn`t it ?
richard verney: “Leaving aside the debate as to whether the IPCC figure for pre-industrial levels of CO2 is correct”
I am not using any “IPCC figure”.
“you imply (at least from your earlier post) that the increase from these levels is due to man.”
It is.
“However, man only contributes about 3% to the annual CO2 emissions (about 97% of which are natural).”
Irrelevant.
“It appears that most of the increase in CO2 is simply a consequence of outgasing from warming oceans.”
The amount of CO2 in the oceans is going up, not down.
“It appears that even if man had not been burning fosil fuels much of the 40% increase would in any event have occurred.”
No it doesn’t. Isotope evidence proves that fossils fuels are the source of essentially all of the extra CO2 in the atmosphere and in the oceans.
You obviously haven’t even educated yourself to the most basic level about this. Next time you comment, try to think a little instead of simply regurgitating anti-scientific tropes that haven’t even got a shred of credibility.
Guinea Pigs…..not Hamsters ……ooopsss……..the Co2 must be getting to me !!!
CodeTech says:
January 19, 2012 at 9:26 am
the reality is that only a portion of what we emit actually mixes and travels higher
That is right, but irrelevant: it doesn’t matter if a molecule of CO2 emitted by humans is captured within a few seconds by the next green leave, or flies around for the next 100 years before being captured by the oceans. What matters is that the total amount of CO2 increases due to the human emissions. If a tree captures some “human” CO2, that means that happens instead of some “natural” CO2 that therefore is not captured, thus the total amount of CO2 in the atmosphere increases anyway.
Only if the total amount of CO2 increases with more than the human emissions, then nature has some contribution. But we see that the increase in the atmosphere is about 50% of the human emissions, thus nature as a whole is a net sink for CO2, regardless if that is original natural or human CO2.
steven mosher @ 07:24 left a link to a video by Dr Ian Stewart. So, just what are Stewart’s recent pronouncements on ‘global warming’? From a 2008 BBC press release relating to his series, ‘Earth – the Climate Wars’, here are a few snippets demonstrating from which perspective he views the ‘science’ of the ‘problem’ and his consensus-backed plan for ‘fixing’ the ‘problem’:
“Until a few years ago, I was a bit of a climate sceptic.”
“What is truly scary about climate change is not any of the specific scenarios of rising seas or melting ice, but the sense that our planet’s climate exists on a knife-edge balance and we really don’t understand what pushes us over the edge, which makes our great chemistry experiment with the world’s oceans and atmosphere all the more short-sighted.”
“If society is to make any progress on effectively dealing with climate change at a regional or global level, what is imperative is that ordinary people help build a political climate at grass-roots level that accepts the problem exists and demands some serious actions by business and government. For me, that begins with people accepting that there is no hiding place left in the science – the overwhelming consensus of the vast body of scientists that study climate is that the trends we are seeing in the air, the oceans and in our ecosystems are entirely consistent with the theory of global warming, while the alternatives offered by sceptical scientists – even the much heralded role of the Sun – so far fail that test.
http://www.bbc.co.uk/pressoffice/proginfo/tv/wk38/feature_earth.shtml
________________________
Same old appeal from authority arguments – incorporating all the usual suspects…..
Excellent post! (puts hands in his pocket and kicks the dirt, stirring up clouds of CO2) – now that we know what all that CO2 is doing (insulating the earth from the atmosphere of course) we can get back to the big picture!
If you on this side of the debate will just STICK to this position – that we are now, FINALLY in the cooling PDO – as we move through La Ninas and El Ninos and the current trend – overall warming, caused by man -continues – will you finally lay down your rhetorical arms and get busy solving global warming?
you can see the writing on the wall – we are in a La Nina, coming out of a strong La Nina – the sun is quiet (and those pesky cosmic rays are NEVER going to amount to anything) and it STILL warming.
But by all means, wait until the dust settles and we get the climate signal through the noise. Now 30 years is the definition of climate – but you surely won’t want to wait that long to be proved RIGHT for once and for ever. So how long? How long do we have to wait for the cooling trend to erase the warming of the 1980s, 1990s and 200s? (To prevent your obvious appeal to your most hated record – no Hadcrut3 here – those guys manipulate data!). Nope It is GISS for us.
And please! THIS time – no reneging on the deal (give it your BEST shot!)
BAU!! (with a nod to the poor, persecuted Mr. Michaels)
Joe, I have to correct you on “…it was a matter of time before the global temperatures, which have leveled off, would start falling in the same herby jerky fashion they had risen when the PDO turned warm at the end of the 1970s.” There was no warming whatsoever in the eighties and nineties that you are talking about – it was all faked. Satellite temperatures cannot see it. What they do see is a series of ENSO oscillations about an average temperature that remained constant for twenty years, until the super El Nino of 1998 arrived. That was the start of real warming, ten years after Hansen’s 1988 testimony that global warming was here and we were to blame. Take any temperature curve that shows that warming, say HadCRUT3, and plot it on the same coordinates as the satellite curve. You will see the same El Nino peaks that satellites show and in between the peaks are cool La Nina intervals. But what strikes you is that the El Nino peaks, at least the four first ones, are all in the same positions in the two curves but La Nina valleys in between have all been made shallow. This gives their curve an upward slope they call the late twentieth century warming. You find the same thing with GISTEMP and worse with NOAA. This manipulation has been going on since the late seventies and continues in the twenty-first century. An example is the absurdity of claiming that 2005 and 2010 were warmer than the 1998 super El Nino. The question is, what changed in the late seventies? For one thing, 1978 was the year when James Hansen, an astronomer on the NASA Pioneer Venus Probe, suddenly transferred to GISS because “The composition of the atmosphere of our home planet was changing before our eyes…” I lived through that period but my eyes somehow missed it. His first task at GISS was to define “The basic GISS temperature analysis scheme … when a method for for estimating global temperature change was needed …” And lo and behold, global temperature started to rise when his method was put to use. They have never published the actual details of how they estimate global temperature change but Climategate tells us that they manipulate temperature and throw away the original data. But they have resolutely refused to use any satellite temperature measurements since the beginning and they still do. The only hint I have is a popular article I read in the nineties which stated that temperatures go up and down but the high temperatures are the real temperatures. I had no interest in any details at the time and Google cannot find the article now. Bur it does not matter because the manipulation of temperatures is there for all to see. See figures 24, 27 and 29 in my book “What Warming?” (Amazon).
Sir, The observation that there must be a global warming cabal is both correct and obvious, in my view. It’s of course difficult to point to the real conspirators among the pure opportunists (scientists and journalists et al). I simplify it this way: Green is the new Red. Those who would have ever wanted the West to go communist is now using AGW/ACC as their vehicle. With plenty of “useful idiots” along for the ride. Our freedom in the US is indeed being threatened. To believe all is well is to whistle past the graveyard.
John Cooper says: “…since “specific gravity” is by definition related to the density of water, wouldn’t “relative density” be the proper term?”
Specific gravity of gases is always with respect to air.
richard verney says:
January 19, 2012 at 9:57 am
However, man only contributes about 3% to the annual CO2 emissions (about 97% of which are natural). It appears that most of the increase in CO2 is simply a consequence of outgasing from warming oceans. It appears that even if man had not been burning fosil fuels much of the 40% increase would in any event have occurred.
Some problems with this: the 97% natural CO2 is only going in AND out the atmosphere. If ins and outs are equal, that doesn’t change the total amount in the atmosphere. In reality it is 97% in and 98.5% out. Thus there is zero net addition from nature to the measured increase as the natural sinks are larger than the natural sources. Only the 3% emissions are the cause of the 1.5% increase in total CO2 per year…
Further the oceans are not the cause, as Henry’s Law gives only 16 microatm more CO2 pressure for 1°C average temperature increase of seawater. Thus an increase of ~16 ppmv CO2 in the atmosphere is sufficient to counter the increase in temperature by the oceans. But the increase is already over 100 ppmv (60 ppmv since the South Pole and Mauna Loa measurements started). In reality the effect of increased temperatures is even less, as the biosphere reacts in opposite way to temperature changes. The real response of the carbon cycle to temperature over the past 800,000 years is about 8 ppmv/°C.
And the oceans have the wrong isotopic composition: quite high in 13C, compared to the atmosphere. Thus any huge release of CO2 from the oceans would give an increase of the 13C/12C ratio of the atmosphere, but we see a continuous, faster and faster decrease in ratio to the human emissions…
See further:
http://www.ferdinand-engelbeen.be/klimaat/co2_measurements.html#The_mass_balance
Joe, I agree with your sentiments, but atmospheric gas layering? I’m at ground level and still breathing…
Hmm. Looks like DaveR (January 19, 2012 at 11:08 am) somehow turned on the italics. Neat!
Sigh…
Missing the point, some of you are…
Contrary to the positive, condescending assertions I’ve just seen two of, No, there is no actual proof or even compelling evidence that human activity is increasing CO2 in the atmosphere. What you have there is a hypothesis bolstered by a belief.
In fact, the more CO2 there is, the more plant life eats it. Plants do this thing, maybe you’ve heard of it… they GROW… and multiply. Plants can be microscopic. Plants and plant life will remove as much CO2 as all human activity can possibly provide. Then, once they’ve consumed as much as they can, they do this other thing common to life: they die.
Nobody’s arguing that there is measurable concentration of CO2 that is human contributed. But it’s rather childishly naive to believe that an increase in CO2 is caused by human emissions.(Correlation != causation). The planet is self-regulating for CO2 concentration, always has been, always will be… otherwise the conditions required for complex life would never have been maintained long enough for us to appear on the scene.
If I do a single will it turn the italics off?
[Turn italics on with: <i>. Turn off with this: </i> ~dbs]
Latest GISS figures: Dec.: 0.45, down from 0.48 in Nov. and 0.54 in Oct.
2011: 0.52, down from 0.63 in 2010.
http://data.giss.nasa.gov/gistemp/tabledata_v3/GLB.Ts+dSST.txt
Really?
I’d like to believe Joe, I really would; I’d be among the happiest people on the planet if AGW somehow reversed itself, or–better yet–turned out to be wrong in the first place.
If Joe, or Anthony, or this site’s many users, don’t like the idea of mitigating fossil fuel CO2 and other pollutants for ideological reasons, that’s completely understandable. But shouldn’t people at least try to remain honest and unbiased where actual scientific facts are concerned?
CO² is not a pollutant. There does that help.
Atmospheric temperatures are responding exactly as expected for a double-dip La Nina. The energy that is not being released from the ocean to the atmosphere is…staying in the ocean! Ocean heat content is at record high levels when looking over the past 30+ years. Very high probabilty of seeing record instrument global atmospheric temps by 2013-2015, as the next El Nino cycle releases that energy and occurs near Solar Max 24.
That is good advice for everyone.
I have switched to “skeptics” and “nonskeptics” — having observed that most other terms serve only to muddle the debate … and said muddling is (obviously) no service to our nation, to our planet, or to our children’s future.
Ian Wi says:
January 19, 2012 at 9:02 am
http://arxiv.org/PS_cache/arxiv/pdf/0707/0707.1161v4.pdf
That was a good read Ian.
CodeTech says:
January 19, 2012 at 11:52 am
Plants and plant life will remove as much CO2 as all human activity can possibly provide.
Sorry, but that is not true on shirt term: plants do grow better with increased CO2 levels: greenhouse growers inject up to 1000 ppmv into their greenhouses to boost growth, but this triple level of CO2 doesn’t tripple the growth. For a doubling of CO2, the average growth of all crops is about 50%, not 100%. Thus while the human emissions are nowadays around 8 GtC/year, the increased CO2 levels only push half of that amount into plants and oceans, not the full 8 GtC/year. About 1.5 GtC extra is absorbed by biolife, about 2.5 GtC extra by the oceans, for about 100 ppmv above the “old” equilibrium (figures extrapolated from the following paper). See:
http://www.bowdoin.edu/~mbattle/papers_posters_and_talks/BenderGBC2005.pdf
If we should stop all CO2 emissions today, yes the CO2 levels would sink, but slower than most here expect (but much faster than what the IPCC expects…). A half lifetime of about 40 years to get rid of the extra 100+ ppmv…
This is not going to end well. We may have both megadrought and crop destroying freezes / delayed spring / summer warmth.
Well, Ferdinand, again you’ve missed the point, but that’s okay.
Since you’re so certain I’ll try to avoid stepping on your belief system.
Ferdinand Engelbeen says:
January 19, 2012 at 12:28 pm
==============================================
http://chiefio.files.wordpress.com/2011/10/nhk-world-jaxa-co2-chart.jpg
The body for all posts is in italics
[Fixed, thanks. This is an occasional WordPress glitch. ~dbs, mod.]
Nor am I going to question them as to why they believe a trace gas like CO2 (needed for life on the planet) with a specific gravity of 1.5 as compared to the atmospheres 1.0, was going to mix with air in a way to affect the earth’s temperatures.
———
What’s this confused hand waving about?
We know damn well how CO2 varies with height because it is measured.
The theory of this is also simple and agrees with measurement.
And the result is —- CO2 does NOT vary much with height at all despite it’s specific gravity.
So Joe makes a claim that is wrong and which also even if correct would have a tenuous relation to the greenhouse effect.
Here Robbie, let me take a stab at this one. NO … A gas (any gas) cannot trap anything! … GHE does not exist! … is impossible! … no matter how much CO2 or pixie dust you add, you will not warm, not 1C, not 1.5C .. not even 0.00001C .. none, notta, nothin’ … case closed
“Face it Mr. Bastardi: CO2 is having some effect on climate. Even Roy Spencer acknowledges that. So in fact we are already looking at the human signal when staring at Roy’s graph.”
Robbie,
Not sure what “signal” you are referring to. If in fact scientists have found thier signal (AGW signal), there would be partying at the IPCC.If such a signal in fact was found, the implications would be enormous, and if that signal could be directly tied to CO2, one would think a group of scientists would be picking up thier Nobel Prize for Science.
Like many Alarmists, you get caught up on short term (12-18 months) weather phenomena. You end up playing wack-a-mole with signals, ice melts, droughts, blizzards, and heat waves. The minute some “extreme” weather event occurs, you wack it over the head and tag it as proof of CAGW (or Climate Change, or Climate Disruption).
Joe Bastardi does have a tendency of getting overly excited at times. But Bob Tisdale’s critiques aside, Bastardi’s points should be listened too. A shift in the PDO represents a long term (30-40 years) shift in global temperatures and weather patterns. But, taken as a whole, the earth doesn’t cool or heat evenly. And as we know with the Little Ice Age, there were plenty of droughts and heatwaves around the world, even as the global temperatures were heading steadily downward (check-out Europe in the 14th and 15 Century). The earth doesn’t normally warm or cool in such drastic fashions as you may allude to. The PDO officially went negative 3 years ago. I seriously doubt the global temps will crash as such as to erase 35 years of warming overnight.
Stephen Mosher: Please help me understand your meaning of the following:
“As we add more GHGs we fill up the holes over time and the atmosphere becomes more opaque. This means the effective radiating height of the atmosphere will increase. Energy still escapes back to space, but the earth radiates from a higher and colder altitude. This latter factor is important. With more GHGs the atmosphere is more opaque. Earth then re radiates from a higher colder altitude. The rate at which energy is lost back to space is thereby slowed and the surface is warmer than it would be otherwise. You see GHGs dont warm the planet by getting hot themselves, they slow the cooling of the surface. Slowly, bit by bit, over very long stretches of time”
It appears that you imply that CO2 emissions will be retained in the atmosphere indefinitely, that is for centuries. I seem to recall several peer reviewed research papers that conclude that retention of atmospheric CO2 is a few years, approximately 7 to 12 years, before it is absorbed and stored by oceans, forests and plants, and soils. This research was based upon empirical data and experiments rather than modeling.
Can you explain the apparent contradictions. What is the period of CO2 emission retention in the atmosphere used in the CAGW theory?
) along with a 100 billion dollar subsidy to fight global warming world wide, it is costing each ACTUAL TAX PAYER close to 7000 dollars (1.1 trillion divided by 150 million tax payers).
——-
So Joe reckons he is an economist now.
Let’s do a reality check. The USA spends around 1.5 trillion dollars per year on it’s security apparatus. Does this cause the US economy to collapse? No it does not. This proves that government expenditure of a magnitude much much higher than that expended on climate change does not harm the economy so Joe’s argument fails.
Personally I would be inclined to fact check everything Joe says.
steven mosher says:
January 19, 2012 at 7:24 am
Why do you continue to use a “radiation only” account of the effects of CO2 on Earth? Even Arrhenius knew that such an approach ignored a plethora of “feedbacks” and “forcings.”
Even Trenberth and his following have opted for a view that contradicts the “radiation only” account. They hold that heat is being stored in the deep oceans. Once you recognize that radiation must be viewed in the contexts of natural processes then you have abandoned the “radiation only” account.
Observations trump theory. Every time. The end.
CodeTech says:
January 19, 2012 at 11:52 am
In fact, the more CO2 there is, the more plant life eats it. Plants do this thing, maybe you’ve heard of it… they GROW… and multiply.
=============================================
It certainly looks that way…..
…and a Japanese satellite agrees with you
http://chiefio.files.wordpress.com/2011/10/nhk-world-jaxa-co2-chart.jpg
Latitude says:
January 19, 2012 at 12:36 pm
From:
http://www.suite101.com/news/japanese-study-of-carbon-dioxide-measurements—the-real-story-a395051
Any figures from this study that show known areas of high CO2 emissions (such as North America, Europe and Asia) to be on the lower end of the scale illustrate that the gound-based networks are better developed in those regions, therefore the rate of uncertainty is low – not that the CO2 emissions measured are low. Likewise, areas that are near the upper end of the scale are in less developed countries, therefore their rate of uncertainty is high – it does not suggest that CO2 emissions in these regions are higher than other regions.
Thus that graph is about the certainty of the CO2 measurements of the satellites vs. the ground based measurements, nothing to do with where the places of highest or lowest emissions are…
paddylol – what is the source for the 7-12 years? There are, as I recall, two rates – a short term rate (which might be what you refer to) and a long term rate (measured in centuries).
Could we stop it already with the “Libruls hate oil” nonsense? The Obama Administration has accelerated the permitting process for drilling, The Brits (evil socialists) and the Norwegian (red-fanged commies) all drill to their hearts’ content.
Keystone XL, you say? Ask the Republican Governors in its path what they think. It is NOT unreasonable to review that proposal properly.
The argument is stronger when it stays non-partisan.
paddylol says:
January 19, 2012 at 12:56 pm
It appears that you imply that CO2 emissions will be retained in the atmosphere indefinitely, that is for centuries. I seem to recall several peer reviewed research papers that conclude that retention of atmospheric CO2 is a few years, approximately 7 to 12 years, before it is absorbed and stored by oceans, forests and plants, and soils. This research was based upon empirical data and experiments rather than modeling.
The 7-12 years (even faster) is the residence time, the average time that any CO2 molecule (human or natural) resides in the atmosphere before being exchanged by a CO2 molecule from another reservoir. That is about 150/800 or slightly over 5 years, as about 150 GtCof the 800 GtC as CO2 is exchanged back and forth between the atmosphere and other reservoirs. That has nothing to do with the excess decay time: we are about 210 GtC (100 ppmv) above “steady state”, as dictated by the current temperature. From this 210 GtC extra some 4 GtC/year is removed into oceans and biosphere. That gives an e-fold time (if we should stop all emissions today) of 52,5 years or a half life time of about 40 years.
Compare the residence time with the turnover of a factory, while the decay time is the gain or loss of the same factory. The turnover of a factory doesn’t tell you anything about what its gain or loss at the end of the year is…
Ferdinand Engelbeen says (January 19, 2012 at 12:28 pm)
“For a doubling of CO2, the average growth of all crops is about 50%, not 100%. ” and
“If we should stop all CO2 emissions today, yes the CO2 levels would sink, but slower than most here expect (but much faster than what the IPCC expects…). A half lifetime of about 40 years to get rid of the extra 100+ ppmv…”
Interesting! Some questions:
(1)Does this mean, in your opinion, that current climate science has underestimated the takeup of CO2 by biosystems?
(2) If so, would this extend the estimated time needed for CO2 to double?
(3) Does your figure of 50% relate to the CO2-munching ability of a given amount of crops, or does it also reflect that more crops would grow in hitherto less-favoured areas?
I think this is an area neglected by the AGW picture.
Ferdinand Engelbeen says:
January 19, 2012 at 1:24 pm
==================
Thanks Ferdinand!
CO2 ppm vs Altitude dervived from the CRC handbook (http://mitochondrally.org/myblog/163-ppm-of-co2-with-altitude-and-mass). I’m not sure on where the CRC handbook get’s it figures.
I’ve done a quick number crunch of ppm(altitude) x pressure (altitude) based on that table, and 99% of the mass of CO2 is below 900m, 95% below 490mm, 90% below 400m, 50% below 170m, 30% below 100m.
pressure(Z) = =100*((44331.514-Z)/11880.516)^5.25587712179759
Z= altitude in metres
Pressure in Pascals
(Equation derived from equation 9 in http://psas.pdx.edu/RocketScience/PressureAltitude_Derived.pdf, orginal from CRC handbook 1996 edition)
By the way Joe, if you haven’t run across it yet, it looks like neither of us get to eat steak this year. Lets see how the next one turns when the current La Nina ends though 😉
http://rankexploits.com/musings/2012/checking-in-on-bastartis-wager/
cui bono says:
January 19, 2012 at 1:46 pm
Current carbon cycle models make a difference in time constant between different reservoirs: a fast response from the ocean surface, but that has a limited capacity (10% of the increase in the atmosphere). Relative fast for the deep oceans and the biosphere and much slower for other reservoirs (chalk deposits in the oceans, silicate rock weathering,…).
Most carbon cycle models use the Bern model sink rates with different speeds and for each reservoir some limit over time. While the latter is true for the ocean surface (due to the Revelle factor), I see no reason for limits – in the foreseeable future – for the deep oceans and/or vegetation, thus the relative fast decay time of about 40 years for CO2 into the deep oceans and vegetation has no limit over time. Only if we burn all oil and gas and a lot of coal, up to 3000-5000 GtC over time, that will substantially increase the deep ocean CO2 content and that will return into the atmosphere, increasing the baseline CO2 content with 6-10% compared to pre-industrial levels for a very long period. But that still is far away today. Thus:
(1) I suppose that they underestimated the sink capacity of both the oceans and vegetation.
(2) Depends of the increase rate of the emissions: at the current, slightly exponential, increase of yearly emissions, the increase in the atmosphere is in a near perfect ratio to the emissions. If the emissions slow down for any reason, the ratio would decrease and with steady emissions, we will reach a new steady state level in the atmosphere where emissions and sinks are equal.
(3) The 50% is for crops in the best circumstances of availability of water, minerals and fertilizers and the optimal temperature. In real life, that depends of the type of crop and the other constraints: temperature, water, nutritients, fertilizers,… An extra advantage of more CO2 is that less alveoles are needed (and formed), that gives less water loss in dry/hot circumstances, thus less water is needed, thus more plant types can grow in such a climate.
Joe could be right about the impact of CO2’s weight. It may be a bigger factor than some think. While it is well mixed in the troposphere it falls off quickly above that level. That means the GHE is bolstered for relatively low concentrations of CO2 by the mixing. However, it also means additional CO2 will mostly stay in the already well mixed troposphere. Hence, the height of the effective radiating layer does NOT increase as much as it would for a lighter gas. The effect of increases in CO2 could very well be minuscule.
I think another factor cooling the Earth could very well be due to the Arctic. There’s no doubt it has been quite warm there. However, the heat has an easier time radiating out since there’s little water vapor and the height of the troposphere is much lower. The lower ice levels also lead to more energy radiating from the oceans. It could very well be we are seeing the Arctic acting as a negative feedback instead of the claimed positive feedback.
LazyTeenager says:
“Let’s do a reality check. The USA spends around 1.5 trillion dollars per year on it’s security apparatus. Does this cause the US economy to collapse? No it does not. This proves that government expenditure of a magnitude much much higher than that expended on climate change does not harm the economy so Joe’s argument fails.”
By your argument we can spend more and more on pointless efforts, and it won’t harm the economy. Lazy, put down the economics Cliff’s Notes and step back. You’re liable to hurt yourself.
Before everybody gets carried carried away, howsabout plotting Jan 2012 UAH daily temps versus their 2008 counterparts? I estimate that Jan 2012 (to the 17th) UAH daily average is still 0.2 C warmer than Jan 4..31 2008 (1st 3 days were missing). January 2008 was the “cold standard” for recent years. If the next 2 weeks’ temperatures keep on crashing like carbon futures, we’ll have a shot at beating Jan 2008. Don’t get worked up about a week of cold temps. A month will show up on the global monthly records. If we get a full season or 2, as opposed to the January 2008 “one-month-wonder”, of cooler temperatures, then it’s worth noting.
>>> steven mosher says: January 19, 2012 at 7:24 am
Nice explanation of GreenhouseTheory, Stephen, but:
a. Where is the increased temperature in the upper atmosphere, or the increased level of radiation? Is there a graph that demonstrates this, because I thought that nobody had found this forecast increase in temperature.
b. Wasn’t it you who wrote a WUWT article on Venus’ atmosphere, saying that atmospheric density was the only required factor? Do you want to revisit that post, bearing in mind the evidence we have seen since then?
.
Steve is only discussing the very big picture. Think of the climate processes on earth as a black box (as opposed to a black body). The big picture question is how does the earth exchange energy with the rest of the universe? In this case, we don’t care where energy is stored inside the box, or how it moves from one part of the box to another. How does it get in and out of the box? There are only three (3) mechanisms for energy transport: conduction, convection, and radiation. In the absense of a physical medium outside the limits of earth’s atmosphere (whever you decide to draw that line), the first two cannot occur. That leaves radiation as the only method for energy to enter and leave the climate system. So the only important question is how does CO2 affect the process of absorbing and re-radiating energy for the earth, whether directly or through it’s effects on other GHG’s?
Ferdinand Engelbeen says (January 19, 2012 at 2:42 pm)
Many thanks Ferdinand.
pidge says:
January 19, 2012 at 2:03 pm
Still the table isn’t right:
– ppmv hardly changes with altitude: it is a ratio of CO2 vs. total air. That doesn’t change if the atmospheric pressure changes.
– if the real amount of CO2 at altitude is what is needed, then you can use the pressure changes: at the surface with 1 bar pressure and 387 ppmv (dry air), the (partial) CO2 pressure is about 384 microatm (wet air). At 0.5 bar (at about 6.000 meter) the CO2 ratio still is 387 ppmv, but the pCO2 halves to 192 microatm. So does the amount of CO2 per m3: halve the amount of air and thus also halve the amount of CO2 at 6,000 meter altitude per m3.
I don’t see any resemblance with the table of Richard J. Belshaw
>>> pidge says: January 19, 2012 at 2:03 pm
>>> 99% of the mass of CO2 is below 900m, 95% below 490mm,
>>> 90% below 400m, 50% below 170m, 30% below 100m.
Eh? You mean 99% of CO2 is below 3000′ (900m) in the atmosphere? Or do you mean below 900mb?
Either way, that does not sound right. Could you check.
Could you do a comparison with the other gasses, as I suspect they all fall off at different rates. The 50% pressure level in the atmosphere, is at 18,000 ft.
Thanks.
.
WOW, been watching this for years now……..amazing stuff……let’s all live in sod houses and ride by bicycles. Oh, just in the USA
Joe Bastardi weote in part:
“Nor am I going to question them as to why they believe a trace gas like CO2 (needed for life on the planet) with a specific gravity of 1.5 as compared to the atmospheres 1.0, was going to mix with air in a way to affect the earth’s temperatures”.
I see this making it easy for one to think that Joe Bastardi believes CO2 does not mix into the middle or upper troposphere or higher.
Thunderstorms in extreme cases lift hailstones in at least the middle troposphere until they weigh a pound or more. It is somewhat common for thunderstorms to have updrafts that raindrops and middle/upper tropospheric snowflakes cannot fall through. Very common milder updrafts would have no problem lifting mere CO2 molecules.
The troposphere and the stratosphere are both within the homosphere, where except for varying content of water vapor and ozone and locally generated gases the atmosphere is essentially homogenous. Since ratios of concentrations of nitrogen, oxygen, and argon to each other are nearly enough constant to an altitude a few times higher than the tropopause is, CO2 would have no problem being spread throughout the troposphere.
In fact, a noted measure of atmospheric CO2 concentration is by the Mauna Loa observatory.
That is around the 600 millibar level, above roughly 40% of the mass of our atmosphere.
GregO says: January 19, 2012 at 6:30 am
Where’s the Global Warming? Where’s the “hotspot”? Why don’t the thermometers and satellites show the effects of man-made CO2? What am I missing? Shouldn’t the immanent catastrophe that is global warming from man-made CO2 be somehow measurable by something, somewhere?
Hi GregO. Big picture. Both the instrumental and thermometer records show a rise of ~0.16C/decade since satellite records began. The troposphere is warming, the stratosphere cooling, night-time temperatures are rising faster than day-time temperatures – all signatures of warming due to rising GHG concentration. Satellite measurement of heat escaping in the CO2 absorption bands show decline consistent with theory. In short, AGW is directly supported by measurement.
What is often “missing” for people is confusion between short term fluctuation and long term trend or regional effects and global behaviour. Consider the implications of the following link: http://www.skepticalscience.com/foster-and-rahmstorf-measure-global-warming-signal.html. As for “imminent catastrophe” that depends on the chosen definitions of “imminent” and “catastrophe”. I suggest Mark Lynas “Six Degrees” for understanding the potential effects of rising temperature and Knutti and Hegerl 2008 for a summary of studies on climate sensitivity http://www.iac.ethz.ch/people/knuttir/papers/knutti08natgeo.pdf.
NASA still losing it
http://earthobservatory.nasa.gov/IOTD/view.php?id=76975
Ralph says (January 19, 2012 at 3:34 pm)
Absolutely. Mountaineers would suffocate.
90% is above 900m. 50% is above 5500m. 10% is above 17000m.
The shuttle Challenger disintegrated on re-entry at 20000m (20km or 13 miles) due to heat from air friction entering a hole in it’s heat-resistant foam. At this height it’s 0.06 bar.
…Or not. There is no sufficient argument from first principles which excludes all of these phenomena from being perfectly natural variations. The inability of models to deliver adequate hindcasts suggests that they lack the perfection necessary to compel us to run around screaming that the sky is falling and cripple our economies shoveling money down “The Bore Hole” of CAGW.
Joe, you’ve always had a knack for the obvious, the facts! Love your work.
Best,
J.
“heat escaping” should read “infrared radiation” in my previous post.
“Joe Bastardi says:
January 19, 2012 at 9:28 am
You folks that are coming at me about co2 sg, apparently dont understand that simply put, it does not mix well with air. There was just an article about that here on WUWT.”
Great article, but sorry, I have to disagree with you here but agree with all others who have pointed this out.
It is a common misconception that buoyancy applies to gases as it does to liquids, however that is not the case. If we take a helium filled balloon in a room, it would rise to the top, however a CO2 filled balloon would go to the bottom. However if we poke a hole in each balloon, the individual molecules spread out very evenly. And in the atmosphere outside, the distribution of all gas molecules with the exception of water vapor, is very consistent. If all heavier molecules would sink to the bottom, then we would never have very heavy chlorofluorocarbons in the stratosphere. Helium atoms do escape from our atmosphere. However it is not due to buoyancy. You could have a CO2 molecule and a helium atom in the same place high in the atmosphere at the same temperature. Being the same temperature means the translational kinetic energy is the same. Kinetic energy is calculated by the formula E = 1/2mv2. Since the helium atom is much lighter than the CO2 molecule, its velocity at the same temperature is much higher so it can reach escape velocity and thereby leave Earth. By contrast, Jupiter has a larger gravitational field and a lower temperature than Earth, so it can hold on to its hydrogen and helium.
As far as the article on WUWT that you are referring to, if it is the one I am thinking of, then it showed that the CO2 varied between 360 and 390 ppm at different places on Earth due to where CO2 is produced and where it is used up and how long it takes to reach equilibrium throughout the atmosphere. But this lumpiness was NOT due to altitude.
Werner Brozek (retired physics teacher)
Thanks for your article Joe, your assessment of the importance of the PDO is astute and accurate. I see that as soon as the PDO is mentioned Tisdale chimes in attempting to discredit the PDO or authors associated with it (at the base of your post). Tisdale was recently quoted saying ” the PDO is an after effect of ENSO” but when pushed has failed to provide solid evidence. In fact during 2011 we see the typical warm water in the Pacific northwest associated with a cool PDO driving the double dip La Nina. This is an important observation.
Keep up the good work, the thrust of your statements ring true.
Ammonite says:
January 19, 2012 at 3:52 pm
GregO says: January 19, 2012 at 6:30 am
Ammonite,
Thanks for the reference – I just got in and I’ll give it a read later
JP says: “Joe Bastardi does have a tendency of getting overly excited at times. But Bob Tisdale’s critiques aside, Bastardi’s points should be listened too. A shift in the PDO represents a long term (30-40 years) shift in global temperatures and weather patterns.”
JP, people give too much credit to the PDO. You may think this is nit picking, but the negative PDO simply means that ENSO has shifted and/or that North Pacific Sea Level Pressure has shifted. The PDO only represents the spatial pattern of North Pacific SST (east vs west & central). You can raise and lower the North Pacific sea surface temperature, but if spatial pattern in the North Pacific remains the same, the PDO remains constant.
Joe, if you are saying that there is a large variation of CO2 concentration as a function of altitude, that is simply wrong empirically. It’s several ppm or so at most. If you are saying that well-mixed gases of different molecular weights will spontaneously separate themselves in a 1g gravitational field, that is also wrong. Pure gases such as argon or carbon dioxde that are denser than air can be made to puddle in low spots for a short while, but if the low spot is open to the atmosphere, it never lasts. Diffusion and convection mix everything.
Geoff Sharp says: “Tisdale was recently quoted saying ” the PDO is an after effect of ENSO” but when pushed has failed to provide solid evidence.”
THAT IS NOTHING LESS THAN A LIE.
The fact that you, Geoff, cannot grasp why the PDO is an aftereffect of ENSO reflects on your misunderstanding of the PDO and ENSO.
You continued, “In fact during 2011 we see the typical warm water in the Pacific northwest associated with a cool PDO driving the double dip La Nina. This is an important observation.”
It’s a useless observation because the warming of the Kuroshio-Oyashion Extension is not limited to double-dip La Nina events. It is a response to La Nina events in general.
Smokey says:
January 19, 2012 at 3:08 pm
////////////////////
Further to your point, leaving aside the moral issues as to whether it is right to spend lots of money on defence, the fact is that it provides employment and real jobs for many many people and it is a signifcant source of foreign revenue earnings. All of which benefit the economy.
Spending on climate mitigation is the opposite. No real jobs, the exportation of industries abroad and a source of foreign expenditure all of which depress the economy.
Ammonite wrote:
“Both the instrumental and thermometer records show a rise of ~0.16C/decade since satellite records began. The troposphere is warming, the stratosphere cooling, night-time temperatures are rising faster than day-time temperatures – all signatures of warming due to rising GHG concentration. Satellite measurement of heat escaping in the CO2 absorption bands show decline consistent with theory. In short, AGW is directly supported by measurement.”
As always the devil is in the details… The lower stratosphere has not really cooled since circa 1995. The 15 year trend is essentially flat. I suppose you could argue that a particular point of view has been vindicated by the fact that the longer term 30 year trend is for cooling. In the same sense that you could argue that the long term trend for the troposphere remains one of warming…
http://www.ssmi.com/msu/msu_data_description.html#msu_amsu_time_series
I am thinking this will come soon
Stop breathing and farting.
Richard Verney – from a jobs point of view renewables create many more jobs per unit of energy than fossil fuel. This is merely the flip side of the off-repeated “renewables are too expensive”
Whether they help, harm or have no effect on climate – renewable energy programs create more jobs per unit of produced energy than ANY energy source.
Ferdinand:
The real response of the carbon cycle to temperature over the past 800,000 years is about 8 ppmv/°C
That might be true long term, but you are looking at data that is very highly smoothed (just by the nature of how it was taken). The rate I get short term is as high as 8.3 ppmv/°C/year (!) . This was done by looking at CO2 only during the el nino of 1998. dCO2/dt rate responds extremely fast to temperature, but temperature peaks and valleys don’t last long, so you don’t see much in an integrated total. The response to equilibrium may be as you describe, but without a doubt, the change in flow rate from a small temperature change is truly staggering. At least it was to me… The atmosphere responded instantly. Another corollary from that analysis is that temperature changes alone could, in fact, account for all of the changes in total CO2 concentration, if the temperature record were to be trusted. I’m not saying it DID, just that the rates indicate it COULD. Easily. With a lot of headroom.
The rate of transfer that is calculated by seasonal effects (that results in a back of the envelope time constant of 7 years), is the MINIMUM velocity that shows up in total. i.e, the fact that we can calculate such a rate indicates that the net of inflows and outflows cannot change at less than this rate. However, this, in itself, is no reason to assume that the rates in each direction are not MUCH higher. We only know the length of the difference in the size of the vectors. Based on the reaction to temperature, I suspect the two vector lengths we are subtracting are much larger than the difference would indicate. The flows in and out are enormous. The sensitivity of CO2 to temperature is enormous. Sensitivity the other way around remains to be seen, but is clearly much lower than the Cause would have you believe.
Actually Thoughtful:
Whether they help, harm or have no effect on climate – renewable energy programs create more jobs per unit of produced energy than ANY energy source.
Good observation. And precisely why it should be avoided. Breaking windows also creates jobs, and so does building a superhighway using concrete delivered in hand-carried teaspoons. But these jobs destroy wealth because they produce a product in a way that is less productive than the next best alternative. (less productive than any alternative, really). Everyone will have jobs until no one has any wealth left and the system collapses. And the cost of the product skyrockets. It’s a form of welfare created for the purpose of taking money from poor people and giving it to rich people, but it sure sounds like a good idea – to the rich people. Sounds like a recipe for a presidential campaign, about 4 years ago – a recipe for disaster.
“There is nothing more worthless than doing well, that which should not be done at all”
While there is evidence the PDO and ENSO are connected there is insufficient evidence to say that the PDO index is an after effect of ENSO.
Basil Copeland eloquently displays this in detail in a guest post here in 2009.
http://wattsupwiththat.com/2009/05/12/pdo-enso-aleutian-low-or-some-of-each/
Basil does some fine analysis and backs up his observation with a paper from Miller (2004)
http://horizon.ucsd.edu/miller/download/jgofs/JO_60-1-11.pdf
The general outcome is, the PDO index has other areas of influence outside of ENSO and is responsible for climate shift regimes. I am in full agreement with Basils statements and direction.
An excerpt from this discussion from Tisdale:
Note how that “residual” opposes the PDO. This means, when the PDO is positive, the North Pacific SST anomalies are less than the global temperature anomalies, which, in turn, means that the North Pacific is subtracting from the global dataset, or cooling, not heating. And if the PDO is negative, the SST anomalies for that region are above global temperature anomalies, so the North Pacific is adding to the global temperature anomaly during those periods.
Why then do global temperatures tend to rise when the PDO is positive, if it’s not caused by the SST anomalies of the North Pacific? The SST anomalies of the Tropical Pacific are in synch with the PDO. Refer to Figure 9 in that post.
http://i41.tinypic.com/n14010.jpg
And what dictates SST anomalies in the Tropical Pacific? ENSO, not the PDO.
Recall that in the other paper I linked (the paper that first calculated the PDO), Zhang et al noted that the PDO lagged ENSO by a season (3 to 4 months). It’s tough for the PDO to control ENSO if ENSO preceeds it.
There are several problems with the response, Tisdale is incorrectly associating northern Pacific SST’s with global temperatures, more or less saying the SST’s in this area are in reverse to the temperature trends…so the PDO cannot have an influence on climate. But we know that for the PDO to be in its cool phase the north Pacific (in particular the north west Pacific) is generally experiencing warm SST’s. This shift to a warm north west Pacific is crucial to the cooling of the globe as we experience deeper and more frequent La Nina events. The cool PDO also includes a wind factor brought about by the inclusion of SLP. What Tisdale is missing is that the warm north western Pacific and the prevailing winds that come with a cool PDO can further induce La Nina action. The PDO is capable of driving ENSO.
This was observed in the back to back La Nina last year where we also saw the PDO index lead the ENSO index (which is not that unusual).
While science agrees that the north Pacific SST’s have a reasonable component of NON ENSO variability there is no way we can say the PDO is an after effect of ENSO.
Michael D Smith – your logic is mostly valid (FDRs CCC being one counter-example) – however, you have the wrong energy source. It is fossil fuels, coal in particular, that create negative wealth by robbing the ecosystem of its ability to give humans our cushy existence on this planet.
As a species, we know this. Some ignorant or bad actors are trying to paint white as black and black as white – the result being renewable energy is criticized.
All you have to do is price in the damage CO2 and its equivalents do to the cost of energy and renewables become the least costly immediately.
The fact that one creates jobs in the process is gravy.
Or turn it around – renewables create jobs (and save money) – the fact that it makes the earth a high-quality provider for future generations is gravy.
Either way, renewables are objectively a good thing.
Actually Thoughtful,
Wow. Econ is certainly not your area of expertise! I suggest a few weeks reading Bastiat.
Smokey – thanks for the laugh. Think about what I have posted. You will figure it out.
Joe Bastardi says:January 19, 2012 at 9:28 am………………
While people get side tracked by CO2 mixing, I think your main point is going unchallenged. PDO.
Some quick background on CO2 mixing here :
A graphic from NASA AIRS satellite showing in fact a 17 PPM variability in mid-tropospheric CO2.
http://wattsupwiththat.files.wordpress.com/2009/03/nasa_airs_co2_july03.jpg
http://wattsupwiththat.com/2009/03/24/study-hemispheric-co2-timing-suggests-that-annual-increases-may-be-coming-from-a-global-or-equatorial-source/
More reading here:
http://wattsupwiththat.com/2008/07/29/co2-well-mixed-or-mixed-signals/
http://wattsupwiththat.com/2008/07/31/a-encouraging-response-on-satellite-co2-measurement-from-the-airs-team/
http://wattsupwiththat.com/2008/07/29/putting-on-airs/
I am amazed at the endless argument over CO2 while purposefully ignoring the 800 pound GHG Gorilla in the room, Water Vapor. The King Kong of Climate Modulating.
A quote from NASA:
“The small fraction of the approximately 5% of water molecules above 500hpa altitude produce about 50% of the greenhouse effect of the atmosphere. Water vapor is the most effective greenhouse gas in our atmosphere and it’s effect increases with altitudes where the air is significantly colder than the ground.”
The crazy part , the ironic part, the counter intuitive part is that this GHG, Water Vapor, cools the planet.
Kudos to Anthony and Company for maintaining such a great reference archive.
P.S. Mods, could you show the image from AIRS as a graphic in this post?
Ammonite says:
January 19, 2012 at 3:52 pm
OK I read the Knutti and Hegerl (K & H) paper. I am unmoved.
The paper was published in 2008 and here in 2012 RSS reads -.01. K & H is littered with unsupported assumptions ex: “The Earth’s climate is changing rapidly as a result of anthropogenic carbon emissions, and damaging impacts are expected to increase with warming.”
First sentence.
An obvious first unstated assumption is that there is a natural normal earth temperature. What is that? How was it arrived at? How is it given truth that Mankind is somehow in control of fouling the natural earth temperature? How do we know it’s Mankind’s addition of CO2 that heats the earth past its normal unperturbed temperature? What if it is entirely unknown why climate cools and warms?
That CO2 has some role in climate is an entirely reasonable conjecture. But nothing more than a reasonable conjecture. This linked paper takes it as given truth that there is a natural temperature of the earth, and mankind is fouling it with his CO2 pollution.
Next comes the unsupported assumption that said heating, admittedly quite weak heating at that, is all bad. Says who? How is mild weather a catastrophe or even a problem at all? Night-time temperatures a bit warmer is a problem?
Anyhow, the paper is dated rubbish. Try this: http://www.appinsys.com/GlobalWarming/SixtyYearCycle.htm
I believe the point of this post is to pose the question: Where’s the heat? What are the 2012 measurements and what is the state of empirical evidence for planetary warming? Look at the data for January 2012 with clear, open minded clarity: -.01. Where’s the heat? No heat. Where’s the problem? No problem.
Mr. Bastardi, “Currently, with gas so high because we are being handcuffed by an administration that won’t drill…”
Oil production has increased in the USA since the Obama administration took office. More oil is being drilled. Or were you being literal and believe it is up to Presidential administrations to do the actual drilling?
Actually Thoughtful
All you have to do is price in the damage CO2 and its equivalents do to the cost of energy and renewables become the least costly immediately.
CO2 causes damage? At the levels we’re talking about, when the CO2 level now is close to plant starvation level compared to when plants evolved? I guess I missed that memo. Do you have evidence of this? Did you ask a plant? What sort of damage are we talking about?
It would have to do a truly amazing amount of damage to offset the cost of renewables, yet I can’t think of a single example of damage. Do you have ONE?
Torgeir Hansson, you say “the Obama Administration has accelerated the permitting process for drilling”. Maybe you mean as compared to their previously glacial pace for approving drilling:
http://lonelyconservative.com/2011/02/obama-admin-issues-one-drilling-permit-wont-issue-more-without-increased-funding/ This administration has been openly hostile to any energy production that is not done by their phony “green” cronies, such as now bankrupt Solyndra. The gulf drilling moratorium alone cost tens of thousands of jobs:
http://heritageaction.com/2011/07/obama%E2%80%99s-drilling-ban-by-the-numbers/
Obama’s recently decision against the XL Pipeline project will cost us many thousands of private sector jobs and undermine attempts to secure “friendly” oil supplies. The fabulous success of recent new drilling technology, such as fracking, has been achieved despite Obama’s administration, not because of it. These new techniques have helped lower our natural gas prices to 10 year lows, so the left-wing environmental community predictably wants to ban them.
Actually Thoughtful says:
January 19, 2012 at 8:14 pm
With a statement like that, you should seriously consider a different name–“Actually Thoughtful” is nowhere near accurate.
(Last time I looked, all of the foods I eat are carbon-based, which is part of the “cushy existence” I enjoy on this planet–all enhanced in their growth by the burning of coal and other carbon-based fuels. The electricity I use comes predominantly from a carbon energy source, and the automobile I drive uses a carbon-based fuel. Even if you drive one of those fire-upon-impact-prone Chevy Volts, I hate to break it to ya–that car is coal-powered because your “fuel” comes from plugging it into the coal/gas-fired electrical grid. Only if you own your own windmill and recharge it with that will I cut you some slack, although it was manufactured largely with carbon-based fuels.)
May I ask for the source reference for your statements so we all may see who sponsors such drivel? Oh, and a list of where you went to college is also requested, and whether you graduated at all.
Thanks.
Richard G – I invite you to look upthread to my challenge to Bastardi or any other so-called skeptic to commit to a time when the magic PDO will reverse all warming since 1980.
Been crickets since I issued the challenge.
Regarding CO2 and the atmosphere, the only place I know that has a sufficient environment for collection of said gas is in underground mine workings and some natural caves with little or no air movement. There, “dead air” has a particularly serious side effect–it will render you asphyxiated in short order and you’ll be just like the air–dead.
I belive there’s too much movement in the atmosphere for CO2 to collect or segregate in any meaningful way just based on its delta g.
Alan D McIntire says:
After reading McKitric’s postings, I figure that the earth will show a global “cooling” with our current economic downtrend. A lot of what we’re measuring is not global average temperatures, but waste heat from industrial activity.
Then why is the stratosphere cooling? (Ozone loss does not explain all of it — the lower stratosphere continues to cool; the rate for UAH LS in the last 10 years is -0.19 C/decade.)
Obama is not drilling for oil? US oil production is up 2.7% from one year ago. The US was a net exporter of petroleum products in 2011, for the first time in 62 years:
http://www.foxnews.com/us/2011/12/05/us-on-pace-to-become-net-fuel-exporter/
“Actually Thoughtful says:
January 19, 2012 at 11:12 am
no Hadcrut3 here – those guys manipulate data!). Nope It is GISS for us.”
Even GISS shows absolutely no positive slope for the last 10 years and 4 months. See
http://www.woodfortrees.org/plot/gistemp/from:1980/plot/gistemp/from:2001.67/trend
#Selected data from 2001.67
#Least squares trend line; slope = -3.86942e-06 per year
Now I realize this is not 30 years, but at the same time, it is too long to just ignore and to spend huge amounts of money to ameliorate.
I have a question. Why are we even arguing about the levels of CO2? Isn’t increased CO2 supposed to be good for the planet? Don’t we like our planet warm instead of cold? Don’t plants like more CO2? Wasn’t this planet just shrouded in plant life the last time CO2 was extremely high? And weren’t there animals alive then too? Is it not true that humans can survive an even MUCH higher level of CO2 than was present ages ago?
I tell you what, coming from a place that lives in winter half the year, I would love to have a longer growing season, heartier plants, increased production from my fruit\vegetable-producing plants, and a much easier livelihood.
Tell the people of Alaska and Washington right now that warm weather is a bad thing.
steven mosher says:January 19, 2012 at 7:24 am ………
Steve, nice film. Proof positive that CO2 is opaque to IR @ 100% concentration. Yes CO2 blocks IR.
A small criticism of the film: Nice parlor trick with no practical relevance to AGW debate.
The film shows absorption @ 0.038%(380ppm) concentration (ambient air) to be nil, and @ 100% concentration to be near total. He ran quite a bit into the chamber before any effect was visible. Please show absorption @ 0.070% (doubling of ambient). I would wager that no effect will be seen.
Convince me, please.
The argument is not whether CO2 absorbs IR, it is how much. The argument is not IF there is warming or cooling (the record is clearly variable), it is whether warming is good or bad, whether cooling is good or bad. Warming is a boon to the biosphere. Cold kills people. Increased CO2 is provably beneficial to the plant kingdom, and thus to the animal kingdom.
The notion of a global “average” temperature as something we can calculate, or has any real meaning across the varied globe is silly. My Goode’s World Atlas from 1970 (when an Ice Age was the rage) has a page: Climates of the Earth. Please notice the plural usage Climates. It maps 14 types of Climates (by Glenn T. Trewartha, *simplified* from Koppen) with 21 regions and subtypes. A global average is laughably simplistic.
I fervently hope you are right and it is warming. Warming is good
As to more CO2?…MORE SUGAR!!!
GregO says: January 19, 2012 at 8:59 pm
OK I read the Knutti and Hegerl (K & H) paper. I am unmoved. The paper was published in 2008 and here in 2012 RSS reads -.01… I believe the point of this post is to pose the question: Where’s the heat? What are the 2012 measurements and what is the state of empirical evidence for planetary warming? Look at the data for January 2012 with clear, open minded clarity: -.01. Where’s the heat? No heat. Where’s the problem? No problem.
Hi GregO. As mentioned in my original response, many people confuse short term fluctuation with long term trends. Knutti and Hegerl is a paper about equilibrium climate sensitivity. It is concerned with long term climate response, not what happens across the next decade and certainly not what happens this month. Note that there are scores of studies using multiple independent approaches to estimate the rise in temperature associated with a doubling of atmospheric CO2. All are positive and the median of each separate technique sits close to +3C.
For shorter term response I suggest you study the Foster and Rahmstorf link. The consistency of the underlying trend belies your “no heat” assessment. You link above to a cyclic fit of temperature. You have an empirical basis to measure against as time goes forward. We will all see how good a predictor this technique proves. Best of luck.
Werner Brozek – why is 10 years too long to ignore? Why have you cherry picked your dates so carefully?
Climate is defined as 30 years. We often see trends in less than 30 years. SkS has some great graphs the show how you see the world (your carefully picked time periods (down to the month!) and the actual over-riding trend (ie up and to the right – relentlessly, just as man-made CO2 emissions have increased). (and opposite or low/no correlation to obvious things like solar output, volcanoes, etc)
Will you slavishly follow your tiny time periods during the next El Nino? Or when the sun cycles into higher activity? Or when both happen at once?
Despite the desperately hopeful PDO piece posted to this same site, I assure you the future trend is warmer, not cooler. And I have no doubt you know this to be true.
You appear to be too smart to be taken in by the weather. Yet your post speaks a different message.
Actually Thoughtful says:January 19, 2012 at 9:24 pm ………………
A.T.
I don’t presume to *predict* the weather beyond 2 hours and even then I get it wrong. You have the vision of a cricket who only sees the grass in front of you, little one. Lift your eyes and you can see mountains in the far distance. Look farther than 1980 my friend and you will see 1940 towering in the distance, and try to remember how they recorded temperatures before the advent of thermometers in 1724. (They didn’t.) That is prehistory and the realm of conjecture. The more we learn the more we should know how little we know.
And let us presume for a moment that you are right about all of this. There is not a thing you or I can do to stop it no matter how much you tax or spend. We are on an enormous ball careening through space for crying out loud. There are no brakes and the steering wheel isn’t really connected to anything. It just gives you the illusion that we can steer this thing. So lets all argue over who gets to steer next.
What I find interesting about people such as Ammonite is that they have set the bar so low (a decade of no trend is “meaningless” yet I suspect a month of, say, very low sea ice, is extremely significant), that if we hypothetically ended up with .5C-1C of mild and probably beneficial warming towards the end of this century, I suspect he would still regard this result as “vindication” of climate models.
Citing Foster and Rahmstorf (2011) is curious. If what happened didn’t happen, there would still be warming. Ah, OK…. The actual point of the paper is that natural variability is so great it masks the tiny CO2 influence. Not perhaps what Foster and Rahmstorf set out to prove, but the only reasonable conclusion to draw.
Michael D Smith says:
January 19, 2012 at 7:34 pm
The rate I get short term is as high as 8.3 ppmv/°C/year (!) . This was done by looking at CO2 only during the el nino of 1998. dCO2/dt rate responds extremely fast to temperature, but temperature peaks and valleys don’t last long, so you don’t see much in an integrated total.
One objection: the response to short term temperature fluctuations is about 4 ppmv/°C, but not per year! That is based on the fast response of oceans and vegetation to temperature changes like the 1992 Pinatubo eruption and the 1998 El Niño. Any sustained temperature change will give an initial fast response, but that levels out over time as the CO2 levels reach a new steady state for the new temperature. That is what you see in the ice cores, heavely smoothed (560-600 years) in the Vostok and Dome C long time records, but already with better resolution (40 years) in the Law Dome record for the MWP-LIA transition. Anyway, the 100 ppmv increase can’t be caused by temperature, as the main fast responses are the oceans, which have the wrong 13C/12C ratio or vegetation, which grows better with higher temperatures, thus becomes a larger sink… So, the current 4 ppmv/°C response around the upgoing trend is caused by temperature changes, but the trend itself is not caused by sustained temperature changes.
I checked out the GFS animation of anomalies for the next 16 days at http://policlimate.com/weather/current/ext_raw_temp_c.html
Currently the 12z31JAN run shows a global anomaly of minus 0.599. Yowza! Of course, the computer model does jump around a bit. Twelve hours later, on February 1, the global anomaly is “only” minus 0.405.
Let us do a little “fact check” on the GFS computer on the last day of January. I’ll bet a nickle, (if I still have one,) that the global anomaly is not minus 0.599.
I don’t know much about the inner workings of computers. For example, I did not know they have gaskets and rockers. However obviously they do, for the GFS has blown a gasket and is off its rocker.
What makes me curious is the data going in, that is causing the GFS to go so whacko. Even though I suspect the GFS is wrong on the details, (Major thaw in the east, with terrible cold charging down from Alaska, on January 31,) it may be, in some way, “sniffing something out.”
And that is where I turn to the mind of Mr. Bastardi. On a regular basis he beats the GFS “like a rented mule.” When he perks up, and even starts to say his earlier forecast may need adjusting, (to a colder February,) I shut up and listen.
> You folks that are coming at me about co2 sg, apparently dont understand that simply put, it does not mix well with air. There was just an article about that here on WUWT.
Oh dear, this is funny. Mr Bastardi is proving that even when his own side tell him he is wrong, politely and clearly, he still isn’t capable of seeing sense.
Here is something that might help: http://amsglossary.allenpress.com/glossary/search?id=homosphere1
Or would you prefer some actual measurements?
Michael D Smith says:
January 19, 2012 at 7:34 pm
Reaction on the second part:
The rate of transfer that is calculated by seasonal effects (that results in a back of the envelope time constant of 7 years), is the MINIMUM velocity that shows up in total. i.e, the fact that we can calculate such a rate indicates that the net of inflows and outflows cannot change at less than this rate.
One need to make a differentiation between fast responses and slow responses, especially for vegetation. The main seasonal flows are from warming/cooling mid-latitude oceans and vegetation. The tropic oceans are permanent sources and the polar oceans are permanent sinks, opposite for vegetation on land, both hardly influenced by seasonal changes. The main change in vegetation is the start of the growing season and the deterioration of leaves in fall . That is visible in the regional CO2 records, mainly in the NH.
A sudden increase of temperature increases average uptake of CO2 by mid-latitude vegetation, but also increases the CO2 release by the mid-latitude oceans. As one looks at the global influence of temperature, we see a global seasonal increase of about 5 ppmv for an about 1°C global increase during NH summer (more land). Again not more than 5 ppmv/°C on very short term. While the exchanges are huge, the natural variations in CO2 uptake/release are relatively small (less than 3% of the flows). Probably a result that oceans and vegetation react in opposite direction for temperature changes… But again, once the temperature is fixed at a different level, the CO2 rate of change levels off to zero when the new steady state is reached. In reality, that never happens as there are always year by year changes in temperature, but the longer term average is measurable in ice cores (and recently confirmed for 2 million years in sediments).
The long term changes include deep ocean temperature changes and ice cover / vegetation area changes, which brings the long term influence to about 8 ppmv/°C.
What we miss in the record is the reaction of CO2 levels to mid-term temperature variations from years to decades. But it would be quite strange that this would be different from the very short and very long term ratios…
sydney australia having a cold summer have not turned on the air con this summer
Geoff Sharp @ January 19, 2012 at 8:14 pm
I’m sorry to have to tell you this, Geoff, but I think you made a mistake by thinking Basil Copeland’s post disagrees with me. Over in the comment section of the Foster Part 2 post, I have been saying the PDO is the function of ENSO and North Pacific sea level pressure. Basil refers to the NPI and I believe you’ll discover the NPI is a sea level pressure index for the North Pacific. So that part of the Copeland post does not disagree with me.
Basil Copeland quoted Miller et al. a few times and said it disagreed with Newman et al., but I can’t find where it disagrees. Here’s the entire section of the Miller paper from which that Basil quoted [The CAPS are mine, as are the bracketed comments]:
“2.2 Mechanisms of decadal variability
“The mechanisms by which the Aleutian Low might
vary on decadal timescales are uncertain, but stochastic
excitation by midlatitude weather disturbances certainly
exerts a strong influence. The stochastic forcing climate
models of Hasselmann (1976) and Barsugli and Battisti
(1998), for SST, and Frankignoul et al. (1997), for ocean
currents, constitute zero-order models of midlatitude
decadal variability. However, deviations (i.e., spectral
peaks, or enhancements of variance) from the simple spectra
predicted by those theories are significant, and many
ideas have been advanced to explain them. Some of these
involve spectral peaks arising with only stochastic atmospheric
forcing (Jin, 1997; Saravanan and McWilliams,
1998; Neelin and Weng, 1999; Qiu, 2003), while others
rely on feedback loops or remote forcing.”
[That does not disagree with Newman et al. or with what I’ve been saying.]
“Deterministic forcing from the tropics clearly has an
effect in establishing decadal SST variability in the
midlatitudes. The forcing of the canonical SST pattern
(around the subtropical front) has long been linked to atmospheric
teleconnections from the tropics associated
with El Niño/Southern Oscillation (ENSO) events on
interannual timescales (Alexander et al., 2002). The forcing
of the KOE SST pattern (around the subarctic front)
is only weakly linked to tropical teleconnections, because
the nodal line of the ENSO-forced pattern runs through
the KOE region (e.g., Hanawa et al., 1988). The independent
behavior of the KOE SST has been clarified
through its enhanced decadal variance relative to the canonical
SST pattern (Deser and Blackmon, 1995;
Nakamura et al., 1997) and through its links to decadal
wind-stress curl forcing (Deser et al., 1996, 1999; Miller
et al., 1998).”
[Miller et al. just said the mid latitudes are forced from ENSO in the tropics. This agrees with what I’ve been telling you.]
“Recent studies with a simple first-order
Markov model with forcing specified by the tropical SST
index, damping rate specified by SST persistence (with
re-emergence) and white noise forcing (simulating
midlatitude weather) reveals that the BULK of the PDO
index is explicable by atmospheric forcing from tropical
teleconnections (Newman et al., 2003).
[Miller et al just said that most of the variations in the North Pacific are explained by forcing from ENSO. Isn’t that what I’ve been telling you?]
The forcing with
tropical origins (Graham et al., 1994; Giese and Carton,
1999; Schwing et al., 2002b; Yasunaka and Hanawa, 2003;
Deser et al., 2003b) clearly drives the canonical SST pattern
portion of the PDO.
[And Miller et al. just said 4 other papers agree that the pattern originates in the tropics with ENSO, Geoff.]
However, THE SIMPLE MODEL RESULT
IS SOMEWHAT DEFICIENT IN DECADAL TIMESCALE ENERGY.
This suggests that the KOE SST pattern portion of the
PDO is not simply driven by (OR AT LEAST IS NOT IN PHASE WITH)
this tropical forcing.”
[All Miller et al. just said Newman et al. is not complete, but Newman et al. had said that in their paper.]
“Adding a lagged KOE response
pattern, mimicking the gyre-scale spin-up delay, may
improve the fit of the Newman et al. (2003) simple model.
Alternatively, midlatitude ocean-atmosphere, or oceanatmosphere-
ecosystem, feedbacks may be important.”
Miller et al. doesn’t disagree with Newman et al, Geoff. They are saying that Newman needs to include a time-delay response where the KOE region lags ENSO because of gyre spin-up (and the KOE region is in the Northwest Pacific and that’s the area you’ve been talking about on this thread and over in the Foster comment section). That would only make the KOE a little out of phase with ENSO and with the Northeast Pacific. And didn’t I mention something about gyre spin up to you over in the Foster comment section? Look, spin-up is even mentioned by Miller et al.
It sure does look to me like the Miller et al. paper agrees with everything I’ve been saying to you all along.
Maybe you should try to understand the topics you’re discussing before you comment.
Good bye, Geoff
Erinome says:
January 19, 2012 at 9:37 pm
Then why is the stratosphere cooling? (Ozone loss does not explain all of it — the lower stratosphere continues to cool; the rate for UAH LS in the last 10 years is -0.19 C/decade.)
Any GHG increase in the troposphere will increase the temperature of the surface by blocking more outgoing IR. And therefore give a stratospheric cooling. But that doesn’t mean the current cooling of the stratosphere is due to CO2 (the cooling is more stepwise than in ratio with CO2 increase). Water vapour will do the same job even more easely. There are few measurements which can make the distinction between the two causes.
As the average earth temperature increased over the past century, more water vapour is hold up in the troposphere, thus more cooling of the stratosphere… If the increased temperature is due to CO2 is a matter of debate, as at least halve of the temperature increase in the previous century is natural: 100% of the first halve century plus part of the second halve… The temperature increase also is stepwise and not in ratio with the CO2 increase.
Will Nitschke says: January 20, 2012 at 12:04 am
“What I find interesting about people such as Ammonite is that they have set the bar so low (a decade of no trend is “meaningless” yet I suspect a month of, say, very low sea ice, is extremely significant), that if we hypothetically ended up with .5C-1C of mild and probably beneficial warming towards the end of this century, I suspect he would still regard this result as “vindication” of climate models.
Citing Foster and Rahmstorf (2011) is curious. If what happened didn’t happen, there would still be warming. Ah, OK…. The actual point of the paper is that natural variability is so great it masks the tiny CO2 influence. Not perhaps what Foster and Rahmstorf set out to prove, but the only reasonable conclusion to draw.”
Hi Will. Lets agree not to put words in each others mouths. The underlying trend from Foster and Rahmstorf is ~ +0.16C/decade for satellite and terrestrial based systems. If that were all due to CO2 would you consider it “tiny”? If such a trend persisted an El Nino excursion of +0.3C would be eaten up in under 20 years to become the new norm under neutral conditions. +0.5C is only 31 years away at this rate.
The actual point of the paper is to indicate that known causes of variability are sitting on top of a rising trend. Further, F&Rs method of trend identification reduces volatility (residuals) to the point that statistical significance is achievable at ~ 5 years. So lets raise that bar. I predict that in ten years time the F&R series will read +0.16C (near enough) from its current value. Where do you stand?
Richard G says:
January 19, 2012 at 10:54 pm
The film shows absorption @ 0.038%(380ppm) concentration (ambient air) to be nil, and @ 100% concentration to be near total. He ran quite a bit into the chamber before any effect was visible. Please show absorption @ 0.070% (doubling of ambient). I would wager that no effect will be seen.
Convince me, please.
The effect of 0.038% ppmv CO2 is hardly measurable on a small distance (although CO2 levels are measured by absorption at certain wavelengths), but is measurable over 100 m height in the atmosphere. The relative effect increases with height, as water vapour rapidely drops with height. But even at full water vapour saturation, there is an effect of CO2, as that mainly absorbs at wavelengths where water is less active for outgoing IR radiation over the full air column. See:
http://barrettbellamyclimate.com/page11.htm
The change in effect also is measured by satellites (with as caveat that different equipment was used) over the period 1970-1993:
http://www.sp.ph.ic.ac.uk/news/newsmar01.html
There is a more recent version, but forgot to save it…
steven mosher says:
January 19, 2012 at 7:24 am
From what Joe says about trace gas and from what he says about specific gravity it looks like Joe utterly misunderstands the mechanism of global warming. He thinks C02 traps heat. It doesnt. that is not the theory.
Mosher then links to a video clip in which the statement “effectively traps the heat” is made.
Brilliant.
jorgekafkazar says:
My 1964 University Physics by Sears and Zemansky (p. 281) reads:
In cross-checking the definition in my Mark’s Standard Handbook for Mechanical Engineers, I see that you are correct and all these years I’ve been misinformed.Thanks for correcting me.
Ferdinand:
Thanks for the detailed explanation, you have quite an understanding of CO2 flows.
You also explain:
The effect of 0.038% ppmv CO2 is hardly measurable on a small distance (although CO2 levels are measured by absorption at certain wavelengths), but is measurable over 100 m height in the atmosphere. The relative effect increases with height, as water vapour rapidely drops with height. But even at full water vapour saturation, there is an effect of CO2, as that mainly absorbs at wavelengths where water is less active for outgoing IR radiation over the full air column.
We know water vapor is by far the better GHG, when available, AND it has the ability to also transfer enormous amounts of heat due to phase change, (which transports the heat to high altitude where there is a better radiation window) so doesn’t the effect of CO2 simply change the height at which, all else being the same, H20 phase changes occur? I realize there is a wavelength difference, but isn’t the effect of CO2 in a H20-rich environment largely overridden? More CO2 makes clouds higher? I think this would make the effect of CO2 for the majority of the planet where clouds form basically zero.
#1 – Performing simple mathematics is not claiming omniscience in economics. Learn to add, subtract, multiply and divide for yourself.
#2 – The US spends nowhere NEAR 1.5 trillion on the security apparatus. About half that is closer to the truth.
Stop being lazy and do your own research.
Erinome says:
January 19, 2012 at 9:37 pm
“Then why is the stratosphere cooling?”
I don’t disagree with you. The point I was trying to make was that part of the previously measured warming was increase in the heat island effect due to increases in economic output.
Additional industrial output could partially mask any natural cooling, but we ain’t gong to get that with the current administration’s policies.
<i?Erinome says:
January 19, 2012 at 9:37 pm
[Alan D McIntire says:
After reading McKitric’s postings, I figure that the earth will show a global “cooling” with our current economic downtrend. A lot of what we’re measuring is not global average temperatures, but waste heat from industrial activity.]
Then why is the stratosphere cooling?
At least part of it could be increased CO2. It radiates some of the kinetic energy of the stratosphere to space.
Oil production has gone up but it’s not due to the Obama administration.
http://blog.heritage.org/2012/01/18/under-obama-oil-and-gas-production-on-federal-lands-is-down-40/
An inversion layer causes smogs by preventing smoke from rising. Does it do the same thing to CO2? You can see smoke from a chimney falling downward as it leaves a chimney whereas normally it would be rising!
Ammonite,
Thanks for the response. I downloaded and plotted RSS last night and had my spreadsheet calculate a least squares linear regression and indeed it is increasing at something close to .16 C per decade. Correlation coefficient not too good and no surprise there.
Questions I ask myself;
1. Has GATA ever risen in relation to an arbitrarily chosen base number like this in the past prior to Man-made CO2? My answer: Probably. Ref Minoan/Roman/Medieval warm periods which we are at least a bit uncertain about so that’s why my answer is probably, but add the paleo records to the historic records and to me I accept it as a reasonable assertion that since recorded history climate has changed with temperature going up and down – why it does I haven’t the faintest idea – but I accept that temperatures and climates can and do change and further I would posit that those changes are likely to show up in local climates in more extreme versions. Maybe that’s what happened to some ancient cultures like the Indus Valley people, Mayans, Bronze Age dark ages, I don’t know, but climate change having a bad to catastrophic effect, particularly on a localized geographic area, and specifically if the population and their organizing governments cannot adapt to the new conditions is entirely plausible.
2. What is the correct temperature of the earth? For the sake of discussion, there are various starting points I have seen chosen in order to establish delta T with respect to some baseline. I believe the discussion here in this thread references the beginning of the satellite record for example. OK. I have also seen the beginning of the industrial era. OK. One could start anywhere. But is that starting point anything other than a convenient, arbitrary point for the sake of constructing a delta T versus time plot, or is there some branch of earth science (or any science) that by some means specific to their technical training, it is known by them that the earth should be some specific temperature? I mean this as a serious question and not rhetorical. I will ask the question another way – is there a temperature the earth should be right now, other than what it happens to be? An answer could be something like “the temperature of the earth should be 0.5431 degrees C cooler than it is now because (list rationale for earth not being at the right temperature – Man-Made blah-blah-blah, termites and methane, whatever…) and if only it was 0.5431 degrees cooler it would be great because (list things that would be better – more wild animals, better corals, bigger and better glaciers, more Arctic ice – tell me how the world would be better were it not for the heating above “normal”).
3. What about the correct level of CO2? Is there a correct level of CO2? It is claimed earth should never have more than 350 ppm CO2 because more than 350 ppm will result in heating (now in front of the word “heating” insert “Man-Made”, “Catastrophic”, “Meaningless”, “A steady DC offset from the natural”, blah, blah, La, La, – I think you get the point). CO2 concentration is now at something like 390+ ppm. This is a data point. RSS is at -.01 from its baseline. This is a data point. How does this lead to “blah-blah” in front of the word heating? This month the heating is a negative number.
Thank you for your best wishes and good luck to you as well.
Joe Bastardi wrote:
You cant just blow that off, especially when you can see what temps have done in relation to the PDO in the past, and the fact that they have leveled off the last 15 years even as co2 has marched up.
Joe, please look at the data! It is NOT true that temperatures have “leveled off the last 15 years”. Here are the trends for that interval:
UAH LT: +0.097 C/decade
UAH MT: +0.007 C/decade
UAH LS: -0.067 C/decade
Erinome says:
“Obama is not drilling for oil? US oil production is up 2.7% from one year ago.”
That is despite the Obama Administration’s obstructionism.
Obama can take no credit whatever for any new U.S. oil production, since he adamantly refuses to allow any new drilling, or even any exploration, in the red areas.
Next time you compare your new utility bill with the ones you got when the last adult, President G.W. Bush, was in charge, you can thank Obama for jacking up your rates.
Bob Tisdale,
I always appreciate your keen powers of observation.
Here are some things I’ve observed.
The cold PDO seems to lead to more ice forming up in the Bering Straights. This effects air coming across from Siberia via “cross polar flow,” allowing it to stay colder.
The cold PDO has colder water just off California, and warmer water out towards Hawaii, which often encourages high pressure off the west coast. When this high locks in, it loops air up towards Alaska, but also encourages the “cross polar flow” to charge straight down on the east side of the Rockies, and in severe cases (such as the winter of 1976-77,) the entire east stays in the icebox for several months.
In conclusion, because the “cold” PDO has such different weather patterns from the “warm” PDO, it may not matter all that much if the “warm” one turns out to be slightly colder than the “cold” one, in terms of averaging out the entire Pacific. What matters is the system of delivery. Perhaps the “cold” PDO is called “cold” because we in North America are more likely to have our butts frozen off.
Lastly, during the last warm El Nino the signature of a “cold” PDO, ( a backwards letter “C” in the Pacific, with the cold curving from south of Hawaii to the west coast and then back out to sea up by Alaska,) never completely faded away, though it did weaken. It was never replaced by a warm letter “C” in the anamoly maps. Wouldn’t that suggest it has a life of its own, and is not merely a responce to ENSO?
Caleb says: “Wouldn’t that suggest it [the PDO] has a life of its own, and is not merely a responce to ENSO?”
There is another well-known factor that influences the spatial pattern of the North Pacific. And of course, the dominant (most often occurring) spatial pattern is known as the PDO pattern. And in addition to ENSO, the other factor that causes the variations in that pattern is Sea Level Pressure. Also Central Pacific ENSO events (El Nino Modoki) have slightly different spatial patterns that East Pacific ENSO events, which adds to the flavors.
In looking at the rest of your comment, let me throw this past you. When trying to determine the impacts of the North Pacific Sea Surface Temperatures on Northern Hemisphere surface temperatures, it seems logical to me to use the Sea Surface Temperature itself, and not the dominant spatial pattern of the North Pacific Sea Surface Temperature (the PDO), which as you noted, is not present all of the time.
Smokey says:
Obama can take no credit whatever for any new U.S. oil production, since he adamantly refuses to allow any new drilling, or even any exploration, in the red areas.
Without knowing the provenance of this chart, I am suspicious of its veracity. In any case, why should the US be drilling in some of the most populous areas of the country, the seaboards? Moreover, federal land is for everyone to use and enjoy, not just energy companies.
Next time you compare your new utility bill with the ones you got when the last adult, President G.W. Bush, was in charge, you can thank Obama for jacking up your rates.
Actually my electricity rate is the lowest it’s been in years: 6.9 cents/kWh, due to a strong emphasis on renewable power in my region. Four years ago it was 11.1 cents/kWh, and 8 years ago, in another region, it was 16.2 cents/kWh.
I’m very happy with my rate, and would purchase green power if my provider offered it. (My previous provider did; it added $3/month.) What I’m unhappy about, though, is the ~ 3 cents/kWh power generation via fossil fuels adds to everyone’s health costs. You would apparently like that to be higher.
Bob Tisdale,
Thanks for the food for thought.
I haven’t properly digested the meal you served me yet, but my intital responce is to prefer the anomaly map to the temperature map, because the anomaly shows you where the system is getting “tweaked,” as it were. If you were running a climate in a test tube, and you added a little heat here and subtracted a little there, how would the circulation patterns change? If you just look at the temperature maps, all you see is that it is hot down south and cold up north. You don’t really see the “tweaking” going on.
It’s pretty obvious the ENSO cycle influences the trade winds. I think what fellows like Bastardi have gleaned, through their observations over the years, is that patterns to the north change as well.
Maybe they haven’t got the nuts and bolts of the changes down, but they have been studying maps longer than you and I put together, and they have “bags of tricks.” In Bastardi’s case, it is the second generation of studying maps.
What is important is to observe. Observe, observe, observe!
“Actually Thoughtful says:
January 19, 2012 at 11:19 pm
Werner Brozek – why is 10 years too long to ignore? Why have you cherry picked your dates so carefully?
Climate is defined as 30 years.”
I believe that both 10 years and 30 years are not correct. The real value should be 60 years since there seems to be a 60 year cycle as the following shows:
http://wattsupwiththat.files.wordpress.com/2009/03/akasofu_ipcc.jpg
Let me apply an analogy. Let us suppose that the day is warmest at 12 noon just for discussion sake. What the 30 year period does is take the trend from 2 A.M to 2 P.M. and says we are warming rapidly. What really should be considered is what happened from 2 A.M one day to 2 A.M the next day. So the 10 years of flatness in this analogy is from 10 A.M to 2 P.M. The way I see it is that in the big picture, the last 10 years of flatness merely confirms the 60 year cycle is still working and that we are now headed into a cooling mode. Under this scenario, we do not have to wait another 10 years to see 30 years of no temperature change, but we only need to wait 10 years. Using the clock analogy, when an hour passes to 3 P.M., you have to back to 9 A.M to get a straight line again. This is more or less what happened to RSS and HadCrut3 over the last month of cooling.
Then there is the other matter of us coming out of the LIA so there is a slight upward slope. How much of this slope is due to CO2 is a matter of debate, but I am convinced it is not enough to be the least bit concerned about.
Erinome says:
“Without knowing the provenance of this chart, I am suspicious of its veracity.”
Simple solution, then: provide us with evidence that the Obama Administration has reformed its regulations, and now encourages offshore drilling. Next, Erinome wonders:
“…why should the US be drilling in some of the most populous areas of the country, the seaboards?”
I haven’t noticed any “populous areas” a mile under water and five miles offshore. As to why we should be drilling there, it’s pretty obvious: that’s where the oil is. [Please don’t waste everyone’s time with scare stories about oil spills. BP’s Deepwater Horizon was a relatively rare event, and even though it gushed oil for months, today there is almost no sign of damage. The planet has been dealing with oil seeps for millions of years; some bacteria eat it up. Also, China and Cuba are drilling only 30 miles off the U.S. coast, and they have abysmal environmental records. But of course Erinome is silent about that]. Next, Erinome says:
“Moreover, federal land is for everyone to use and enjoy, not just energy companies.”
Since that federal land is on the seabed, I’m sure Erinome could go to the sea floor and enjoy it to his heart’s content, along with Spongebob. It’s not like the energy companies would mind. Finally, Erinome says:
“What I’m unhappy about, though, is the ~ 3 cents/kWh power generation via fossil fuels adds to everyone’s health costs.”
That is rank, baseless and false speculation. Life expectancy has greatly increased since oil was first discovered [and it literally saved the whales]. People live longer and healthier lives due to fossil fuels. I suspect Erinome drives a car, heats his home, uses plastic, eats food grown with fossil fuel-produced fertilizer, buys food and other products delivered by trucks and trains, and in general lives a much healthier, fuller and more comfortable life as a direct result of his fossil fuel use. But if Erinome actually walks the talk and shuns the use and benefits of fossil fuels, I’m sure he will tell us right away. Because hypocrisy isn’t pretty.
[BTW, this is probably why erinome’s utility bill went down, not because of ultra expensive “green” power.]
GregO says: January 20, 2012 at 7:50 am
I downloaded and plotted RSS last night and had my spreadsheet calculate a least squares linear regression and indeed it is increasing at something close to .16 C per decade. Correlation coefficient not too good and no surprise there.
Thank you GregO. These basic sanity checks go a long way. (Note that this trend represents the transient temperature response to longer term forcings without identifying what those forcings are. It is hard to see how this could be caused purely by an energy redistribution given that ocean heat content has risen across the satellite era.)
Your points regarding the “correct” temperature for the earth require a bit of discussion. There is nothing intrinsically special about 1975… It is not so much that there is a correct temperature as that the relatively stable climate of the holocene has allowed agricultural development (corn/maize for example took 1000s of years of human selection to become what it is today) which in turn has bootstrapped specialization and technology. (Why didn’t we have satellites 15,000 years ago?) +3C threatens to push many agricultural regions outside the norms of the last 10,000 years at a time when global population is expected to top 9 billion. Any system with a reserve can suffer excursions from “normality” for a while. That is not necessarily true for a persistent change and if that change is rapid adaptation may prove a challenge. Check out the evolution of the Palmer Drought Index.
Michael D Smith says:
January 20, 2012 at 4:53 am
We know water vapor is by far the better GHG, when available, AND it has the ability to also transfer enormous amounts of heat due to phase change, (which transports the heat to high altitude where there is a better radiation window) so doesn’t the effect of CO2 simply change the height at which, all else being the same, H20 phase changes occur?
Pure based on (laboratory measured) radiation energy absorption/re-emission, the influence of a CO2 doubling is not more than 0.9°C. That increase makes that more water vapour can hold in the atmosphere, which increases the GHG effect to 1.3°C. That is pure theoretical, but based on laboratory measurements for different single and combined air/GHG mixtures at different air pressures. So far so good.
The problems begin with clouds. The in/out energy balance of different types of clouds ánd changes in total cloud cover are some of the many big problems in climate models: In general, low level clouds have an overall cooling effect while high level clouds have an overall warming effect. But how much is a matter of debate and how higher temperatures affect cloud cover (or reverse!)? Even the sign of cloud cover response to temperature changes is not known for sure.
And you are right, water vapour changes states, not only in altitude but also in latitude: it is one of the main mechanisms that prevents overheating of the tropics and deep freezing of the near polar regions (except during glacial periods).
Thus in my opinion the climate models largely overestimate the positive feedbacks and even may have the sign wrong in the case of clouds. Therefore the effect of 2xCO2 is not zero, but lower than the 1.5°C low border of the IPCC/models range. After all we are very lucky to live on a water planet…
steven mosher says:
January 19, 2012 at 7:24 am
“…..As we add more GHGs we fill up the holes over time and the atmosphere becomes more opaque. This means the effective radiating height of the atmosphere will increase. Energy still escapes back to space, but the earth radiates from a higher and colder altitude. This latter factor is important. With more GHGs the atmosphere is more opaque. Earth then re radiates from a higher colder altitude. The rate at which energy is lost back to space is thereby slowed and the surface is warmer than it would be otherwise. You see GHGs dont warm the planet by getting hot themselves, they slow the cooling of the surface. Slowly, bit by bit, over very long stretches of time….”
The real truth is not in all the esoteric equations and the physics that everyone likes to repeat ad nauseam, it’s in the darned observations! You guys seem to get caught up in all this inside the air conditioned building, computerized modelling and physical law stuff and never look out the window anymore.
The guy in the link below has been keeping records at his house, a couple of miles from my house, from 2004 onwards. Do you see any freaking trend there?
http://www.wunderground.com/weatherstation/WXDailyHistory.asp?ID=KFLSAINT5&graphspan=custom&month=1&day=19&year=2004&monthend=1&dayend=20&yearend=2012
Time to quit the dependence on all these “non-violate” physical laws and all of the other modelling BS and start looking out the window again for a change – jeez! It could be refreshing :).
Best,
J.
Bob Tisdale says:
January 20, 2012 at 3:13 am
It sure does look to me like the Miller et al. paper agrees with everything I’ve been saying to you all along.
Incorrect. Both Miller and Copeland very clearly show the Aleutian Low (NPI) is an important component/driver of the PDO. The PDO index incorporates the NPI, not by accident one would think. Miller shows north Pacific SST’s being affected by the strength of the Aleutian Low, a diagram that perhaps you missed is shown below.
http://tinyurl.com/2dg9u22/images/aleutianlow.png
Copeland shows a stronger correlation between PDO/NPI than what the PDO/ENSO is capable of. By restricting yourself to a ENSO only driver of PDO is demonstrating your lack of understanding once again. By not taking account of all possible factors you display bad science that you are passing on to the public. On a similar note, have you amended your El Nino Rossby wave references to show this phenomenon is NOT a regular occurrence?
“”””” steven mosher says:
January 19, 2012 at 7:24 am
………………………………
Short wave in, longwave out. The various gases in the atmosphere including water vapor are more or less transparent to IR energy. Some of them really transparent, others not so transparent. C02 is rather opaque to IR. How do we know this? Well years of measurements. In fact, we build devices that depend upon this IR blocking fact. Yes, some C02 detectors depend upon this being true. And If you work on IR missiles you also would know this. Here is a simple demonstration showing how C02 is opaque to IR. “””””
So Steven, you say ‘water vapor is more or less transparent to IR’ Then for comparison, you say ‘CO2 is rather opaque to IR’.
Common English language usage, would then interpret these two statements, as being equivalent to stating that CO2 is far more opaque to IR than H2O is; or alternatively, H2O is far more transparent to IR than CO2 is.
Can you provide a link to some transmission or absorption graph, that demonstrates this superiority in IR absorption of CO2 over H2O.
Every such graph, I have ever found in peer reviewed literature or Text Books, claims exactly the opposite is the case.
Also, as to your British friend’s video demonstration (nice demo); would it be more believable if instead of using a many hundred deg C candle flame as an IR source, he used something closer to the real situation; such as perhaps an ordinary bottle of water at room Temperature (300 K).
Presuming that this chap is some sort of scientist; it would be nice if he was a bit more quantitative in his experiments, and his reports; such as for example stating the IR wavelength spectral region over which his camera is sensitive, and also how many parts per million of CO2 he actually added to his glass tube atmosphere.
I’d really like to know where I could buy a video camera that can take good resolution movies at 15 micron wavelength; which is the earth emitted wavelength region, that actually can get absorbed by CO2 in the atmosphere. Gee it is unfortunate, that it never crossed the chap’s mind to try adding water vapor to his tube of air just to demonstrate that it really is transparent to IR.
Steven Mosher
says
“From what Joe says about trace gas and from what he says about specific gravity it looks like Joe utterly misunderstands the mechanism of global warming. He thinks C02 traps heat. It doesnt. that is not the theory.”
Steven
Did you even listen to the video you provided as your proof?
On several occasions it says CO2 traps the heat!!
Do you need to aplogize to Joe?
Erinome says:
January 20, 2012 at 11:10 am
Actually my electricity rate is the lowest it’s been in years: 6.9 cents/kWh, due to a strong emphasis on renewable power in my region. Four years ago it was 11.1 cents/kWh, and 8 years ago, in another region, it was 16.2 cents/kWh.
=======================================================
Prove it. That’s one of the most fallacious babbling piece of misinformation I can imagine!!!
Today, I had to explain to a customer why a non-profit electric co-operative has a thing we call an electric purchase cost adjustment. We have those because when our nuclear plants and coal plants shut down for maintenance, we have to buy our energy from other sources. I live in Kansas, care to guess what asinine POS alternative fuel we’re buy that compels us to charge more than what we normally would? It isn’t hydro.
Pull your head out or quit trying to deceive people. Just because you want the lie to be true doesn’t mean it is. Show us the numbers hot-rod.
“”””” Ferdinand Engelbeen says:
January 20, 2012 at 3:26 pm
“”””” Michael D Smith says:
January 20, 2012 at 4:53 am
……………………………………… “””””
The problems begin with clouds. The in/out energy balance of different types of clouds ánd changes in total cloud cover are some of the many big problems in climate models: In general, low level clouds have an overall cooling effect while high level clouds have an overall warming effect. But how much is a matter of debate and how higher temperatures affect cloud cover (or reverse!)? Even the sign of cloud cover response to temperature changes is not known for sure “””””.
Well I have experienced a great many clouds, of all different types and at all different altitudes from ground level up to as high as clouds can exist.
Never once have I experienced the Temperature to WARM up when ANY CLOUD ANYWHERE gets between me and the sun. It ALWAYS COOLS.
As to the effect of height on cloud effect, the shadow cast by a cloud is essentially indpendent of the cloud height, because the sun is a near point source with a half degree divergence, so it forms sharp shadows.
The ground or atmospheric IR emittance is at least Lambertian (cosine theta) or even isotropic, so the cloud interception diminishes with at least the inverse square law, so the higher the cloud, the less IR it intercepts.
Now practical clouds do get less dense with higher altitudes, and as a result of that molecular density reduction, they actually absorb less sunlight, and also scatter (albedo reflect) less sunlight directly back into space.
BUT !!! for the very same reason of diminished density with height, the cloud also intercepts an ever diminishing part of the surface IR THAT ACTUALLY HITS THE CLOUD, but the inverse square law wins and IR interception decreases faster than ground level sunlight decreases, due to the wide angular dispersion of the surface emitted IR.
Net result is that clouds (ANY CLOUDS) always reduce ground level sunlight, and always reduce it more than they do the surface emitted IR; and ther higher the clouds, the less of both gets absorbed or reflected. There is NO cloud height, at which the Temperature at the surface goes up, because of the presence of the cloud.
Now there is a correlation between the surface Temperature and humidity, and the height of the clouds that subseqently form as a result. The warmer the surface Temperatures, the higher the moisture must go, before the natural Temperature lapse rate gets it down to the dew point so clouds can form; and the lower the surface humidity, the lower will be the dew point so again the clouds will form at a higher altitude; and they will still always result in surface cooling (when the sun goes down, and stops heating the ground).
Ammonite says:
January 20, 2012 at 12:50 pm
Your points regarding the “correct” temperature for the earth require a bit of discussion. There is nothing intrinsically special about 1975… It is not so much that there is a correct temperature as that the relatively stable climate of the holocene has allowed agricultural development (corn/maize for example took 1000s of years of human selection to become what it is today) which in turn has bootstrapped specialization and technology. (Why didn’t we have satellites 15,000 years ago?) +3C threatens to push many agricultural regions outside the norms of the last 10,000 years at a time when global population is expected to top 9 billion. Any system with a reserve can suffer excursions from “normality” for a while. That is not necessarily true for a persistent change and if that change is rapid adaptation may prove a challenge. Check out the evolution of the Palmer Drought Index.
=============================================================
Ammonite, I hate to interject, mostly because Greg has adequately muted most of your points, but, yes, we should check the Palmer Drought index, but we should also compare it in an historical context….. it’s relevance sort of falls by the wayside when we do. +3C? When is that going to happen? CO2 effecting the temp is supposedly logarithmic. In the last 100 years or so we’ve gained 1° …. Of course, we’ve lost a tenth or so in the last decade…… but to get to 3, we must, according to current theory and observations, we’re going to have to get to about 1500ppm. I think we’ll be ok.
Here, try this…. http://suyts.wordpress.com/2011/12/06/if-only/
Even if the prognostications were to be true, you honestly believe 3°C would do anything other than strengthen the flora and fauna? This time of year the flora and fauna, in my part of the world undergo more than 3 degree change a day. Which, btw, the higher part of the increase seems to correlate with the flora and fauna thriving. Weird, …. isn’t it?
The flora and fauna present today is because of their adaptability. This shouldn’t require thought, but I’d ask you to dwell on this for a moment.
James Sexton says: January 20, 2012 at 8:30 pm
Even if the prognostications were to be true, you honestly believe 3°C would do anything other than strengthen the flora and fauna? This time of year the flora and fauna, in my part of the world undergo more than 3 degree change a day.
Hi James. You are responding to an entry above that states “Any system with a reserve can suffer excursions from “normality” for a while. That is not necessarily true for a persistent change and if that change is rapid adaptation may prove a challenge.”
The fact that you can hold your breath for a minute does not mean it is a good idea to live underwater. I suggest Mark Lynas “Six Degrees” for potential impacts should a +3C change eventuate. It provides copious references to primary literature. I do not share your optimism that such a change would bring only benign effects and benefits.
George E. Smith; says:
January 20, 2012 at 8:02 pm
Net result is that clouds (ANY CLOUDS) always reduce ground level sunlight, and always reduce it more than they do the surface emitted IR; and ther higher the clouds, the less of both gets absorbed or reflected.
It is more complicated than that…
The net effect of (icy) cirrus clouds is warming: while reflecting sunlight during the day, they reflect more IR over the full 24 hours of a day, as ice in the IR spectrum is a near black body. Even low level clouds in the mid latitudes are near radiation neutral: more sunlight is reflected upward, but more IR is reflected downward too. Compare the day/night temperatures with and without clouds: full cloud cover keeps the surface cool during the day, but the night temperature doesn’t get (much) lower than the day temperature…
Water vapour also plays a role: compare the diurnal temperature in a desert with cloudless days in areas where the air humidity is much higher…
the cloud also intercepts an ever diminishing part of the surface IR THAT ACTUALLY HITS THE CLOUD
That would be true if the ground radiation was from a point source. But as the whole surface emits IR, it hardly matters, as the cloud receives IR from every part of the surface up to the horizon. Only the increase in total area between ground level and some 10 km height plays a very small role (0.2%)…
—————
Anyway, there are a lot of unknowns in cloud matters…
The current climate models all expect a positive feedback from clouds, quite different for different models but all expect that higher temperatures give less clouds. But if one asks any specialist in cloud matters, he/she expects a negative impact… Moreover, Dr. Spencer defends the theory that cloud cover changes (caused by pressure changes, solar changes,…) are the main cause of the temperature changes…
Erinome says @ January 19, 2012 at 9:44 pm: “Obama is not drilling for oil? US oil production is up 2.7% from one year ago.”
The increased oil production is taking place outside of where the Obama jurisdiction, and it is primarily due to a technology developed without the Administration blessing — fracking. Even there, the Obama administration is lending support to stop the use of this private technological development. Can oil production continue to increase despite the Administration efforts? Interesting question.
Erinome says @ “. . . why is the stratosphere cooling?”
It is hard for me to believe that a reasonable person could look at a chart of lower stratospheric temperatures over the satellite record: http://img232.imageshack.us/img232/29/lowerstratospheretemps.png , and not observe that the decrease is clustered around major low-latitude volcanic eruptions, and since the last eruption, the lower stratospheric temperatures have been mostly flat. In 1996, the average lower stratospheric temperature anomaly was -.46. In 2011, it was -.4075. That is an increase, not cooling.
Erinome says “Actually my electricity rate is the lowest it’s been in years: 6.9 cents/kWh, due to a strong emphasis on renewable power in my region.”
I have spend a good number of my years analyzing utility rates, and I still keep up on the issue. I have never seen the development of wind, solar, geothermal, . . . decrease rates. The power cost adjustments is always positive despite the huge federal and local tax subsidies. (The federal tax subsidy for wind is greater than the operating cost of a coal plant — which the wind generation typically displaces.)
It is possible to have large rate decreases in an area heavily dependent of hydro-electricity (you know, those dams that wreck havoc on salmon populations and devastate valley ecosystems). Low water levels can lead a high electric price for a couple of reasons but low electric prices can follow later when high water levels return.
By the way, that $3 per month contribution you make for green technology, means that you are funding a program so that somebody can develop wind or solar. It does not mean that “green” electrons are reaching your home.
Ammonite says:
January 21, 2012 at 1:53 am
The fact that you can hold your breath for a minute does not mean it is a good idea to live underwater.
==========================================================================
True, but that’s where you’re missing the key point. Warmth is a good thing. It always has been. Civilization, mankind, the flora and fauna ecosystems always thrives better in warm than cold. It isn’t like holding your breath, its like inhaling more fresh air.
It looks like in the next few days we are heading into the coldest days on planet earth in a decade-
http://discover.itsc.uah.edu/amsutemps/execute.csh?amsutemps
–it must be because of CO2
Smokey: Why drill for more oil if the US is now a net exporter of petroleum?
[snip. Peak oil discussion is off-topic. ~dbs, mod.]
Werner Brozack: “Under this scenario, we do not have to wait another 10 years to see 30 years of no temperature change, but we only need to wait 10 years.”
Great you are on record as saying the next 10 years. So, given the warming trend has continued unabated – and even the satellite guys keep amending their results upward – I trust we can count you as someone who understands the science well enough to be an AGW supporter (hopefully you won’t need the FULL 10 years of warming – the next El Nino will likely be a another (quote unquote) step change – ie a new floor, a new place to begin cherry picking anew, etc., etc.
Welcome the (scientific) light.
Actually Thoughtful
You have yet to post a comment that is not simple to deconstruct.
The current warming is a continuation of the planet’s natural emergence from the LIA. CO2 has had no measurable effect. And despite your statement, that warming has not accelerated. The long term trend line remains unbroken.
You also say: “…5F is 2.8C – well within the range of likely outcomes for my region. As is 8C.” Note the huge leap of faith between the spuriously predicted “2.8°C” and “8°C”. I guess a miracle occurs between those two numbers.☺
Whatever you’re trying to sell, it certainly isn’t science.
True Belief? Yes. Science? No.
Smokey–I agree. Actually there is no proof the tiny tiny blip of climate noise over the past 30yrs has anything to do with CO2:
http://wattsupwiththat.files.wordpress.com/2009/12/noaa_gisp2_icecore_anim3.gif
As we continue to recover from the last ice age:
http://pielkeclimatesci.wordpress.com/2010/12/27/guest-post-the-continuing-recovery-from-the-little-ice-age-by-syun-ichi-akasofu/
James Sexton says:
Warmth is a good thing. It always has been. Civilization, mankind, the flora and fauna ecosystems always thrives better in warm than cold. It isn’t like holding your breath, its like inhaling more fresh air.
Perhaps on average — across the entire globe, across all species, across all human societies, and across a large span of time.
So what?
The question of climate change is about adjustment to new climates, and that occurs on local area, on the level of individual species, individual cultures, and decadal lifetimes.
Your point paints far too broad a picture — the broadest imaginable. But individual species don’t live on that canvas — we live on the one we’ve gotten used to and built our current civilization on.
Bob B says:
Actually there is no proof the tiny tiny blip of climate noise over the past 30yrs has anything to do with CO2
In fact, there is such proof:
“Increases in greenhouse forcing inferred from the outgoing longwave radiation spectra of the Earth in 1970 and 1997,” J.E. Harries et al, Nature 410, 355-357 (15 March 2001).
http://www.nature.com/nature/journal/v410/n6826/abs/410355a0.html
An Inquirer says:
It is hard for me to believe that a reasonable person could look at a chart of lower stratospheric temperatures over the satellite record: http://img232.imageshack.us/img232/29/lowerstratospheretemps.png , and not observe that the decrease is clustered around major low-latitude volcanic eruptions, and since the last eruption, the lower stratospheric temperatures have been mostly flat.
It has not been flat over the last 15 years. The linear trend of the UAH LS in that time period is -0.067 +/- 0.025 C/decade.
“Actually Thoughtful says:
January 21, 2012 at 9:49 am
So, given the warming trend has continued unabated”
….as someone who understands the science well enough”
Even Phil Jones disagrees with the first point. See:
http://news.bbc.co.uk/2/hi/science/nature/8511670.stm
“C – Do you agree that from January 2002 to the present there has been statistically significant global cooling?
No. This period is even shorter than 1995-2009. The trend this time is negative (-0.12C per decade), but this trend is not statistically significant.”
He said the above about 2 years ago and it referred to the latest 8 years. Two years have passed and it is now over 10 years that there has been no warming. I know you do not trust HadCrut3 and RSS, but this fact is true for GISS as well.
As for “….as someone who understands the science well enough” again Phil Jones agreed about identical trends since 1860:
A – Do you agree that according to the global temperature record used by the IPCC, the rates of global warming from 1860-1880, 1910-1940 and 1975-1998 were identical?
Here are the trends and significances for each period:
Period Length Trend
(Degrees C per decade) Significance
1860-1880 21 0.163 Yes
1910-1940 31 0.15 Yes
1975-1998 24 0.166 Yes
1975-2009 35 0.161 Yes
So the bottom line is that there is no proof that greatly increased CO2 since 1945 did anything unusual since 1975. If you know something Phil Jones doesn’t, I am sure he would like to know.
Smokey says:
“What I’m unhappy about, though, is the ~ 3 cents/kWh power generation via fossil fuels adds to everyone’s health costs.”
That is rank, baseless and false speculation.
It is not — it comes from:
“Hidden Costs of Energy: Unpriced Consequences of Energy Production and Use”
National Research Council, 2010
http://books.nap.edu/catalog/12794.html
This study found that US fossil fuel damages were $120 billion for 2005, and that doesn’t include climate change. The authors said it was likely a “substantial underestimate.”
Electricity generation via coal: external cost = 3.2 cents/kWh ($32/MWh), with damages due to CC of another 3 cents/kWh (for CO2e priced at $30/tonne).
Transportation damage costs = 1.2 cents per mile, at a minimum, with at least another 0.5 cents for CC.
Renewables had essentially zero external damage costs.
These are all huge subsidies received by the fossil fuel industry, and a big reason why renewables don’t, at first glance, appear competitive on the so-called “free market.”
Werner Brozek – you invoke Phil Jones and your partial quote (changing his intent). So, what does Phil Jones say now? If you want to appeal to the authority of Phil Jones and his >decade of study to become a climate scientists, and his decades of work to become an expert in climate science – it is incumbent upon you to accept his whole body of work in this area.
Anything else is just a cherry pick.
As for your tortured analysis of 1910-1940 vs 1970-2010 – your co-travelers would like to blame the quiet sun for the warming now (where it isn’t) – yet ignore the solar activity of the 1910-1940 period (where it was). A typical Orwellian opposite day approach.
We are seeing warming continue unabated during a quiet sun and La Nina conditions. What will happen when the sun returns to normal activity, and we are in an El Nino? And how will you morph your confusion to handle the new reality?
If you pull away all the tricks and games you find the world is warming and man is to blame.
Ask Phil Jones.
James Sexton says:
Actually my electricity rate is the lowest it’s been in years: 6.9 cents/kWh, due to a strong emphasis on renewable power in my region. Four years ago it was 11.1 cents/kWh, and 8 years ago, in another region, it was 16.2 cents/kWh.
=======================================================
Prove it. That’s one of the most fallacious babbling piece of misinformation I can imagine!!!
I have kept a spreadsheet of my electricity bills since June 2004. In 2011 I used 8,163 kWh and paid a total of $578.18. That’s an average of 7.1 cents/kWh. (The 6.9 cents/kWh I gave earlier was from my January bill.)
By the way, my current usage is the highest it’s been since I’ve been keeping track — partly because it’s cheaper, and partly because earlier I was living in an apartment building and my apartment did not need heat or cooling. Then I was using about 4,800 kWh/yr at an average of 8.7 cents/kWh. My region is blessed with an abundance of cheap, renewable energy, and I live rather simply.
Werner Brozek says:
Even Phil Jones disagrees with the first point. See:
http://news.bbc.co.uk/2/hi/science/nature/8511670.stm
“C – Do you agree that from January 2002 to the present there has been statistically significant global cooling?
I find that since that interview (Feb 2010) the cooling is significant. (Of course, we’ve had a strong La Nina and are now having another one.) The trend of the HadCRUT3 data from Jan 2002 is -0.080 +/- 0.028 C/decade, R^2=0.07. (I haven’t worked out the p-value yet.) But the time interval is too short to draw conclusions about climate.
Erinome – you could easily achieve the results you describe by adding wind or solar to your home (for which I salute you). But you should add in the levelized cost (to you) over the 40 years or so that renewable power source will reliably provide power.
If not that – what region do you live in? As you have noted, low power prices tend to work against minimizing electricity usage (which also points out that almost ALL of us have very easy moves to reduce our electrical consumption
James Sexton says:
CO2 effecting the temp is supposedly logarithmic. In the last 100 years or so we’ve gained 1° …. Of course, we’ve lost a tenth or so in the last decade…… but to get to 3, we must, according to current theory and observations, we’re going to have to get to about 1500ppm. I think we’ll be ok.
You are ignoring feedbacks. Feedbacks happen, and are already starting.
By the way, the forcing of CO2 is only approximately proportional to ln(C). A better fit is A*ln(C+bC^2) where A=4.996 W/m2, b=0.0005, and C is in units of ppm. The difference starts to get significant as C increases — it is 15% at 500 ppm, and 22% at 1000 ppm. There are even better fits with a higher order polynomial as the logarithm’s argument (Hansen notes this in his 1988 paper (I think it was)).
Actually Thoughtful says:
January 21, 2012 at 12:56 pm
We are seeing warming continue unabated during a quiet sun and La Nina conditions.
If you were asked to justify your assertion of “unabated” warming you would of course refer to the timescale of the last few decades, especially the 1970s onwards. However an ENSO cycle event is only 1-2 years in duration. Therefore it makes no sense to discuss the two together – i.e. a long term trend over several decades is unaffected by a 1-2 year fluctuation. This observation is obvious and trivial. This is the sort of smoke and mirrors and sleight of hand that are the ubiquitous signature of all AGW argument.
Geoff Sharp says:
January 19, 2012 at 8:14 pm
While there is evidence the PDO and ENSO are connected there is insufficient evidence to say that the PDO index is an after effect of ENSO.
Basil Copeland …
…The PDO is capable of driving ENSO.
This was observed in the back to back La Nina last year where we also saw the PDO index lead the ENSO index (which is not that unusual).
While science agrees that the north Pacific SST’s have a reasonable component of NON ENSO variability there is no way we can say the PDO is an after effect of ENSO.
There is a way out of the “chicken and egg” argument about whether ENSO drives PDO or vice versa. ENSO could be a nonlinear oscillator, and as such would be driven by an attractor. One possible type of attractor is a “butterfly” Lorenz attractor with 2 wings – one labelled “el Nino” and the other labelled “La Nina”. In this paradigm, ENSO does not “lead” PDO nor does PDO lead ENSO. Instead the warm phase PDO is when the ENSO gets stuck in one butterfly attractor wing, and the cool phase is the ENSO system sticking to the other wing.
This nonlinear oscillator paradigm for ENSO is discussed at:
http://wattsupwiththat.com/2011/01/25/is-the-enso-a-nonlinear-oscillator-of-the-belousov-zhabotinsky-reaction-type/
Geoff Sharp copied my comment that read, “It sure does look to me like the Miller et al. paper agrees with everything I’ve been saying to you all along.”
And Geoff Sharp says: “Incorrect. Both Miller and Copeland very clearly show the Aleutian Low (NPI) is an important component/driver of the PDO. “
Anyone who can read English and who has bothered to read the Copeland post and the Miller at al paper will understand that they agree with my comments on this thread about the PDO. Here’s the link to the Copeland post:
http://wattsupwiththat.com/2009/05/12/pdo-enso-aleutian-low-or-some-of-each/
For example, when discussing Miller et al, Basil Copeland writes, “While acknowledging a tropical forcing (ENSO) on North Pacific SSTs, they contend that there is another, distinct forcing that is independent of the tropical forcing, related on decadal time scales to the behavior of the Aleutian Low.”
This agrees with my comments about the PDO. Why is it only you who insists on creating a separate reality?
Geoff Sharp says: “The PDO index incorporates the NPI, not by accident one would think.”
This is another falsehood on your part. The PDO is only calculated using the Sea Surface Temperatures of the North Pacific. Read the first paragraph in the description on the JISAO webpage that describes how the PDO is calculated. There’s no mention that it “incorporated the NPI”:
http://jisao.washington.edu/pdo/PDO.latest
In your comment, you disagreed with JISAO about how the PDO is calculated. But that’s no surprise. You also disagreed with the basic definition of the PDO over on the Foster thread. Why is it that your understanding of how the PDO is calculated differs from the organization who calculates the data, Geoff? And why is it that your definition of the PDO is different than JISAO, who are the keepers of the PDO data, Geoff?
Geoff Sharp says: “Miller shows north Pacific SST’s being affected by the strength of the Aleutian Low, a diagram that perhaps you missed is shown below.”
Miller et al discussed many things that impact the North Pacific SST anomalies. One of them is the NPI. How did you miss the rest of them, Geoff?
Geoff Sharp says: “Copeland shows a stronger correlation between PDO/NPI than what the PDO/ENSO is capable of.”
It seems there’s an epidemic of fabrications in your comments on this thread, Geoff. If you had read the Copeland post you would have come across his conclusions. Basil writes: “The bottom line? While ENSO forced variation may drive the PDO out to decadal time scales, it does not fully account for PDO variation on longer time scales.”
Well, there you have it! Exactly as I have been saying. ENSO drives the PDO, but there is something else that influences it. Why is that so hard for you to see that what Basil and I have written are basically the same things, Geoff? Everybody else can see it.
Basil continues, “That latter is more likely related to long term, low frequency, oscillations in the behavior of the Aleutian Low, which set up what is really the more uniquely characteristic pattern of the PDO.”
In other words, the behavior of the Aleutian Low, represented by the NPI in his post, accounts for the additional variability of the PDO that can’t be explained by ENSO. Didn’t I write a post about this very same thing? Why yes I did! I wrote about it in April 2010, approaching 2 years ago. Here’s a link once again for you:
http://bobtisdale.wordpress.com/2010/04/16/is-the-difference-between-nino3-4-sst-anomalies-and-the-pdo-a-function-of-sea-level-pressure/
Geoff Sharp says: “By restricting yourself to a ENSO only driver of PDO is demonstrating your lack of understanding once again.”
Anyone who has read this thread knows that this is yet another fabrication on your part. In my January 19, 2012 at 5:41 pm reply to JP, I wrote, “JP, people give too much credit to the PDO. You may think this is nit picking, but the negative PDO simply means that ENSO has shifted and/or that North Pacific Sea Level Pressure has shifted. In my January 20, 2012 at 10:38 am reply to Caleb, I wrote, “There is another well-known factor that influences the spatial pattern of the North Pacific. And of course, the dominant (most often occurring) spatial pattern is known as the PDO pattern. And in addition to ENSO, the other factor that causes the variations in that pattern is Sea Level Pressure.”
Geoff Sharp says: “By not taking account of all possible factors you display bad science that you are passing on to the public.”
Anyone who has read this thread understands my science is sound and that you are simply fabricating untruths for some unknown reason. I and the rest of the readers here understand you, for some reason, feel the need to misrepresent my understandings, my comments, and my posts on these subjects, but what we do not understand is why you insist on doing it since it has to be time consuming for you.
Geoff Sharp says: “On a similar note, have you amended your El Nino Rossby wave references to show this phenomenon is NOT a regular occurrence?”
The discussion of Rossby waves was written clearly in the Foster and Rahmstof post. There is no need for me to amend it. You apparently did not understand the plain language in which it was written. Everyone else seemed to.
Since I feel no need to respond to any more of your fabrications, innuendos, and misrepresentations on this thread, I will say to you:
Good bye, Geoff.
Erinome says:
“Why drill for more oil if the US is now a net exporter of petroleum?”
Answer: an increased supply will result in lower cost. In this economy that is a Good Thing. The cost of energy is factored into almost everything. Artificially limiting its supply causes the cost of everything to rise, and that hurts the poor the most. But of course, that is the point, isn’t it?
Whoa! Phlogiston – not even a hint of a suggestion, on my part, that 1-2 years be considered anything other than weather. However, given that we know La Nina favors a cooler temperature, and low solar activity favor a cooler temperature, and both are happening simultaneously and we still had the 9th warmest year on record – it doesn’t bode well for the trend. Certainly it doesn’t bode well for a claim of a cooling trend.
But I urge you and anyone else interested in the question of whether the world is warming or cooling to consider the temperature record from 1970-2011 (we are up to 41 years in that range – 35 of which are warmer than the 1950-1980 average (all those 35 years are after 1975).
So your small point -that climate is over 30 years-is correct and not counter to what I said.
Your statement of smoke and mirrors is particularly interesting -as if you look in that mirror you will indeed find who is utilizing sleight of hand -the implication that the world is not warming, nor is ma to blame, is clearly false, your bigger point is a FAIL.
My vote is for the meteorologist, Joe Bastardi.
Global temps are due to fall because the heights they herky-jerky rose to required heat energy.
They have to have sustained heat energy inputs to maintain them, unlike the 1940’s to 1970’s where they were not as high to begin with.
The globe warmed because inputs and cycles were positioned to cause it to warm.
When the oceanic heat is exhausted, it can only come back in through 2 sources.
Solar warming and internal (tectonic).
Volcanic activity can warm the oceans, but it also cuts off the Solar input side.
When that has run its course, there is only one input left standing.
On the brink of the precipice dangles the potential slope to the next Ice Age…one of many that preceeded it.
America is currently holding hands with an idealistic and utopian lobster, also on the brink.
The lobster will survive the plunge.
Erinome says:
January 21, 2012 at 11:21 am
An Inquirer says:
It is hard for me to believe that a reasonable person could look at a chart of lower stratospheric temperatures over the satellite record: http://img232.imageshack.us/img232/29/lowerstratospheretemps.png , and not observe that the decrease is clustered around major low-latitude volcanic eruptions, and since the last eruption, the lower stratospheric temperatures have been mostly flat.
It has not been flat over the last 15 years. The linear trend of the UAH LS in that time period is -0.067 +/- 0.025 C/decade
Source please?
What you are indicating does not agree with this paper:
“However, due to increasing CO2, the CCMs simulate a continuous linear cooling by 1~K per decade over the entire 1979 to 2010 period. This is not consistent with the near-constant temperatures observed since the late 1980s.”
Abstract:
Ozone and Temperature Trends in the Upper Statosphere at Five Stations
American Geophysical Union, Fall Meeting 2008.
Bob Tisdale says:
January 21, 2012 at 1:58 pm
This is another falsehood on your part. The PDO is only calculated using the Sea Surface Temperatures of the North Pacific. Read the first paragraph in the description on the JISAO webpage that describes how the PDO is calculated. There’s no mention that it “incorporated the NPI”:
Another weak attempt to confuse. The PDO incorporates SLP vaules of the northern Pacific. The NPI is constructed from the same values. But your long winded response is basically acknowledging the PDO IS driven by other factors outside of ENSO. But I suspect you will still claim that “the PDO is an after effect of ENSO” and can have no effect of global temperatures.
The discussion of Rossby waves was written clearly in the Foster and Rahmstof post. There is no need for me to amend it. You apparently did not understand the plain language in which it was written. Everyone else seemed to.
I have pointed out that your writing is ambiguous in the later comments of the Foster and Rahmstof post . I notice from the Foster and Rahmstof post R. Gates seems confused and assumes the Rossby wave to be consistent throughout El Nino events.
http://wattsupwiththat.com/2012/01/14/tisdale-on-foster-and-rahmstorf-take-2/#comment-865029
Gates says;
your insights regarding the oceanicRossby waves carrying extra surface heat unspent during a formal El Nino back toward the western Pacific is very insightful, and the fact that this occurs outside of the formally measured El Nino period, means, as you’ve pointed ouit, that it would not be accounted for in filtering process used by Foster & Rahmstorf. This residual El Nino heat certainly shows up in the linear rise they’ve found and are attributing to the anthropogenic signal.
As a guest WUWT poster and writer of your own blog you have a duty to make your representation of facts clear and concise. If you refuse to do so shows you are protecting either your ego or an agenda.
I will continue to point out your misrepresentations.
Erinome says:
January 21, 2012 at 11:21 am
An Inquirer says:
It is hard for me to believe that a reasonable person could look at a chart of lower stratospheric temperatures over the satellite record: http://img232.imageshack.us/img232/29/lowerstratospheretemps.png , and not observe that the decrease is clustered around major low-latitude volcanic eruptions, and since the last eruption, the lower stratospheric temperatures have been mostly flat.
It has not been flat over the last 15 years. The linear trend of the UAH LS in that time period is -0.067 +/- 0.025 C/decade.
——————————-
Erinome, you are data selecting.
Daily stratosphere temperatures for the global, SH, NH and Tropics. It is the volcanoes (which cause a short-term spike in temperatures as the aerosols absorb solar radiation and then produce a cooling of about 0.5C through Ozone destruction from the sulfate aerosols – and Ozone also intercepts solar radiation in the stratosphere – so breif warming spike, the 0.5C of cooling until the Ozone rebuilds which is seems to be doing, it can take 25 years for this to happen apparently).
The Tropics, for example, have recently hit highs not seen since Pinatubo.
http://img818.imageshack.us/img818/6673/uahdailylstemps.png
The volcanic impact can be seen in the stratosphere temps back to 1958.
http://www.metoffice.gov.uk/hadobs/hadat/images/update_images/global_upper_air.png
Erinome–you consider that paper proof? LOLOLOLOL
Geoff Sharp says: “I will continue to point out your misrepresentations.”
Please continue to try to do so, because the examples you give, such as R. Gates comment that you quoted, actually support my post. The fact that you cannot see that is not surprising.
And your continued misrepresentation of the components of the PDO is also blatantly obvious to all who are following this thread. You are not the spin doctor you believe you are and the readers here are much more intelligent than you believe. If you wish, feel free to continue to look foolish in the eyes of those who are reading your comments. You have no credibility, so you can’t lose any more of it.
Ciao
Today’s UAH temps (which are preliminary and need to be processed yet for the official number) are ….
-0.9C below the same day in the El Nino influenced year of 2010.
The ENSO’s 3 month lag is kicking in. The lowest temps will not be until February or April (depending on what the La Nina does this January – it looks like it will be as low as November when it got a minor La Nina level of -1.04C).
Erinome—dude–you need to take some remedial classes in science and math and learn what proof means!
I agree with Bob that the PDO is just a poor measure. We need to develop something else which is more indicative of the ENSO’s longer lasting effects or of the north Pacific’s oscillations. The problem is parts of the north Pacific will be very warm and other parts will be very cold.
As Just The Facts article notes, the ENSO region’s ocean currents are redirected to the north Pacific as a result of the rotation of the Earth and the shape of the land at its end-point. The north Pacific patterns can reflect the temperatures produced by the ENSO over the last two or three events (which can be either La Nina or El Nino).
http://www7320.nrlssc.navy.mil/global_nlom32/navo/WHOSP1_nlomw12930doper.gif
“Actually Thoughtful says:
January 21, 2012 at 12:56 pm
Werner Brozek – you invoke Phil Jones and your partial quote (changing his intent). So, what does Phil Jones say now?”
Note that I did give the full URL so anyone could see the whole quote if they wished. I quoted the part that I wished to comment on and it was not my intention to be misleading. But as for “what does Phil Jones say now?” Around May of 2011, he said the warming to the end of 2010 “was significant” for 16 years at the 95% level. However as soon as he said it, it was almost out of date since the cool 2011 temperatures made it not significant again. I will prove this two different ways for you. In 2009, the anomaly was 0.443. This WAS NOT significant. In 2010, it was 0.478. This WAS significant. So far in 2011, it is 0.347 to the end of November. (GISS dropped from 0.48 to 0.45 between November and December, so I believe I am quite safe in assuming that the 0.347 will certainly not rise by much, if anything, once the December HadCrut3 numbers are out.) So if we average 0.347 and 0.478, we get 0.413. Since this is much less than the 2009 value of 0.443, we could say that we now have 17 years of warming that is NOT significant at the 95% level.
Now for the second way: See the graphics at:
http://hadobs.metoffice.com/hadcrut3/diagnostics/global/nh+sh/
Focus on the top 95% error bar for 1995 and note that it is way above the bottom error bar for the presently green 2011 line. It is so much higher that the green line cannot catch up any more for the remainder of the year.
Now what would Phil Jones say if he were asked #3 today:
“C – Do you agree that from January 2002 to the present there has been statistically significant global cooling?
No. This period is even shorter than 1995-2009. The trend this time is negative (-0.09C per decade), but this trend is not statistically significant.” Do you agree?
#Selected data from 2002
#Least squares trend line; slope = -0.00936354 per year
See:
http://www.woodfortrees.org/plot/hadcrut3gl/from:1997/plot/hadcrut3gl/from:2002/trend
“As for your tortured analysis of 1910-1940 vs 1970-2010”
What “tortured analysis”? I just quoted Phil Jones.
“If you want to appeal to the authority of Phil Jones and his >decade of study to become a climate scientists, and his decades of work to become an expert in climate science – it is incumbent upon you to accept his whole body of work in this area.”
Exactly what should I be looking at, what he admitted in private or what he said in public? My context for this statement is:
Phil Jones, July 5, 2005:
“The scientific community would come down on me in no uncertain terms if I said the world had cooled from 1998. Okay it has but it is only seven years of data and it isn’t statistically significant.”
Camburn says:
“It has not been flat over the last 15 years. The linear trend of the UAH LS in that time period is -0.067 +/- 0.025 C/decade”
Source please?
I am the source — I calculated it myself from the UAH LS data, here:
http://vortex.nsstc.uah.edu/data/msu/t4/uahncdc.ls
It’s important to note that the uncertainty of the slope I gave above is the 1-sigma value; if you use a 95% confidence interval the linear trend of the last 15 years is -0.067 +/- 0.050 C/decade, so the cooling is statistically significant even at that level. If you find different values let me know.
What you are indicating does not agree with this paper:
“However, due to increasing CO2, the CCMs simulate a continuous linear cooling by 1~K per decade over the entire 1979 to 2010 period. This is not consistent with the near-constant temperatures observed since the late 1980s.”
What can I say — I find a different value from the data. What value do you find? From Jan 1990 to Dec 2012 the UAH LS linear trend is -0.36 +/- 0.06 C/decade (95% C.L.), R^2=0.31. The Pinatubo eruption obviously skews the results, but since it occurred early in the 1990-2011 interval this large slope is certainly believable.
Bill Illis says:
Erinome, you are data selecting.
I am not — someone else picked the 15-year time interval, not me. Download the data and do the calculations for yourself; let me know if you find a different result.
Smokey says:
“Why drill for more oil if the US is now a net exporter of petroleum?”
Answer: an increased supply will result in lower cost. In this economy that is a Good Thing.
Oil drilled in the US is sold on the world market. (Otherwise it would be a nationalization of the resource, i.e. socialism.) That market is about 87 Mb/d, of which the US supplies about 10 Mb/d. 15 years ago the world market was about 70 Mb/d, and the US supplied about 9.0-9.5 Mb/d. (My source is the EIA.)
How much more could the US drill, and for how long? Let’s say we could somehow, someway drill 15 Mb/d. That 5 Mb/d increase is not much on the world market, especially with China growing the way it is. So that increase is not going to do much for oil prices.
What that oil WOULD do, though, is provide a safety reserve for US when world production tops out. Because in that world we WILL nationalize the resource, and Canada will nationalize theirs (and perhaps sell most of it to us, though there will be big arguments about it).
So whatever oil we do have in difficult places like offshore (and it’s almost certainly not 5 Mb/d) is much more valuable to us as a reserve than as a way to reduce gas prices by 50 cents/gal. Our economic problems will not be solved if gas were suddenly $2.90/gal instead of $3.50/gal. In fact, gas was at that level in Dec 2010 and we still had big problems.
The cost of energy is factored into almost everything. Artificially limiting its supply causes the cost of everything to rise, and that hurts the poor the most. But of course, that is the point, isn’t it?
Stop being paranoid; it’s not a very useful quality.
Werner Brozek says:
we could say that we now have 17 years of warming that is NOT significant at the 95% level.
That’s not true. The linear trend for the HadCRUT3 data from Dec 1994 is +0.090 +/- 0.033 C/decade (the uncertainty represents the 95% confidence level, R^2=0.15).
You know, it’s really not that difficult to download their data and do these calculations for yourself….
Bob B says:
Erinome–you consider that paper proof? LOLOLOLOL
What problems, in particular, did you find with their methodology?
Erinome—dude–you need to take some remedial classes in science and math and learn what proof means!
I know full well what a proof is, and I strongly suspect I’ve taken many more science and math classes than you have.
Smokey says:
“Why drill for more oil if the US is now a net exporter of petroleum?”
Answer: an increased supply will result in lower cost. In this economy that is a Good Thing.
You seem to only be taking one factor into account — there are other values in life besides cheap fuel. By and large Americans have decided (at the voting booth if nowhere else) that, at today’s prices and level of supply, they do not want to risk valuable fishing grounds, beaches, coastlines and viewsheds putting oil platforms everywhere. Especially after the BP spill, and especially when they see the massive profits oil companies are already making. Exxon-Mobil made $10.3 billion in profits last quarter, and that was up 41% from a year earlier. Why? Higher prices. Oil companies LIKE prices where they’re at. (So does Canada, with its oil sands.)
Bill Illis says:
The Tropics, for example, have recently hit highs not seen since Pinatubo.
http://img818.imageshack.us/img818/6673/uahdailylstemps.png
Bill, I suspect that’s related to the very strong La Nina we had in 2010. I’ve read that during La Nina episodes the Earth tends to gain energy, but I don’t really understand why, or, if so, why it means the LT is cooler. Does anyone here know?
Smokey says:
The current warming is a continuation of the planet’s natural emergence from the LIA. CO2 has had no measurable effect. And despite your statement, that warming has not accelerated. The long term trend line remains unbroken.
Wait a minute.
1. Warming does not occur without a cause. What is the cause, if not GHGs?
2. I thought you, like many here, dispute the accuracy of the surface station record. But now you’re using it to argue for long-term warming over 160 years. So do you accept the data or don’t you?
Actually Thoughtful: I have no home solar or wind — all my electricity comes from my wall outlets, thanks to copious hydro power. And yes, I am a firm believer in the Jevons Effect.
http://dollarcollapse.com/
Anthony.
I realise your time is precious but on this site there is an interview that should be listened to. About 16:40 into Max’s rant. Ties in with what we know about the BP and Goldman influence on the AGW scam Very interesting .
regards
Erinome,
You’re arguing with everyone here, a sure sign of cognitive dissonance; Orwell’s “doublethink”. So, everyone else is out of step but you?? As if. What would your crazy alarmist pals think of you arguing with the consensus?
Explain where Americans were given the choice to vote for cheap fuel. The fact is, we weren’t. And the rest of your rubbish is emotion-based nonsense. Oil wells do not risk fishing grounds, beaches, ‘viewsheds’, etc. It is rare to be able to even see a drilling platform from shore. The vast majority of Americans have never seen one outside of pictures.
And show us current evidence of damage from the BP oil spill. There is hardly a remaining trace of that blowout, massive as it was. It’s gone now, except in your fevered imagination.
And your green-eyed envy is so thick it could be cut with a knife. How does it feel to be so consumed with greed over the fact that a company is producing something of value that consumers willingly purchase? No one makes people buy gasoline or heating oil, they want to buy it. Who are you to tell them they can’t, chump? Instead of being so disgustingly envious of others, just buy shares in Exxon-Mobil and you, too, can get a good return on your money. That would certainly be a better choice than your thumb-sucking tantrum over the fact that companies are making money legally and ethically by providing what the market [including you] wants.
Aside from believing that everyone else here is wrong, you exhibit extreme hypocrisy by using fossil fuel products yourself while badmouthing their producers. I’ll change my opinion when you’ve convinced me you live in a mud hut and don’t use any modern conveniences like gasoline, fossil fuel heat, or anything made of plastic, or eat food grown with fossil fuel-based fertilizer. I mean, really, could you possibly be any more of a finger-wagging hypocrite?
Finally, there is no requirement to give a “cause” for natural warming. There has been no “cause” proven for gravity; the Higgs boson remains an undescovered particle. It may not even exist. But the fact remains that the planet’s temperature trend is rising along the same gradually rising slope since the LIA – which shows convincingly that CO2 is at best an insignificant player. And despite your erroneous assumption, I have never disputed the longest-running temperature record in the world, because it has been recorded on the same instrument location. That record shows conclusively that there is no acceleration of rising temperatures since CO2 began it’s current rise. The long-term trend line remains unbroken. So much for your debunked CAGW conjecture. Like your other arguments, it is based on wishful thinking.
“Erinome says:
January 21, 2012 at 7:41 pm
Werner Brozek says:
we could say that we now have 17 years of warming that is NOT significant at the 95% level.
That’s not true. The linear trend for the HadCRUT3 data from Dec 1994 is +0.090 +/- 0.033 C/decade (the uncertainty represents the 95% confidence level, R^2=0.15).
You know, it’s really not that difficult to download their data and do these calculations for yourself….”
Could you please answer this question for me: Was Phil Jones correct with his answer to question B (in February 13, 2010) at:
http://news.bbc.co.uk/2/hi/science/nature/8511670.stm
B – Do you agree that from 1995 to the present there has been no statistically-significant global warming
Yes, but only just. I also calculated the trend for the period 1995 to 2009. This trend (0.12C per decade) is positive, but not significant at the 95% significance level. The positive trend is quite close to the significance level. Achieving statistical significance in scientific terms is much more likely for longer periods, and much less likely for shorter periods.
Ammonite says:
January 19, 2012 at 3:52 pm
“Big picture. Both the instrumental and thermometer records show a rise of ~0.16C/decade since satellite records began. The troposphere is warming, the stratosphere cooling, night-time temperatures are rising faster than day-time temperatures – all signatures of warming due to rising GHG concentration. Satellite measurement of heat escaping in the CO2 absorption bands show decline consistent with theory. In short, AGW is directly supported by measurement.”
These measurements show most but not all of the signs of AGW. For one thing, the amount of AGW shown by these is less than modeled. Also, the models predicting AGW to be a problem are predicting “to the level of a warming hotspot” upper tropospheric warming over the tropics, which hardly exists even now.
I agree that AGW is for real. But how much is there? For one thing, almost half of the upswing in HadCRUT3 from the early/mid 1970’s to 2004-2005 was from a periodic item that has been there since before the ~1877-1878 warm years.
Erinome,
You need to learn what proof is. The is no PROOF the magnitude of the recent tiny tiny blip of warming is nothing more then climate noise. Any 5th grader can look at the below slide show and see the recent tiny tiny blip of warming is noise.
http://wattsupwiththat.files.wordpress.com/2009/12/noaa_gisp2_icecore_anim3.gif
BTW I have advanced degrees in Engineering and mathematics and have been a high-tech VP for years
The AMSU 600mb and 400mb graphs continue their freefall.
How low can it go?
Bob B says:
You need to learn what proof is. The is no PROOF the magnitude of the recent tiny tiny blip of warming is nothing more then climate noise.
Two questions:
1) What is the magnitude of the “tiny tiny blip,” and over what time period?
2) Please quantify “climate noise.”
BTW I have advanced degrees in Engineering and mathematics and have been a high-tech VP for years
Many people have advanced degrees in these subjects (and in ones that are even more scientific).
Donald L. Klipstein says:
These measurements show most but not all of the signs of AGW. For one thing, the amount of AGW shown by these is less than modeled.
Which models? There are hundreds of models over more than 4 decades now (11 if you count Arrhenius), all of which make different assumptions about emissions scenarios, including (importantly) sulfate aerosols. Your statement is so overly broad it’s meaningless….
Werner Brozek says:
Could you please answer this question for me: Was Phil Jones correct with his answer to question B (in February 13, 2010) at:
http://news.bbc.co.uk/2/hi/science/nature/8511670.stm
You know, I honestly can’t answer that, for several reasons:
1) I don’t know exactly what data Jones was using — monthly, annual? — and over exactly what time period (Jan 1995 to Jan 2010, Jan 1996 to Jan 2010, etc?)? It’s not clear to me what the wording of the question means, “…from January 1995….”
2) I don’t know what dataset Jones was using. HadCRUT3 I assume. But the numbers are revised all the time, slightly, for past months, but sometimes going back years. I can’t find a revision history on their site, but I believe there were some significant revisions to their January numbers for recent years going back at least a decade. I’m not sure why.
3) I have taken statistical uncertainty into account, but not measurement uncertainty. The Hadley said says annual values are uncertain to +/- 0.05 C. Is the same true for monthly measurements? Is this a 1- or 2-sigma confidence level?
With the above provisions, here’s what I find for the linear trends for the last time I downloaded the HadCRUT3 data, about one month ago. Uncertainties are the 95% confidence level.
Jan 1995 – Jan 2010: +0.112 +/- 0.040 C/decade
Jan 1996 – Jan 2010: +0.098 +/- 0.045 C/decade
The time periods include the end months. So by my calculation the warming IS statistically significant. I would certainly welcome checks on my results.
Since Jones knew exactly what data he was using and presumably did the calculation himself, I would think he knew what he was talking about.
Smokey: Of course — OF COURSE — it is necessary to give a cause for global warming. That’s bleeding obvious. GW isn’t a fundamental force; the Earth is a system that responds to fundamental forces. A change in temperature requires a flow of energy/heat. What is that flow from???
Explain where Americans were given the choice to vote for cheap fuel.
The voting booth. Candidates discuss their positions, which are well-covered by the media.
Oil wells do not risk fishing grounds, beaches, ‘viewsheds’, etc.
Tell that to residents of the Gulf Coast. Read (and see the pictures) on The Stuart Smith Blog.
No one makes people buy gasoline or heating oil, they want to buy it. Who are you to tell them they can’t, chump?
We all have an equal say in how our national resources are managed.
Aside from believing that everyone else here is wrong, you exhibit extreme hypocrisy by using fossil fuel products yourself while badmouthing their producers.
As society is currently structured, there is little choice about one’s energy needs or how they are filled. And I’m not bad-mouthing energy companies; I’m saying we have plenty of cheap oil (cheap enough), should hold some in reserve, and should decrease its use because of its many, large negative side-effects — INCLUDING releasing carbon into the atmosphere on geologic scales.
I have never disputed the longest-running temperature record in the world, because it has been recorded on the same instrument.
What instrument? The Hadley data is based on thousands of thermometers with many different lifetimes, taken in many different ways at many different places. It is no one instrument, but a vast series of measurements. You accept, then, the BEST results and believe Anthony’s objections are not valid?
Erinome says:
“Of course — OF COURSE — it is necessary to give a cause for global warming. That’s bleeding obvious.”
Wrong, even if you yell in all caps. Here, let Prof Richard Lindzen explain it to you:
Thus, no specific explanation is necessary. Desirable, yes. Necessary? No.
Celestial spheres explained the motion of the stars and planets, including retrograde motion. But the explanation was completely wrong, as is the claim that CO2 is the primary cause of global warming, which is based on the logical fallacy of the argumentum ad ignorantium: “Since we can’t think of any other reason for global warming, then it must be due to CO2.” Wrong. As Dr Lindzen explains, it is natural warming. And the warming has been going on at the same rate since well before CO2 began to rise, therefore CO2 is the wrong cause.
And please don’t cite BEST. It’s been debunked.
Bill Illis: Thanks for the link to the animation of the Navy Layered Ocean Model (NLOM) speed layer data. I’ll have to rummage through their archives one of these days. They always have great visuals.
Regarding the types of realistic indices for the North Pacific, I would hope the KOE SST anomalies would be considered due to its influence on Northern Hemispere TLT and Surface Temperature anomalies. The secondary effects of ENSO really show up there. If memory serves me well, the KOE variations are about 40 to 50% of NINO3.4 SST anomalies. And for the whole basin, why not simply detrend North Pacific SST anomalies, similar to the AMO. That would end the confusion. Stephen Wilde has been using that in his discussions recently, if memory serves, and calling it something like the Pacific Multidecadal Oscillation.
Regards
“Erinome says:
January 22, 2012 at 11:42 am”
Thank you for your detailed reply!
When I plot “HADCRUT3 unadjusted global mean” in woodfortrees from 1995 to 2010, it gives me a slope of #Selected data from 1995
#Selected data up to 2010
#Least squares trend line; slope = 0.010666 per year
This is in the ball park for Jones’ value of 0.12 per decade.
(This would be monthly data from January 1, 1995 to December 31, 2009.)
http://www.woodfortrees.org/data/hadcrut3gl/from:1995/to:2010/trend/plot/hadcrut3gl/from:1995/to:2010
“I have taken statistical uncertainty into account, but not measurement uncertainty.”
I assume that whatever Jones took into account was reflected in the 95% error bars at:
http://hadobs.metoffice.com/hadcrut3/diagnostics/global/nh+sh/
Based on those error bars, I believe I have figured out where Jones is coming from. He gets a different value than you. However I wish to stress that I am NOT suggesting that you or Jones is right and the other wrong. For example, 2011 was 12th warmest on RSS but 9th warmest at UAH. They are just different for their own reasons.
“Erinome says:
January 21, 2012 at 7:41 pm
Werner Brozek says:
we could say that we now have 17 years of warming that is NOT significant at the 95% level.
That’s not true.”
Let me rephrase that to:
Once the data for December, 2011 are in, and if Jones were to be asked a similar question in an interview, Jones could very well say:
B – Do you agree that from 1995 to the present there has been no statistically-significant global warming
Yes, but only just. I also calculated the trend for the period 1995 to 2011. This trend (0.084C per decade) is positive, but not significant at the 95% significance level. The positive trend is quite close to the significance level. Achieving statistical significance in scientific terms is much more likely for longer periods, and much less likely for shorter periods.
(#Time series (hadcrut3) from 1850 to 2011.92
#Selected data from 1995
#Least squares trend line; slope = 0.0084082 per year)
Consider 0.84 per century now, as was the case for Hadcrut3 over the last 17 years. Without being concerned about the 95% level for the moment, we would not reach the 2 C mark until well into the next century. So unless this rate makes a very quick upward spike, my grandchildren and James Hansen’s grandchildren should be just fine, even if we do nothing about CO2.
Smokey says:
Prof Richard Lindzen:
For small changes in climate associated with tenths of a degree, there is no need for any external cause. The earth is never exactly in equilibrium. The motions of the massive oceans where heat is moved between deep layers and the surface provides variability on time scales from years to centuries. Recent work suggests that this variability is enough to account for all climate change since the 19th Century.
What “recent work?” Who did it? Where is it published? In fact, measurements show that the oceans are *gaining* heat, not losing it: http://www.nodc.noaa.gov/OC5/3M_HEAT_CONTENT/
We are not talking about a “tenths of a degree,” but about 1 C surface warming since 1950 (BEST) and 11e22 J ocean heating since 1980. That’s a huge amount of heat — over a week’s worth of all the solar energy incident on top of the atmosphere, and about 5 week’s worth of all that’s received at the surface.
Where did this 5 week’s worth of extra energy come from?
—
I see nothing in your link that “debunks” BEST. Nothing — unless you live in an alternate scientific reality where a decade’s worth of flat surface temperatures says something about climate change.
This was in reply to Mosher’s post with the candle-CO2 vid. Satellite obs have recorded the change of radiance in precisely the spectra we expect as CO2 accumulates in the atmosphere. To borrow Mosher’s terminology, we have been watching the ‘transmission windows’ close via satellite.
In theory the lower stratosphere should cool over the long term with more GHGs in the troposphere. That has also been verified by satellite obs.
There are abundant lines of evidence that point to CO2 having an effect – not just tropospheric and surface temperature. And, of course, the understanding of the ‘greenhouse’ effect was a property of physics long before we had satellite instruments to measure and verify it.
The glass tube filling with CO2 is sealed. The candle is outside the glass tube. If your computer monitor is any good, you can see the outline of the flame still burning at the same height, but far less brightly due to the radiance being absorbed by CO2.
Someone else replied that CO2 out of a gas bottle is cold, and that the change of temp in the glass tube from the cold gas would interfere with the flame. There are a bunch of tests on youtube where they apply thermometric instruments to the volume filling with CO2 gas, and the temperature goes up.
This is empirical physics. CO2 absorbs radiation. Period. Denying this fact puts you outside any intelligent discussion of the general topic. The skeptic cause is not helped by incurious adherents denying anything and everything about the physics behind the ‘greenhouse’ effect. As a result of this, what ‘warmists’ and fence-sitters see is a motley crew of contradictory opinions and a bunch of ignorance. This will not persuade. (But maybe that isn’t the point here)
Werner,
Jones said, a few months ago, that there was now enough data that the linear trend from 1995 is statistically significant. I think that will still be the case even with the added variation of 2011.
http://www.bbc.co.uk/news/science-environment-13719510
barry says:
January 22, 2012 at 5:28 pm
“In theory the lower stratosphere should cool over the long term with more GHGs in the troposphere. That has also been verified by satellite obs”.
Care to share your source of this information with us? Your statement contradicts all temperature measurements of the stratosphere that I have seen for the past 15 years.
Camburn,
15 years is not long term in climatology. In surface temp data that’s not even a long enough time period to get linear trends with statistical significance. The cooling over the last 30 years (long term) is apparent in UAH and RSS data.
RSS graphic
RSS data – http://www.remss.com/data/msu/monthly_time_series/RSS_Monthly_MSU_AMSU_Channel_TLS_Anomalies_Land_and_Ocean_v03_3.txt
UAH data – http://www.nsstc.uah.edu/public/msu/t4/uahncdc.ls
The decadal trend for the last 30 years is:
-0.3C for RSS
-0.38C for UAH
Do you have some different data?
(BTW, I ran a linear regression – just out of curiosity – for the 15 years Jan 1997 to Dec 2011 and got a result of -0.06C/decade for UAH, and -0.07C/decade for RSS. But it’s not significant in any sense of the word, and the slope can change sign just by shifting the end points a few months. IOW, 15 years of data is too susceptible to the variability to discern a signal. You need more data. Guessing from the amount of variance, I’d say 20 years would be a good minimum for detecting trends in lower stratosphere data, but someone with better stat skillz than me will have to verify that.)
barry says:
January 22, 2012 at 6:24 pm
From http://www.bbc.co.uk/news/science-environment-13719510
the following appears:
“HadCRUT shows a warming 1995-2010 of 0.19C”
However let us compare apples with apples.
#Selected data up to 2010
#Least squares trend line; slope = 0.010666 per year
#Selected data up to 2011
#Least squares trend line; slope = 0.0108234 per year
#Selected data up to 2012
#Least squares trend line; slope = 0.0084082 per year)
There was a slight increase in slope from 2010 to 2011, but a big drop during this past year. So if the slope of 0.010666 per year was NOT significant according to Phil Jones criteria two years ago, I see no way that the lower value of 0.0084082 per year can be significant two years later. Unless I am totally misreading things, the latest number is much less significant than the value two years ago.
Erinome says:
January 22, 2012 at 11:54 am
Smokey: Of course — OF COURSE — it is necessary to give a cause for global warming. That’s bleeding obvious. GW isn’t a fundamental force; the Earth is a system that responds to fundamental forces. A change in temperature requires a flow of energy/heat. What is that flow from???
But Smokey gave you the cause, coming out of the Little Ice Age accounts for all the warming.
Werner, unless I’m misreading your comments you seem to be confused about the meaning of the term ‘statistical significance’. Significance in this respect has nothing to do with the magnitude of the slope or the importance of it’s value, but with the likelihood that there is an actual trend.
People have long confused ‘significant’ as in ‘meaningful’ or ‘important’ with its meaning in terms of statistical function, which is quite different. The wiki page lays it out.
http://en.wikipedia.org/wiki/Statistical_significance
Are you suggesting that there is a ‘normal’ temperature that the Earth gravitates towards?
‘Recovery from little ice age’ in no way describes a physical mechanism/s responsible for changing the Earth’s temperature. It’s vacuous. Like saying the reason the Earth is warmer than before is that it was cooler back then.
Barry,
“Recovery from the LIA” is not a phrase that I would use. Rather, “emerging from the LIA”
The world is always emerging from some climate state. The LIA was an emergence from some climate regime that preceded it. Before that, the world was emerging from the MWP. In my years of studying GCCs, I doubt they have a good handle on explaining the emergence from the LIA, and they certainly do not have a handle on the emergence into the LIA. (I can elaborate on that assessment if you wish.)
Unless I see tremendous progress some place, I would say it would be an indication of excessive hubris to say that we can confidently detail the “physical mechanism/s responsible for changing the Earth’s temperature.” There are too many variables with too poorly understood relationships. (This conclusion means that those who are predicting a decade of significant cooling are just as reckless as those predicting a huge warming trend.)
Erinome says:
“What ‘recent work?’ Who did it? Where is it published?”
Lindzen was referring to Tsonis, 2007. Unlike you, he would know.
Next, Erinome says:
“We are not talking about a “tenths of a degree,”…”
Wrong. The planet has warmed ≈0.8°C in the past ≈150 years. .8 = 8/10ths.
And Erinome says:
“I see nothing in your link that “debunks” BEST.”
Time to visit an optometrist, then: click [More here] See?
• • •
barry:
You don’t know the physical mechanism that is causing the planet to emerge from the LIA. We just know that it is. And CO2 is an extremely unlikely cause. It is a classic argumentum ad ignorantium fallacy to assign blame to one insignificant entity: “Since we can’t think of any other cause, then it must be due to CO2. And besides, they pay us grant money to blame carbon!”
Just because all the causes aren’t figured out yet, it doesn’t mean the planet is not warming along the same trend line since the LIA. Well, until recently, that is…
“”””” the cloud also intercepts an ever diminishing part of the surface IR THAT ACTUALLY HITS THE CLOUD
That would be true if the ground radiation was from a point source. But as the whole surface emits IR, it hardly matters, as the cloud receives IR from every part of the surface up to the horizon. Only the increase in total area between ground level and some 10 km height plays a very small role (0.2%)… “””””
“”””” That would be true if the ground radiation was from a point source. “””””
I beg to differ, it doesn’t have anything to do with the “source” of the surface emission. The simple fact is that as the cloud height increases, the molecular (H2O) density of the cloud diminishes, so the amount of surface LWIR FROM ANYWHERE ON THE SURFACE that “actually hits the cloud”, is diminished since the absorption is a per molecule phenomenon. Of course for the same reason, the amount of sunlight absorbed or reflected from the cloud also diminishes; but the geometrical shadow of the cloud formed by the sun is essentially independent of the cloud height, since the sun, IS a near point source, and the range of cloud heights is totally negligible compare to the distance to the sun.
But the surface LWIR capture and re-emission (NOT REFLECTION) of the cloud is affected by the inverse square law for cloud height. And the cloud re-emission of LWIR is isotropic, so half of it escapes to space, and only half of it propagates downward, where it undergoes another inverse square law dispersion, arriving at the surface spread over a vsastly increased are from that which first emitted it.
And if you insist on bringing in the emission from other surface areas not directly below the cloud; be my guest; and then say hello to a cosine^8th further attenuation due to the angle of obliquity from the zenith. So cloud height and obliquity effect is h^-4.Cos^8 (angle) No matter how you skin it, the cloud return of surface emitted LWIR diminishes catastrophically with increase in cloud height, and obliquity. It’s trivial geometrical optics; which incidently is how I make my living.
An Inquirer,
I’ve used “emerging” and “recovery” interchangably. On reading your post, I have to agree with you that the correct term is “emerging”. Thanks for making the distinction clear.
“”””” Ferdinand Engelbeen says:
January 21, 2012 at 2:37 am
George E. Smith; says:
January 20, 2012 at 8:02 pm
Net result is that clouds (ANY CLOUDS) always reduce ground level sunlight, and always reduce it more than they do the surface emitted IR; and ther higher the clouds, the less of both gets absorbed or reflected.
It is more complicated than that… “””””
No, other things may be more complicated than that; BUT the fact remains that every single molecule of H2O or O3, or CO2 that is introduced into the atmosphere (extra) must reduce the ground level insolation, since ALL THREE of those molecular species absorb some part of the solar spectrum in the region where it contains most of its energy; that is between 0.25 and 4.0 microns wavelength which is 98% of the solar energy spectrum.
That solar spectrum energy is PERMANENTLY LOST to the surface (where it will be largely stored) but it heats the atmosphere, which in turn will radiate it in an isotropic LWIR spectrum, only half of which can reach the ground, as LWIR, not as solar spectrum radiation. Unlike much of the soalr spectrum radiation whcih penetrates deep into the oceans, the LWIR goes a few microns into anything it hits, and in the case of the oceans largely promotes increased surface evaporation; not deep ocean storage.
So there is a permanent irretrievable loss of about half of the incoming solar energy, that is captured by atmospheric gases of all kinds, just as the Raleigh scattering of the blue light permanently removes about half of that scattered incoming energy.
No matter how you slice it, less surface solar energy leads to cooling; the rest is just a redistribution of that energy. Besides that it is the surface warmth that causes the high clouds; not the reverse.
“barry says:
January 23, 2012 at 3:44 pm
Significance in this respect has NOTHING to do with the magnitude of the slope or the importance of it’s value, but with the likelihood that there is an actual trend.” (emphasis mine)
But if the HadCrut3 slope for the last 17 years had been 0.001 degree/ century, there is no way you could say with 95% confidence that warming is occurring. So I could also say: “the likelihood that there is an actual trend” has MUCH “to do with the magnitude of the slope”.
Let us see if Phil Jones brings up this point again.
Werner,
That is so, but the result is still a property of statistics. In this case, the confidence interval would be greater than the trend, and so would not be statistically significant. OTOH, if each real data point fell on or very close to the trend line, then it would be possible to achieve statistical significance for a 0.01/C/decade trend over 17 years. Neither of our ‘what ifs’ matches the reality, of course.
F significance and p-test in Excel recommend that the linear regression trend Jan 1995 to November 2011 is statistically significant (less than 5% chance the trend is a statistical fluke), but I’m not an expert in statistics and would hesitate to say anything categorically without further testing, for which I lack the skill.
But the point remains – Phil Jones was using the term in its statistical sense. When he said a few years ago that the trend from 1995 was not statistically significant, he was absolutely not talking about its magnitude. Do you understand that? Did the wikipedia page defining statistical significance clarify the issue?
An Enquirer,
‘Emergence’, ‘recovery’ – it’s just different flavours of waffle. The rhetoric is empty of explanatory power. There’s plenty more like it, too, but it’s not the physical explanation that many seem to think it is.
I am amazed that people in this day and age can so casually dismiss the explanatory power of the effect of increasing atmospheric CO2 on planetary temperature. When Lindzen, Spencer, Christy, Pielke’s Snr and Jnr, Bob Tisdale and most of the skeptical bloggers – including Anthony Watts – accept the physics, the holdouts must truly have a problem. One can argue about the magnitude of the effect, as some of the above do, but one can no longer discount it and remain a sensible contributor to the discussion.
I have also previously stated that natural global cooling will soon recur. I wrote in 2003 that cooling would start by 2020 to 2030. This was based in part on NASA’s now-obsolete prediction that SC 24 would be strong but SC 25 would be weak. SC24 now appears to be weak, so cooling could happen sooner.
I have also stated many times that global cooling is a much greater threat to humanity and the environment than global warming. The threat to food production of even modest global cooling is significant. Do we even store significant reserves of grain anymore? Global cooling is what our foolish governments should be worried about – not small fractions of a degree of natural global warming.
barry says:
January 23, 2012 at 10:16 pm
An Enquirer,
‘Emergence’, ‘recovery’ – it’s just different flavours of waffle. The rhetoric is empty of explanatory power. There’s plenty more like it, too, but it’s not the physical explanation that many seem to think it is.
I am amazed that people in this day and age can so casually dismiss the explanatory power of the effect of increasing atmospheric CO2 on planetary temperature. When Lindzen, Spencer, Christy, Pielke’s Snr and Jnr, Bob Tisdale and most of the skeptical bloggers – including Anthony Watts – accept the physics, the holdouts must truly have a problem. One can argue about the magnitude of the effect, as some of the above do, but one can no longer discount it and remain a sensible contributor to the discussion.
____________________
Here is the problem Barry: CO2 LAGS temperature at all measured time scales. So your cause is lagging your effect. This is the 64-ton elephant in the room, that nobody wants to talk about.
I may be wrong about this, but I doubt it.
Allan,
For the geological past, the cause and effect has almost always been as you say, to our knowledge (but check the PETM event for a potential analogue to today). And you are quite wrong that no one talks about it. In fact this meme has been done to death (google ‘CO2 lags temperature’ – I got 4 million hits on google, and 17 500 hits on google scholar).
But today human industry is increasing atmospheric CO2, and physics tells us that, all else being equal, this will heat the planet. To deny that is to deny physics.
(It is a logical fallacy to posit that if A causes B, then B cannot cause A. If that were the case, feedback systems could not exist)
barry says:
“I am amazed that people in this day and age can so casually dismiss the explanatory power of the effect of increasing atmospheric CO2 on planetary temperature. When Lindzen, Spencer, Christy, Pielke’s Snr and Jnr, Bob Tisdale and most of the skeptical bloggers – including Anthony Watts – accept the physics, the holdouts must truly have a problem.”
You are the holdout, and it doesn’t take much to amaze you, barry. All the folks you mention are highly knowlegeable. You, OTOH, apparently get your talking points from Pseudo-Skeptical Pseudo-Science, so it’s not surprising that you don’t understand. Here, let me help:
The planet has been emerging from the unusually cold temperatures of the LIA: click
Even if it’s not clear to you, it is clear to the rest of us that the rising temperature trend is irrespective of the rise in the entirely beneficial trace gas and airborne fertilizer CO2. Believe whatever nonsense you want about “carbon”, barry, but the fact is that the planet’s temperature changes without regard to CO2.
Actually, Barry it has been ignored to death.
The counter-arguments, like yours here, are religious, not scientific, based on global warming dogma.
_________________________
The following is from memory but is reasonably accurate.
The northern CO2 measuring station at Barrow, Alaska has a seasonal amplitude of almost 20ppm whereas the one at the South Pole has almost no seasonal amplitude.
The rise in average atmospheric CO2 is about 2ppm/year, or about one-tenth of the seasonal amplitude at Barrow.
Natural CO2 flux is therefore many times greater than the relatively small component from humanmade emissions.
Furthermore, the material balance argument does not work, and is probably based on faulty assumptions.
One more clue is that in the modern data record, dCO2/dt varies almost contemporaneously with T AND CO2 lags T by ~9 months*
(where CO2 is global average atmospheric CO2, t is time, and T is global average Temperature)
AND
From ice core data, CO2 lags Temperature by ~600-800 years on much longer time scales
SO
CO2 lags Temperature at all measured time scales.
AND YET
Most parties still insist that the mainstream climate debate should be “by how much does increasing atmospheric CO2 drive temperature upwards”, when perhaps they should be asking themselves why they apparently allege that the future is causing the past.
Maybe atmospheric CO2 is still increasing because of a 600-800 year lag since the Medieval Warm Period.
And there is a much shorter cycle with a ~9 month lag of CO2 after Temperature.
Conclusion:
Atmospheric CO2 LAGS temperature at all measured time scales,
SO
the hypothesis that CO2 is a significant driver of global temperature apparently assumes that the future is causing the past.
The popular counter-arguments are:
a) It is a “feedback effect”,
OR
b) It is clear evidence that time machines really do exist.
Both counterarguments a) and b) are supported by equal amounts of compelling evidence.
Saying it louder or more often does not make it true. Neither does saying “everybody agrees that…”
The one certainty about climate science is that we have a lot to learn.
The other certainty is that we are in the latter part in a brief warming period, between periodic (~100,000 year) advances of continental glaciers.
All this nonsense about catastrophic humanmade global warming ignores the vast body of scientific evidence – that it is predominantly natural and mild, and is not dangerous.
On the other hand, the next glacial advance, soon to come to your neighbourhood, could really mess up your golf game…
______________________________________________________
• http://icecap.us/images/uploads/CO2vsTMacRae.pdf
barry says:
January 23, 2012 at 5:31 pm
But Smokey gave you the cause, coming out of the Little Ice Age accounts for all the warming
Are you suggesting that there is a ‘normal’ temperature that the Earth gravitates towards?
? Of course, the Ice Age we’re in. Every 100,000 thousand years we have a brief respite from it for around 15,000 years, it’s called an interglacial, our current one is called the Holocene. When, inexplicably still, but it’s an ongoing study, this happens and gazillions of tons of ice melt and raise sea levels 300ft plus we have balmy global warming, but at each peak of temperature we begin the slide back down into our Ice Age. In sort of hiccups of ups and downs, but always down.. [Our Holocene had an unexpected 1,000 year flip back into glacial near its beginning which killed off our weird and wonderful megafauna, some think this was asteroid catching the animals who would have moved north by then, off-guard.]
‘Recovery from little ice age’ in no way describes a physical mechanism/s responsible for changing the Earth’s temperature. It’s vacuous. Like saying the reason the Earth is warmer than before is that it was cooler back then.
I was replying to :
Erinome says:
“Of course — OF COURSE — it is necessary to give a cause for global warming. That’s bleeding obvious.”
Coming out of the Little Ice Age was the cause, the effect was that temperatures rose. Just as the rise of the Mediaeval Warm Period was the effect of the preceding dip into cold ending.
But all of these are just blips, hiccups of warming, on the inexorable slide back down into our Ice Age, back to another 100,000 years of glaciation. Sea levels will again drop 300ft + and those, say in Britain, will have a couple of miles of ice on top of them if they live in Birmingham, I don’t recall off-hand if Birmingham Alabama escapes this, but I think it does.
Now, carbon dioxide always follows these changes, trailing by around 800 years, so obviously irrelevant to whatever does cause this – do you really think it logical to think that a miniscule rise of a trace gas now which has never shown any inclination to drive these great and dramatic cyclical changes of temperatures in the past, is causing the little hiccup rise of warming now on the recurring slide back down in our Ice Age?
Ice Age is our Norm. Carbon dioxide lagged behind the rapid rises of temperatures at the beginning of interglacials by around 800 years – does carbon dioxide have some kind of magic powers that it can make such powerful changes to end glacials 800 years before it makes its own rise?
If you can’t explain these dramatic changes in warming and cooling in and out of our Ice Age with reference to carbon dioxide, then you simply don’t have anything worth saying about carbon dioxide now. The cause is the Norm of these cycles, our particular rise now the effect of the previous blip of cold ending, and both just a blips on the usual slide back into glaciations at the end of interglacials.
What’s vacuous is pretending carbon dioxide is the cause when there is no logical reason to associate it with these recurring cycles of massive global warming and cooling.
barry says @ January 23, 2012 at 10:16 “I am amazed that people in this day and age can so casually dismiss the explanatory power of the effect of increasing atmospheric CO2 on planetary temperature.”
I have not read every comment, but it is a gross misstatement to suggest that skeptics dismiss the ability of CO2 to increase air temperature in laboratory conditions. Since laboratory work supports the theory, there are very few people who doubt that increasing CO2 impacts global temperature.* The question is how much! Could the natural variations swamp the CO2-induced global warming? Could the CO2-induced global warming fall far short of catastrophic implications? Consider that in 2008, the global temperature was below the 1988 value. Notice that I did not say 1998! Over 20 years, natural variation swamped whatever impact we had from increasing CO2 levels. Of course, 20 years is a short time, but alarmists have used shorter lengths of time to support their arguments.
I parted ways with Dr. Hansen several years ago on his GCC model. I made no headway in pointing out to him that his model was designed to give CO2 high explanatory power and therefore by design would forecast significant temperature increases as CO2 levels increased. The question is not whether CO2 can cause temperatures to increase, but rather: Have we built a reliable model that is unbiased in its delegation of explanatory power to CO2? Many months of examining the models tell me NO to that question. Of course, I hear a rejoinder: “Let the skeptics build a better model.” Reaction to that rejoinder: I doubt that we have a good enough handle on relationships – or even the basic data – to build such a model. Of course, one example of a successful model is a simple one putting global temperature as a function of PDO and AMO. But can we say what drives the PDO and AMO? Bob Tisdale has useful insight on the impact of ENSO and SOI on PDO, but this does not get us very far in the ability to build a forecasting model.
_______________________________________________________-
*(Actually, here is an interesting counter thought: In some localities, increased CO2 could lead to ground cooling. The logic is not difficult: increased CO2 leads to more vigorous flora growth which shades the ground. Further, we might see some temperature impact of evaporation, but this post already too long. . .)
“barry says:
January 23, 2012 at 9:57 pm
OTOH, if each real data point fell on or very close to the trend line, then it would be possible to achieve statistical significance for a 0.01/C/decade trend over 17 years.”
I almost agree. But I think it should be 19 years since the 95% error bars at the following span a range of about 0.19 degrees C:
http://hadobs.metoffice.com/hadcrut3/diagnostics/global/nh+sh/
But for discussion sake, let us use 17 years. As a result of our discourse, I would now even go so far as to say that if you had a slope of 0.01/C/decade trend over 17 years, it would be 95% significant, even if the data points were all over the place.
What we had for the last two years was:
#Selected data up to 2011
#Least squares trend line; slope = 0.0108234 per year
#Selected data up to 2012
#Least squares trend line; slope = 0.0084082 per year
So to be consistent with what I said above,
I would say 0.0108234 per year over 16 years IS significant, but
0.0084082 per year over 17 years is NOT significant.
(16/17 x 0.0108234 = 0.0101867)
So if the years/17 x trend is above 0.01, then you have 95% significance. So in that case, you would need the slope of 0.0084082 per year for 20 years to achieve 95% significance.
Allan, we’ve increased the atmospheric content of CO2 by 40% over the last couple hundred years. This heats the planet. To deny that is to deny basic physics. Invoking the historical cause/effect relationship is irrelevant to this fact.
There are a great many blog pages dealing with the CO2 lag/lead meme. If you’ve failed to find them by googling then perhaps you haven’t learned to make best use of a search engine from a popular debunking series.
And here’s a couple of articles on the subject from a well-known climate science site – how did you miss these?
http://www.realclimate.org/index.php/archives/2004/12/co2-in-ice-cores/
http://www.realclimate.org/index.php/archives/2007/04/the-lag-between-temp-and-co2/
And here’s another
http://scienceofdoom.com/2010/01/15/co2-lags-temperature-in-the-ice-core-record-doesnt-that-prove-the-ipcc-wrong/
And I’d post one from skepticalscience, but that is tabla non grata around here. You can google it easily enough.
Bottom line – rising CO2 can be both a consequence and a cause of rising temperatures. In the modern era, it is primarily a cause. It took 5000 years for CO2 to increase by 100ppm during the climb out of the last ice age, and that occurred during a 5 decree C global temperature change. Clearly, that has not happened since, even though CO2 has again risen by 100ppm in the last couple hundred years. It is the emissions of human industry that have increased atmospheric CO2 now, not global temps. It is happening much faster than in the geological record, and physics tells us that increased GHGs will raise the heat of the planet. This is straightforward, and controversial only to people who deny or are ignorant of empirically proven facts. Such people shed no light on the debate.
An Enquirer,
Can you not see the posts in between yours and mine saying that CO2 cannot be a cause of temperature rise because it is a consequence of temperature rise – essentially arguing that because A has caused B in the past, that B cannot cause A? These people are denying the empirical fact you have alluded to.
Let’s be clear – the people making this argument are
Mhyrr – “there is no logical reason to associate [CO2] with these recurring cycles of massive global warming and cooling.”
Smokey = “Believe whatever nonsense you want about “carbon”, barry, but the fact is that the planet’s temperature changes without regard to CO2.”
Allan Macrae – “Most parties still insist that the mainstream climate debate should be “by how much does increasing atmospheric CO2 drive temperature upwards”, when perhaps they should be asking themselves why they apparently allege that the future is causing the past.”
This CO2-no-effect opinion is alive and well among the denizens of WUWT. Smokey thinks I have a problem because I agree with Lindzen, Spencer, Christy, Pielke, Tisdale and A Watts on this. Go figure.
Yeah, that’s what I said.
But we’ve strayed from the point. I’ll remind you that some have said upthread that the reason the globe has warmed is that we’ve emerged (or recovered) from the little ice age. Well, “today is colder than yesterday, as we have ’emerged’ out of yesterday’s warmth”. Have you learned anything about why this change occurred? I deployed ’emerged’ in the sentence, and according to you this should illuminate something about the cause of the change.
barry says:
“Bottom line – rising CO2 can be both a consequence and a cause of rising temperatures.”
Nope. Only the consequence has been proven. On all time scales, from months to hundreds of millennia, rises in CO2 always follow rises in temperature. No exceptions; rises in CO2 never lead rises in temperature. Therefore, the religious belief that rises in CO2 cause rising temperature is an evidence-free leap of faith.
The past decade shows zero cause and effect between global temperature and rising CO2. In any of the hard sciences, that disconnect between models and reality would be more than enough to falsify the AGW conjecture. The planet is just not cooperating with the alarmist cult’s beliefs. So who should we believe? The cultists? Or Planet Earth?
Any warming due to CO2 is so insignificant that it can be completely disregarded for all practical purposes. And what little warming may be caused by CO2 is entirely beneficial – as is the increase in CO2 itself. Only those whose common sense has been hijacked by the constant barrage of anti-“carbon” propaganda still buy into the CO2=CAGW nonsense.
2xCO2 may cause a 1°C rise, ±0.5°C, but that is insignificant, and entirely beneficial. More warmth is entirely a good thing, and more CO2 is entirely beneficial. The lunatic belief that CO2 can cause runaway global warming and climate catastrophe has no basis in the entire history of the planet.
Werner, you’re not understanding me. You’ve confused a hypothetical example with actual data. And you have not in any way calculated statistical significance.
Go to the wiki page I linked for you. Read it. Look at the equations for determining statistical significance. You are completely off base.
Or, forget the temperature data – just explain to me what you think statistical significance is, and how you would test for it. I’m actually curious as to what you imagine this concept to be.
Good comments, Smokey (January 24, 2012 at 6:04 pm)
I used to participate in the “mainstream debate”, which is argues whether the sensitivity of climate to atmospheric CO2 is high (alarmists) or low (skeptics).
Any numerate person should now realize that the alarmists have lost that debate. Despite increased combustion of fossil fuels, there has been no significant global warming for about a decade, according to satellite data..
It is further notable that ALL the dire predictions of the IPCC and the climate alarmists have failed to materialize. The alarmists have a perfect track record – of being wrong.
In 2002 I co-authored a paper at the request of APEGGA with Dr. Sallie Baliunas, Harvard Astrophysicist, and Dr. Tim Patterson, Carleton Paleoclimatologist, at
http://www.apegga.com/members/Publications/peggs/Web11_02/kyoto_pt.htm
We wrote that article as skeptics of alleged catastrophic humanmade global warming, and I think it is clear that we won that debate (repeat – NO global warming for a decade!).
Reviewing the eight summary points in our 2002 APEGGA paper, it is clear that our predictive track record is infinitely better than that of the IPCC and the global warming alarmist movement.
Some of our predictions did not fully materialize in Canada, because our country did not adopt all the excesses of the Kyoto Protocol, but those countries that did so, particularly the UK and Western Europe, have experienced all these downsides of global warming fervor.
Here are the eight predictions from our 2002 APEGGA paper:
Kyoto has many fatal flaws, any one of which should cause this treaty to be scrapped.
1. Climate science does not support the theory of catastrophic human-made global warming – the alleged warming crisis does not exist.
2. Kyoto focuses primarily on reducing CO2, a relatively harmless gas, and does nothing to control real air pollution like NOx, SO2, and particulates, or serious pollutants in water and soil.
3. Kyoto wastes enormous resources that are urgently needed to solve real environmental and social problems that exist today. For example, the money spent on Kyoto in one year would provide clean drinking water and sanitation for all the people of the developing world in perpetuity.
4. Kyoto will destroy hundreds of thousands of jobs and damage the Canadian economy – the U.S., Canada’s biggest trading partner, will not ratify Kyoto, and developing countries are exempt.
5. Kyoto will actually hurt the global environment – it will cause energy-intensive industries to move to exempted developing countries that do not control even the worst forms of pollution.
6. Kyoto’s CO2 credit trading scheme punishes the most energy efficient countries and rewards the most wasteful. Due to the strange rules of Kyoto, Canada will pay the former Soviet Union billions of dollars per year for CO2 credits.
7. Kyoto will be ineffective – even assuming the overstated pro-Kyoto science is correct, Kyoto will reduce projected warming insignificantly, and it would take as many as 40 such treaties to stop alleged global warming.
8. The ultimate agenda of pro-Kyoto advocates is to eliminate fossil fuels, but this would result in a catastrophic shortfall in global energy supply – the wasteful, inefficient energy solutions proposed by Kyoto advocates simply cannot replace fossil fuels.
**********************************************************************************
“barry says:
January 24, 2012 at 6:14 pm”
My last statistics course in university was 40 years ago so I am rusty. But let me ask you this:
Suppose that on a data set, I find that the slope is -0.001/year for 14 years.
Could I say
A. “It has cooled but it isn’t statistically significant” or
B. “There is a greater than a 50% chance that cooling has taken place according to this data set over this period”
Would you say both A and B are correct or neither are necessarily correct or just one of these statements is correct? Thanks!