
Guest post by Alec Rawls
Here is the puzzle, as noted by Nigel Calder and others: how can BEST insist that a modicum of additional evidence of late 20th century warming should put skepticism of the CO2-warming theory to rest, while at the same time admitting that they never even tried to examine the possible causes of warming?
Elizabeth Muller’s press statement in support of anti-CO2 alarmism is extreme:
Elizabeth Muller, co-founder and Executive Director of Berkeley Earth, said she hopes the Berkeley Earth findings will help “cool the debate over global warming by addressing many of the valid concerns of the skeptics in a clear and rigorous way.” This will be especially important in the run-up to the COP 17 meeting in Durban, South Africa, later this year, where participants will discuss targets for reducing Greenhouse Gas (GHG)emissions for the next commitment period as well as issues such as financing, technology transfer and cooperative action.
She is strongly implying that BEST’s findings not only support the CO2 theory of late 20th century warming, but justify radical worldwide government action to reduce carbon emissions.
Richard Muller’s statement of ignorance on the cause of the observed warming is equally absolute:
What Berkeley Earth has not done is make an independent assessment of how much of the observed warming is due to human actions.
Contradictory, yes, but also explanatory. Muller et al. must be so ignorant of this climate science subject that they are brand-new to that they are not even aware that the leading competing climate theory, where solar-magnetic activity modulates cloud formation, also predicts and explains late 20th warming. All they know is that the CO2 theory predicts warming, prompting them to see evidence of warming as evidence for that theory.
This is the only logical explanation for Muller vs. Muller, and it would also explain why BEST made such a complete hash of the only part of their data that does have any power to discriminate between CO2-warming and solar-warming.
Opposite temperature predictions for quiet-sun era
If late 20th century warming was mostly caused by the industrial release of atmospheric CO2, then warming should be continuing apace, but if 20th century warming was mostly caused by the 80 year grand maximum of solar activity that waned in the 1990’s and ended in 2005, then planetary temperature (as measured by the heat content of the oceans) should have been falling for several years now. In a less smooth way, surface temperatures would also be passing the peak of the Modern Warm period.
Nature is right now conducting an ideal experiment for determining which theory is right, but on this crucial part of the temperature record—what happened when solar activity waned and then dropped into the cellar—BEST’s presentation is remarkably confused. The sample station analysis that they released shows substantially more post-98 cooling than any of the other land records, while their full data set has recent temperatures going up compared to the other records.
Here is a zoom-in on figure 1 from BEST’s “decadal variations” paper. It shows the most recent temperatures for a sub-sample of temperature stations (“[this] Berkeley Earth data were randomly chosen from 30,964 sites that were not used by the other groups”):

Wow, this sub-sample really favors the sun as the primary driver of climate, certainly compared to the NOAA, GISS and Hadley evidence. The BEST temperatures are equal or above the other temperature records throughout the 80’s and 90’s, then drop precipitously below them over the last ten years, as the sun has gone quiet.
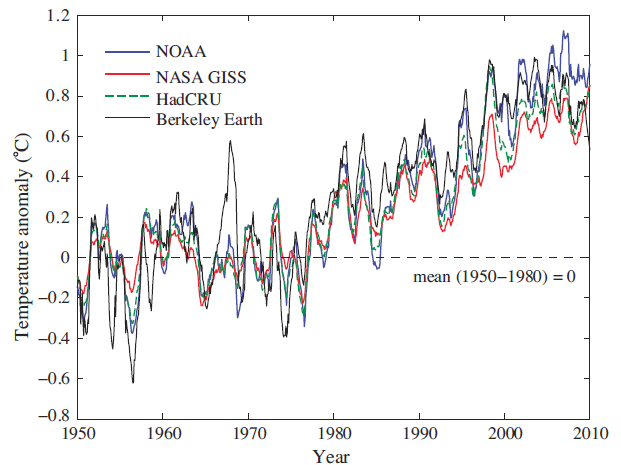
BEST’s full data set tells the opposite story. Here is their 12 month average surface temperature (figure 8 from their “Temperature Averaging Process” paper):

The second part of figure 8 shows the differences. NOAA and GISS both drop off a couple of tenths of a degree relative to BEST after 2000, while Hadley drops off about a half a degree!

Wow, compared to the evidence provided by the other temperature records, BEST’s full sample really favors the CO2 theory over this critical period. Thus on the only part of the temperature record that is probative, BEST displays two strongly contradictory graphs without a word of commentary. That’s a pretty good sign that they are oblivious to the discriminatory power of this part of the record, indicating again that they are not even aware of the GCR-cloud theory and its implications. No wonder they can do such incredibly biased things as calling “the late part of the 20th century,” “the anthropogenic era” (p. 30). Anthropogenic warming is their premise.
BEST evidence is not best evidence
Almost all of the heat capacity of the biosphere is in the oceans. Thus climate change over time means a change in ocean heat content. Land surface temperature is a volatile expression of this global temperature, depending on whether colder or warmer ocean currents are at the surface. That volatility makes surface temperatures an iffy way to track climate change, and today, better evidence is available.
In recent years, ARGO’s automated fleet of temperature sounding devices provides much improved direct measurement of ocean temperature. According to NOAA, data from these floats show ocean heat content for the top 700 meters as close to flat for about 10 years now:

(Bob Tisdale says that NOAA has recently started reporting heat content for the top 2000 meters, but apparently it is still a work in progress, as they don’t display it on their heat content page.)
Ocean heat content can also be measured by sea level, which is determined by the thermal expansion of the oceans, plus net land-ice melt. Here is NOAA’s sea level data, compensated for land-ice melt and variations in salinity. It shows ocean heat content as roughly flat for about the last eight years:

This best evidence indicates that global warming has stopped, which militates against the CO2 theory of late 20th century warming, but the oceans do not show the global cooling that the solar-theory predicts, so it does not clearly favor the cosmic-ray-cloud hypothesis either. The very latest sea level data, however, may finally be telling the tale:

Steve Goddard, September 2011: “The latest sea level numbers are out, and Envisat shows that the two year long decline is continuing, at a rate of 5mm per year.”
That’s actual sea level, not steric sea level. Subtract out the ongoing land-ice melt from our currently warm climate and thermosteric sea level is falling even more rapidly. If cosmic-ray-cloud effects do dominate CO2 effects, we’ll probably have full proof within the next couple of years.
Can BEST actually be unaware of the cosmic-ray-cloud theory, or are they just accepting the CO2-alarmists’ excuses for dismissing solar effects?
Unless Muller is a world-class fruitcake, he can’t have waded into the climate arena without at least being aware of Svensmark’s theory. He must also know that the sun has gone quiet, and his Nobel-physics brain would be able to figure out how this natural experiment provides a test of which theory is right. Yet he might still act as if he is unaware of solar warming theory if he has been convinced by the alarmists’ bogus excuses for why recent warming can’t have been caused by the sun.
Over and over, these folks claim that late 20th century cannot have been caused by the sun because solar activity was not rising over this period. e.g. Rasmus Benestad, 2005:
A further comparison with the monthly sunspot number, cosmic galactic rays and 10.7 cm absolute radio flux since 1950 gives no indication of a systematic trend in the level of solar activity that can explain the most recent global warming.
That reasoning obviously requires an assumption that ocean temperatures had equilibrated to the high level of 20th century solar forcing by 1950. Otherwise the continued high level of solar forcing (the hypothesis under consideration) would cause continued warming until ocean equilibrium was reached. Yet Benestad did not even acknowledge this assumption, never mind make any case for it, and this has been the pattern.
I have written several posts on the alarmists’ excuses for dismissing the solar explanation and how they utterly fail to stand up to scrutiny. But without even going into those details, the more basic point is that the various rationales for dismissing the solar warming hypothesis are theoretical. They are, in effect, part of the CO2 warming theory. Our recently quiet sun offers a test of which theory makes the right prediction. To ignore that test because one already agrees with one of the theories, as BEST seems to be doing, is to put theory over evidence, the opposite of what scientists are supposed to do.
Well, the answer is in this sentence: “He must also know that the sun has gone quiet, and his Nobel-physics brain would be able to figure out how this natural experiment provides a test of which theory is right.”
A Nobel-physics brain does not comprehend experiments or reality. A Nobel-physics brain only comprehends raw mathematics, free of all context and content.
Wasn’t BEST’s original intent just to make the surface stations dataset as clean as possible and leave it to others to use the data? Isn’t it mission-creep to begin speculation before the primary goal is achieved?
Mr. Rawls, you are an uncommonly clear presenter of somewhat complex science. The last paragraph of this article is the best concise statement of the question of global warming AND the best concise statement of the essence of true science I have read in a very long time. Thank you. James J. Hill
http://www.real-science.com/muller-data-proves-skeptic#comments
“Unless Muller is a world-class fruitcake, ……”
I think its too early to rule that out. What is fantastic about BEST is that they’ve simply given us something we’ve already had. A very questionable historical temp record.
But, even Muller’s temp record tells us the same thing the others tell us……
it isn’t warming anymore. And even though the press release says this is proof that the earth is warming, BEST’s own data shows that it isn’t.
http://suyts.wordpress.com/2011/10/28/best-proves-that-the-earth-is-warming/
” He must also know that the sun has gone quiet, and his Nobel-physics brain would be able to figure out how this natural experiment provides a test of which theory is right.”
I respectfully disagree –
doesn’t this only provide a test of which “theory”, or perhaps better “concept” since I don’t believe the CAGW by CO2 idea has reached “theory” level, is more likely to be right while also showing which concept does not appear to match observations?
“…..VALID concerns of the skeptics…..”
It’s a start, I suppose.
Will BEST also issue their support of Gaddafi the way the South Africans did? Maybe that will be part of a quid pro quo for more SA govt. statements in support of climate change NOW actions, or maybe that was pre-arranged as part of the site selection process for the conference.
With what appears to be an ocean cooling cycle in the making is it possible that we will also see a drop in CO2 levels, and if so would we see it globally or would it first show up at certain latitude? If the ocean temp drops 1c what kind of ppm of CO2 is possible?
I really liked using the word “appears” in that sentence I have read it so many times in the last month.
Latitude: Thanks for linking to that detailed plot of the last 10 yrs of the full BEST data. I hadn’t seen that before. Sure doesn’t look like the figure 8 graph from the “analysis” paper that I included in the post. I thought figure 8 was just a more legible version of the full data plot they have on their “Analysis Charts” page, but I guess not.
So their data is actually unambiguously supportive of the solar-warming theory? I’ve got to get out more.
Ever wonder why no international climate meetings are held in winter, other than tropical retreats and southern hemisphere during winter for norther hemisphere? No trend there right…?
Alec Rawls says:
October 28, 2011 at 12:43 pm
Latitude: Thanks for linking to that detailed plot of the last 10 yrs of the full BEST data………..
So their data is actually unambiguously supportive of the solar-warming theory? I’ve got to get out more.
===============================================
Its from WFT….. http://www.woodfortrees.org/plot/best/from:2001.75/plot/best/from:2001.75/trend ……He just added the BEST data as of the 26th. It’s a neat site to go play every once in a while. I’ve got to hand it to him, the way I’m downloading the data, it comes n huge a$$ txt file… and It errors out about 1/2 of the times I open the darn thing, else I would have already done it myself. But, yes, the BEST data tells us everything we’ve already been told. Almost $200,000 of DOE wasted, again.
Thoughtless, deliberate defacement of a perfectly good “fighting kittens” picture. Barbarians.
I also notice (with no study at all) that the 0-700m ocean heat content has gone up a factor of 5 (from 2E22 Joules to 10E22 J) from 1991 to the present, but the NOAA NCEP SST anomaly in 2011 is right on track with the 1991 anomaly. This tells me what I already knew from my Venus/Earth atmospheric temperatures comparison–there is no ocean effect (indeed, no surface effect at all) upon the hydrostatic, equilibrium vertical temperature distribution (in particular, upon the global mean surface temperature). This makes me doubt even the multidecadal ocean oscillations theory of (ocean forcing) “climate” change. It is just the Sun, and only the Sun, because the atmosphere is warmed by absorption of incident solar infrared radiation, not from the surface, as my Venus/Earth comparison clearly shows. Clearly, the Standard Atmosphere rules, and there simply is no climate science worthy of the name.
Jeff D says:
October 28, 2011 at 12:42 pm
is it possible that we will also see a drop in CO2 levels
Not much chance: a drop of 1°C would give a drop of 16 microatm in sea surface CO2 pressure, which gives a steady state with the atmosphere at about 16 ppmv. But as the biosphere acts in opposite way by absorbing less CO2 at lower temperatures, the real drop probably is not more than 8 ppmv/°C (as 800,000 years ice cores show) over longer periods. Thus even a 1°C drop in temperature will halt the increase from 4 ppmv/year human emissions for not more than a few years…
How can any scientist say something like ( Rasmus Benestad, 2005 ):
“A further comparison with the monthly sunspot number, cosmic galactic rays and 10.7 cm absolute radio flux since 1950 gives no indication of a systematic trend in the level of solar activity that can explain the most recent global warming”.
It is like saying that if the milk on the stove warms without me continuously increasing the gas flame I have to look for some mystical explanation. How does such a statement pass peer review? As if I did not know.
Alec Rawls says:
October 28, 2011 at 12:43 pm
I’ve got to get out more.
===============================
….just hang out with us more on Steve’s and James’ blogs………….LOL
James J. Hill says: “Mr. Rawls, you are an uncommonly clear presenter of somewhat complex science. The last paragraph of this article is the best concise statement of the question of global warming AND the best concise statement of the essence of true science I have read in a very long time.”
This and Alec Rawl’s other posts have little basis in science. His hypotheses are based solely on speculation.
I really hate politics but looks like Muller got what he wanted or might be getting. I wish this post could be read as the counter.
http://www.talkradionews.com/news/2011/10/28/house-dems-call-for-hearing-on-climate-change-science.html
Check this out.
Just recently, I said that it sure looks like Muller is not and never was a skeptic, a quote from the first part of the above article:
”
WaPo’s “skeptic” actually has backed global warming for 30 years
October 22, 2011 by Don Surber
The first rule of journalism is “If your mother says she loves you, check it out.” Brad Plumer of the Washington Post overlooked that rule in reporting that an alleged global warming skeptic is now a convert — because the “skeptic” in question — physicist Richard Muller of Berkeley — embraced the theory of man-made global warming 30 years ago. An online search easily disproved his claim of skepticism. He co-authored a book, “Physics For Future Presidents,” that explained climate change among other things. Now he has re-branded himself a former skeptic — the better to sell global warming.”
Note the phrase “the better to sell global warming”, check check this out and you will see GreenGov, a company to make money from global warming, a clear conflict of interest.
The only good news, he is sort of lukewarm in the warming camp, he does not appear to embrace the idea that we should impoverish ourselves to stop the warming. Of course, that fact that this can result in more money for his company doesn’t hurt either. Also, while he may not be a fanatic, those reporting about him are, and will do everything they can to blow up anything that promotes the warming agenda and tears down the “skeptics”. He is also surrounded by those who are fanatics or just along for the ride (AGW as a promoter of socialism, meaning they get to be in charge), and he will be subjected to enormous peer pressure and manipulation.
polistra says:
October 28, 2011 at 11:30 am
“A Nobel-physics brain does not comprehend experiments or reality. A Nobel-physics brain only comprehends raw mathematics, free of all context and content.”
DOE Secretary Steven “White-Paint” Chu is an excellent example.
As some of Almor Goretry’s disciples have stated: global warming is happening but is being concealed by other factors and , therefore, does not appear in the historical temperature record – the potential awaiting the kinetic.
Global warming, climate change and climate chaos are not synonyms for anthropogenic Carbon Dioxide
Dr. Tim Ball published a series of articles on the Canada Free Press that recounts the history of IPCC’s efforts to promote the adverse effects of human caused Carbon Dioxide.
From Part 4: How UN structures were designed to prove human CO2 was causing global warming
By Dr. Tim Ball Wednesday, April 30, 2008
Science creates theories based on assumptions that are then tested by other scientists performing as skeptics. The structure and mandate of the IPCC was in direct contradiction to this scientific method. They set out to prove the theory rather than disprove it. Maurice Strong and his UN committees’ objectives, especially the IPCC made sure the focus was on human caused change and CO2 as the particular culprit. They’d already biased the research by using a very narrow definition of climate change in article 1 of the United Nations Framework Convention on Climate Change (UNFCCC), a treaty produced at that infamous “Earth Summit” in Rio in 1992. Climate Change was defined as “a change of climate which is attributed directly or indirectly to human activity that alters the composition of the global atmosphere and which is in addition to natural climate variability observed over considerable time periods. This makes the human impact the primary purpose of the research. The problem is you cannot determine that unless you know the amount and cause of natural climate change.
From Part 5: Wreaking Havoc on Global Economies
By Dr. Tim Ball Monday, May 5, 2008
How did the IPCC maintain control and convince many, including political leaders they were right and were the authority? Beyond using UN agencies as vehicles they had the challenge of running an apparently open process while keeping total control. This appeared to take several forms.
1. Controlling who participated and who were the lead authors, especially of critical chapters. As Lindzen explains, “IPCC’s emphasis, however, isn’t on getting qualified scientists, but on getting representatives from over 100 countries, said Lindzen. The truth is only a handful of countries do quality climate research. Most of the so-called experts served merely to pad the numbers.”
2. Publishing the political document, the Summary for Policymakers (SPM) before the Technical (Science) Report of Working Group I was issued. Making sure the Technical Report matched the SPM. As Lindzen said, “The IPCC clearly uses the Summary for Policymakers to misrepresent what is in the report, said Lindzen.”
3. It’s difficult to describe scientific information for an essentially non-scientific audience through the media; what one blogger describes as the “Math-Free Zone of Journalism”. Columnist James Kilpatrick says “People who write for a living should never be left alone with mathematics. They are almost bound to mess up.” They are less likely to with the terms used by the IPCC, but it is easier to dramatize. Using non-mathematic terminology in the SPM, exemplified by the labels set out in a table in the third report, such as; Very unlikely (1–10 %) Likely (66–90 %) Very likely (90–99 % ). The percentages are not used in the Technical Report. As one study says, “How the assessment frames the information is determined by the choices and goals of the users.” (link)
4. Including and highlighting studies that appeared to identify a “human signal” while excluding others.
5. Focusing on negative impacts of warming when there are positive effects.
Here is Lindzen’s summary of the IPCC process. “It uses summaries to misrepresent what scientists say; uses language that means different things to scientists and laymen; exploits public ignorance over quantitative matters; exploits what scientists can agree on while ignoring disagreements to support the global warming agenda; and exaggerates scientific accuracy and certainty and the authority of undistinguished scientists.”
From Part 7: The Unholy Alliance that manufactured Global Warming
By Dr. Tim Ball Wednesday, May 21, 2008
Contrary to popular belief politicians do listen. The problem is they usually hear if they think there is a consensus, whether right or wrong, or if the issue can garner votes. Both these situations existed in the claims of global warming. In addition, most politicians don’t understand climate science and were forced to rely on the bureaucrats.
The most notorious was the Hockey Stick (HS) in the IPCC 2001 Third Assessment Report (TAR). Despite its destruction by McIntyre and McKitrick confirmed by the Wegman committee reporting to the National Academy of Sciences, Michael Mann and his associates continue to claim their work was legitimate. Its omission from the 2007 IPCC Report told the real story.
While the Hockey Stick was exposed and rejected it drew attention away from a more insidious piece of ‘human signal’ evidence in the 2001 IPCC (TAR). This was the claim by P.D. Jones, Director of the Climatic Research Unit at the University of East Anglia, that the global average annual temperature increased 0.6°C ± 0.2°C in some 130 years. It was claimed the increase was beyond any natural increase with the strong implication it was caused by humans. The data is simply not adequate to make this conclusion. The first problem is the huge error factor of ± 0.2°C or 66%, which essentially makes the number meaningless. Imagine a political poll saying it was accurate plus or minus 33%. Besides, there are so many problems with the global data many consider it impossible to calculate the global temperature. Some of the problems explain why.
Bob writes:
Is it speculation that the CO2 theory of 20th century warming and the solar theory have opposite predictions for what should happen when the sun goes quiet? It is speculation to note that the sun has dropped into a period of very low activity?
Not that there is anything wrong with speculation (or theory), which generally does come before testing by evidence. But just what speculation is Bob talking about?
Perhaps my theory of how Muller manages to square CO2-alarmism with his admission that he never examined the possible causes of warming? Yes, that’s true. I am speculating that he is ignorant about the cosmic-ray-cloud theory, but this is not actually a scientific question, so perhaps I can be forgiven for simply giving a logical answer, instead of a scientific one.
I wonder what a Tisdale-kitten mash-up would look like?
At about the time Rasmus was trying to discredit the solar activity theory, James Hansen was claiming that Global Warming was “locked in for the next 50 years”. Why? Because even if CO2 levels could be stabilised immediately, the thermal lag from the oceans would ensure that the temperature continued to slowly increase.
You’d think they could have swapped notes…
I had HOPED that BEST might go back to the base data and make sure it was not subject to distortions due to urbanisation.
We know the UHI effect exists.
We know that many stations quite probably have been affected by ever increasing urbanisation, NOT just at the station site, but also in adjacent areas that may affect the temperature at that site..
We know that with the loss of a substantial number of remote rural stations, there is an ever-increasing dependance on the stations in urban areas, thus possibly skewing the data even further
.
But does BEST actually go and have a look…… NOPE !!!
Just relies on the same old data source.. That is NOT research. !!
ALWAYS CHECK YOUR SOURCE DATA FIRST !!
Back to square one, BEST !!
It is irrelevant if a hypothesis is based on speculation, in fact, all hypothesis’s are based on speculation, that is why they are still only called a hypothesis. After you make the hypothesis, you test it, that is the scientific method. We are now testing it, AGW theory says that as CO2 goes up, it will get warmer, solar theory says that as the sun gets quiet, it will get cooler. It is getting cooler according to the BEST data itself.
Your statement “little basis in science” actually means “little basis in settled science”, or science by consensus. Science is not done by consensus, it is done by making a theory, finding a way to make that theory be testable, thus making what is known as a hypothesis, which is a testable theory, testable speculation, and then testing it to see if it stays in the realm of speculation (fails the test) or moves on to the realm of actual tested science fact (passes the test).
Example, my name is Galileo. I have a speculation, I speculate that the earth goes around the sun. The settled science of the day is that the sun goes around the earth, as do the planets, riding on crystal rings. I make it a hypothesis by making one of those newfangled telescope things and actually looking, gathering data, doing an actual observation. Or, we could do it the Tisdale, way, convene an inquisition, accuse this Galileo fellow of “speculation” and not science. Question, in the end, who was proven right? Question, now, which method will you use, will you continue to use the pre scientific method way of “appeal to authority”, or the way of the scientific method, where you speculate, and then find a way to test that speculation? Are you just going to believe what “they” tell you, or are you going to dare to think new thoughts and then dare to actually observe to see if they are true? Are you going to stay a nice little sheep and go right along with the herd to be fleeced, or are you going to dare to actually think for yourself?
I must assume that either you do not understand the scientific method, and what a hypothesis is, or that you do not care, you will tear down anyone who disagrees with what you wish to believe.
Resourceguy: I think there may have been one actually, somewhere in Denmark a couple of years ago. I think the plan was to demonstrate unseasonable warmth in high latitudes, as well as look at some pretty wind factories (er, I mean farms, of course), but events somewhat conspired against them.
They certainly won’t be making that mistake again though, hence going to Cancun and partying in the tropical heat of that part of the worl… oh, that didn’t quite turn out that way either, did it?
Still sceptical of the BEST project, with it showing a large difference compared with SST’s and also makes a very strong El Nino during 1997/98 look just almost ordinary. Muller so far as I have been aware has never been a sceptic, just spin to try and a fashion a turnaround breakthrough. I see with some media and political sources this is working so far. IMO an alarmist has been involved in another global data set and achieved the results he wanted too. (not sure what’s with the sharpe spike down at the end?)
http://www.woodfortrees.org/plot/best/from:1997.25/normalise/plot/best/from:1997.25/normalise/trend/plot/hadsst2gl/from:1997.25/normalise/plot/hadsst2gl/from:1997.25/normalise/trend
The trend through the last decade now shows a general slight increase with greater moderation of El Nino and La Nina events. I wondering if less locations strongly affected by El Nino and La NIna have been used?
http://www.woodfortrees.org/plot/best/from:2001/normalise/plot/best/from:2001/normalise/trend/plot/hadsst2gl/from:2001/normalise/plot/hadsst2gl/from:2001/normalise/trend
In November 1968 I sat examinations in Brisbane. The temperature hit ~ 104 F or 40 + C – we weren’t fully metric yet. Today I sit viewing weeks of cloudy skies – unusual for such prolonged periods – and temperatures that are barely getting into the mid twenties.
A few years later we had a major major La Nina event where widespread flooding happened – the 1974 floods in Brisbane were a bit higher than 2011 but a flood control dam probably caused that.
Seems it could be cyclical – 2009 was pretty warm here followed by cool wet rainy periods. The cool wet weather commenced in October 2010 when we had quite heavy rain early and it didn’t cease until April 2011. Didn’t even use our air conditioners the whole year.
1977 was quite dry here so we’ll see what happens in a few years.
Kind of seems there is a pattern.
Well, they did, sort of…
Basically, they made a lazy, token effort. Thye used statellite data of lights to see what places could be called urban, however, they have not actually done the real work, which would be to actually examine and test these stations to see if they were accurate. They have Anthony’s data which would help them do just that, they pretty much ignored it. Aquiring his data appears to heve been only an excuse to make it look like they were factoring in the UHI problem, they used the same lazy method to tell if a site was urban as the other temperature records. The satellite method is good if you want to stay in your nice comfortable bureaucrats office and not ever actually go out and do any real work, make any actual observations.
You will note, however, that even using this lazy method, their actual data shows that for the last 10 years (especially this year), the temperature has been dropping. Since this is happening at a time when CO2 is going up yet the sun is quite, this supports the idea that it is the sun, not CO2.
20th century warming was mostly caused by the 80 year grand maximum of solar activity that waned in the 1990′s
There is strong evidence that there was no Grand Maximum during the 20th century, see e.g.
http://www.leif.org/research/How%20Well%20Do%20We%20Know%20the%20Sunspot%20Number.pdf
One thing I came across when writing this post is just how large a financial stake Muller has in eco-money. It seems that his Muller & Associates company mostly consults with goverment entities. At least, that is the indication on his Our Team page:
Country/region/city would seem to mean government contracting where green spending hand over fist. As for the “or business,” even the Muller & Associates list of private industry projects is more than half green-tech.
Overall, it looks like more than half Muller’s business depends on anti-CO2 alarmism, so that could be playing a role.
Jeff D says:
October 28, 2011 at 12:42 pm
With what appears to be an ocean cooling cycle in the making is it possible that we will also see a drop in CO2 levels…..
_____________________________
I very very much doubt it because the CO2 record is just as “messaged” as the temperature record. All the way from the cherry picked historical numbers to the carefully selected test results from Mauna Loa Observatory as shown in step four below of the lab’s practice.
The assumption is MADE that the CO2 is steady and fits their curve, therefore “outliers are rejected !!!!!! (I would FIRE any lab tech that made this ASSumption)
4.In keeping with the requirement that CO2 in background air should be steady, we apply a general “outlier rejection” step, in which we fit a curve to the preliminary daily means for each day calculated from the hours surviving step 1 and 2, and not including times with upslope winds. All hourly averages that are further than two standard deviations, calculated for every day, away from the fitted curve (“outliers”) are rejected. This step is iterated until no more rejections occur.
http://www.esrl.noaa.gov/gmd/ccgg/about/co2_measurements.html
If you want the other side of the story so you can weigh both sides check out this web site run by a couple of scientists. http://www.co2web.info/
This particular pdf looking at the dogma and politics behind the 70 years of CO2 measurement as well as the science. It is a very interesting read. http://www.co2web.info/ESEF3VO2.pdf
”At the Mauna Loa Observatory the measurements were taken with a new infra-red (IR) absorbing instrumental method, never validated versus the accurate wet chemical techniques. Critique has also been directed to the analytical methodology and sampling error problems (Jaworowski et al., 1992 a; and Segalstad, 1996, for further references), and the fact that the results of the measurements were “edited” (Bacastow et al., 1985); large portions of raw data were rejected, leaving just a small fraction of the raw data subjected to averaging techniques (Pales & Keeling, 1965).
The acknowledgement in the paper by Pales & Keeling (1965) describes how the Mauna Loa CO2 monitoring program started: “The Scripps program to monitor CO2 in the atmosphere and oceans was conceived and initiated by Dr. Roger Revelle who was director of the Scripps Institution of Oceanography while the present work was in progress. Revelle foresaw the geochemical implications of the rise in atmospheric CO2 resulting from fossil fuel combustion, and he sought means to ensure that this ‘large scale geophysical experiment’, as he termed it, would be adequately documented as it occurred. During all stages of the present work Revelle was mentor, consultant, antagonist. He shared with us his broad knowledge of earth science and appreciation for the oceans and atmosphere as they really exist, and he inspired us to keep in sight the objectives which he had originally persuaded us to accept…..
Is this the description of true, unbiased research? “ http://www.co2web.info/ESEF3VO2.pdf
What plums has Muller given us, despite himself?
(1) the significant, anomalously low record of the longstanding weather stations – Michael Palmer’s paper
(2) the (unnoticed-by-Muller) significant difference between the low final temperature of the “sample” of stations unused by others, and the high final total of all stations
(3) the revelation of conflict-of-interests, and general upsurge of skeptical interest, in the wake of his faux pas of courting the media before peer-review
(4) the ire of both sides, which has nicely cracked open the “consensus” wallpaper.
The stations giving those anomalously low readings need to be checked individually for quality and consistency. It is very revealing to compare local stations, this demonstrates the reliability of individual stations and the presence of step changes or UHI divergences. I compared records around Salehard, Yamal. But this graph of Salehard’s seasonal anomalies suggests strongly that after 2003, Salehard’s record at least is seriously compromised by winter UHI.
I copied the study objectives from the BEST webpage. It is always good to go back and check to see if you accomplished what you were supposed to accomplish. Nothing in the objectives about parsing the causes. I see their 2 page summary contains some unsupported observations and some unfortunate phrasing. I don’t see how that added anything since it appeared to be entirely gratuitous.
The work has not yet been peer reviewed or “formally” published. The process they are following appear to be perhaps a climate science version of beta testing. If so, this might exemplify a new approach to climate research.
They might have handled the “release” differently. The media does not write dispassionately. Spin and hype is their stock in trade. Sso if beta testing is being initiated, it is not the time for spin.
It looks to me like they have, for the most part, accomplished their objectives but I could be wrong. I look forward to an evaluation by Steve McIntyre and others over the next few weeks..
Objectives
The Berkeley Earth Surface Temperature project has the following objectives:
1 To merge existing surface station temperature data sets into a new comprehensive raw data set with a common format that could be used for weather and climate research
2 To review existing temperature processing algorithms for averaging, homogenization, and error analysis to understand both their advantages and their limitations
3 To develop new approaches and alternative statistical methods that may be able to effectively remove some of the limitations present in existing algorithms
4 To create and publish a new global surface temperature record and associated uncertainty analysis
5 To provide an open platform for further analysis by publishing our complete data and software code as well as tools to aid both professional and amateur exploration of the data
Legatus says: October 28, 2011 at 2:34 pm
Legatus, I also disagree with Bob here, but I respect his views: he is a damn good scientist, and holds his own as a skeptic exceedingly well against consensus tosh in his sphere (oceans). And Alec Rawls doesn’t seem too phased either. Go easy, friend.
Legatus says regarding my earlier comment: “Your statement ‘little basis in science’ actually means ‘little basis in settled science’, or science by consensus.”
I wrote precisely what I meant. The “technical” portions of his posts are pure conjecture on his part.
Interesting as an outsider looking in on the USA, there is obviously divides developing in the CAGW thrust that has dominated the Climate Change debate, and signs that C02 may well slip off the scene as the driver of temperature, due to intense scrutiny of the significance of the BEST temperature data and Solar Cloud experiments at CERN.
What we need to be aware of is any attempt to divide the sceptical scientists away from the science or divert into side issues or any attempt to elevate one sceptical scientific group’s theory over another for whatever reason. Discussion great, argument and division No!
On Judith Curry’s site for some “unknown reason” the hot topic of religion is now under discussion and already there is division as sceptic engages with sceptic.
http://judithcurry.com/2011/10/28/is-there-any-good-news-for-the-environment-among-evangelicals/#more-5505.
The question I pose, is who or what group/team might benefit from this diversion or attempt to introduce side issues ?. Especially ones that passionately ignite and engage what otherwise has been a reasonably cohesive and calm scientific expose of the worst of the groupthink that gave rise to early claims of CAGW consensus, a claim we suspected to be false, and has proven to be false.
Do not fall for diversion and division if you want to see reform to climate science, the IPCC, or the political scene – just my though as just like Anthony was trusting and ethical in his dealing with BEST, we need to be alert to tactical manipulation, and be focussed on working with each other, putting aside any exploitable side issues and just concentrate on achieving the basic reforms that will prevent manipulation of scientist’s and science. This is a critical time as i see it, if we want to achieve that objective. Sorry if this is not strictly on topic.
I hope this post is acceptable on this thread, if not, I would ask the Moderators to bring this to the attention of Anthony.
I had noticed earlier I had used a period nearly 11 years long not quite a decade. So when I change this to include a decade period as close as possible a slight cooling with BEST is detected.
http://www.woodfortrees.org/plot/best/from:2001.8/normalise/plot/best/from:2001.8/normalise/trend/plot/rss/from:2001.8/normalise/plot/rss/from:2001.8/normalise/trend/plot/uah/from:2001.8/normalise/plot/uah/from:2001.8/normalise/trend
But, to me the sharpe trend down towards the end of the data set looks like a error to me, so when this is corrected may become slightly positive again. This is due to it couldn’t agree less than other satellite data sets. (there is a huge difference between them)
When compared with satellites (which are easily the best data sets) there is a big diaspointment with the qualitity of BEST. Satellites cover all the ocean and land extremely well so should respond to El Nino’s and La NInas very well. (which they do) Look how BEST compares with satellite data and to be honest looks very poor. Hadley’s global data set for ground instrument based, still easily remains king, nothing to worry about from BEST.
http://www.woodfortrees.org/plot/best/from:1997.25/normalise/plot/best/from:1997.25/normalise/trend/plot/rss/from:1997.25/normalise/plot/rss/from:1997.25/normalise/trend/plot/uah/from:1997.25/normalise/plot/uah/from:1997.25/normalise/trend
Harry Dale Huffman says: October 28, 2011 at 1:06 pm
…It is just the Sun, and only the Sun, because the atmosphere is warmed by absorption of incident solar infrared radiation, not from the surface, as my Venus/Earth comparison clearly shows. Clearly, the Standard Atmosphere rules, and there simply is no climate science worthy of the name.
Very interesting. You list a lot of figures there that fit. Certainly when I researched Venus, I found evidence of… duh… corruption and cover-ups in astrophysics too, probably about the time Hansen was there. Does Mars also fit the correspondence you demonstrate between atmospheric pressure and temperature?
Now just supposing you are right, and temperature depends on pressure and distance from the Sun, in atmospheres below – what? – ionosphere? Suppose that Earth had a much denser atmosphere in the past. It would have been warm enough to offset a cooler sun, and it would have been much easier for huge animals to move around, just like whales in the sea today.
I have to agree with Bob Tisdale.
The earth has had a decade or more of non-warming. The earth has also had changes in ocean oscillations. Frank Lansner has done preliminary work showing coastal temps follow ocean surface temps with his “Rural Unadjusted Temperature Index” (See: http://joannenova.com.au/2011/10/messages-from-the-global-raw-rural-data-warnings-gotchas-and-tree-ring-divergence-explained/ )
There has also been measurements that show changes in albedo/cloud cover such as the earthshine project and others. We have also seen some changes in the earth’s Magnetic field and seismic activity
Most here will agree with at least that. Where things get dicey is trying to figure out WHAT causes ocean oscillations and changes in cloud cover.
Some believe changes in the sun have a major impact some don’t. At this point I think all that can be said is the climate changes in a cyclical pattern (based on history) and we have a bunch of pieces of the puzzle but not enough real understanding to stand firm behind any one “Theory” At this point, with climate science in its infancy, we should be GATHERING DATA and not making idiotic statements to the Media “That the science is settled” or that “CO2 is the control knob”
Are these two related? How are things going in that household?
“Berkeley Earth Surface Temperatures (BEST)”
Perhaps it should have been named Berkeley Land Surface Temperatures.
What are they going to call their project when they incorporate the ocean (and sea? [is the artic floating ice land or ocean?]) temperatures; Berkeley Universe Surface Temperatures (BUST)?.
This best evidence indicates that global warming has stopped, which militates against the CO2 theory of late 20th century warmin
———–
And post 1980 the temperature record plateaued for a while as well. So in 1990 you could have said exactly the same thing using the same reasoning. Except the temperature then started to rise again.
And just after the 1998 el niño spike you were all running around claiming that cooling was just around the corner. Except the temperature started to rise again.
It seems you guys just can’t learn from your mistakes.
The lesson is really really simple. If there is a trend with a bunch of random variation superimposed on it, judging if the trend has reversed should be done with care.
One way to do this is to eyeball the amount of past random variation and then see if the latest change exceeds that by a factor of 2.
The latest end blip on the temperature graph is not any larger than the 1980 squiggly. So sorry guys you will have to wait another 10 years to see if the end blip is a REAL down trend.
At the moment it’s just Jiminy Cricket philosophy.
Mr. Rawls,
The “best” news cycle is an uninteresting & inconsequential sideshow. And it matters not what the results of cern’s “cloud” experiment will be.
EOP (Earth Orientation Parameters) are the arbiters of climate disputes and they’ve already spoken. What they’ve said to those listening with non-assumptive carefully-tuned ears:
Neutron count rates (which some interpret as cosmic ray flux) are modulated by circulation [ http://wattsupwiththat.com/2011/10/15/shifting-sun-earth-moon-harmonies-beats-biases/#comment-769231 ].
Discussion of clouds divorced from cognizance of circulatory regimes is inadvisable. Perhaps you’ll be receptive to Piers Corbyn’s caution:
“Jet stream shifts are the stuff of Climate Change and Cosmic Rays are nothing to do with them” http://sc25.com/?id=308
Beware confounding.
Climate politics are utterly boring; nature, on the other hand is quite the opposite.
Time travels in only one direction, but spatial gradients can turn in time. The signature of asymmetric driver-wheel aliasing by driven wheels, no matter the size of the driven wheels, will NECESSARILY be a function of driver-wheel acceleration/deceleration. THIS is the marker of the WHOLE system – the forest – which should not be confused with its spatially modulated (via relief) “interannual” trees.
Sun, Earth, Moon Harmony, Beat, & Bias Changes:
http://wattsupwiththat.files.wordpress.com/2011/10/vaughn-sun-earth-moon-harmonies-beats-biases.pdf
Regards.
Gail Combs says:
October 28, 2011 at 3:10 pm
Gail, we can start another round of discussion about the CO2 measurements, historical and current, but what Jaworowski/Segalstad and the late Ernst Beck wrote simply doesn’t hold. Humans add twice the amount of CO2 measured as increase in the atmosphere. The latter is measured not only at Mauna Loa, but at about 70 “background” places, ships and airplanes. See:
http://www.esrl.noaa.gov/gmd/ccgg/iadv/
That is by different persons, different labs and different organisations of different countries. All show the same CO2 levels within a few ppmv and the same trend. Outliers which are clearly influenced by volcanic vents (Mauna Loa) or mechanical problems (South Pole) are rightfully discarded, as we are interested in background CO2, not in local CO2 emissions.
Besides that, how can one validate a new measuring device, accurate to +/- 0.1 ppmv with wet chemical methods accurate to +/- 10 ppmv? Keeling therefore made his own calibrating device, accurate to 1:40,000, which was in use until recently at Scripps.
And it makes no difference for the average or the trend over a year beyond 0.1 ppmv if you look only at the “cleaned” data or all data, including the outliers. See the difference between raw and selected data for Mauna Loa and the South Pole for 2008:
http://www.ferdinand-engelbeen.be/klimaat/klim_img/co2_mlo_spo_raw_select_2008.jpg
One can discuss a lot about the (lack of) effect of CO2 on climate, but the discussion about the origin of the increase of CO2 in the atmosphere doesn’t make any sense anymore: the human origin fits all observations, including the material balance. Any alternative explanation conflicts with one or more observations. The oceans are not the source (13C/12C ratio too high, increased carbon measured, the oceans are net sinks for CO2) and the biosphere is not the source (more oxygen is produced by the biosphere than used, thus the biosphere is a net sink for CO2, the “greening earth”). All other sources are too small or too slow or have the wrong 13C/12C “fingerprint”…
LazyTeenager says:
October 28, 2011 at 4:04 pm
Cloud albedo wasn’t doing this in 1990 and from including the El Nino 1997/98 global datasets show either very slight cooling or very slight warming. (overall together show no trend ie the debate about the non warming period)
http://img854.imageshack.us/img854/5246/globaltempvglobalcloudb.png
Bob Tisdale.
Agreed.
Laegato “Thye used statellite data of lights to see what places could be called urban, however, they have not actually done the real work, which would be to actually examine and test these stations to see if they were accurate.’
What they really need to do is to look at the history of each station and its surrounding area. Unless they have satellite images from 40-50 years ago, then looking at satellite images now is a pointless exercise.. They need to know what the CHANGES have been at EACH STATION , and its surrounding area, over that period and try to determine how they might have affected the temperature reading. Until they do that, using station data is a pointless exercise,
I suspect that a very large proportion of the rise in the so-called “Global Average Temperature” during the 1976 – 1998 period is to do with the affect of increased urbanisation density in many areas, and the loss of many remote rural station, thus placing a much larger weighting on the encroached stations.
Untill someone has done the work to prove otherwise, which I doubt will ever happen because it is not in the interests of the AGW powers to so, then as far as I’m concerned they have not proven that the Earth did actually warm up during that period.
My ‘conjecture’ based on observations is that the solar effect is not via cosmic rays but via solar induced latitudinal shifts in the climate zones which changes jet stream patterns, air mass boundaries and global cloud quantities in order to affect the amount of solar energy getting into the oceans.
Resourceguy says:
October 28, 2011 at 12:45 pm
Ever wonder why no international climate meetings are held in winter, other than tropical retreats and southern hemisphere during winter for norther hemisphere? No trend there right…?
———–
As they keep on telling and telling you: correlation is not causation.
These meeting times are often dictated by the academic year across international boundaries. So if the school holidays in the USA are in winter then that is the time when activities are not compulsory and people can go to conferences.
Cheap on-campus accommodation also becomes available during college holidays.
So sorry, your theory is wrong. And one more gratuitous insult bites the hand that fed it.
LazyTeenager says:
October 28, 2011 at 4:04 pm
…….”So sorry guys you will have to wait another 10 years to see if the end blip is a REAL down trend.”
=======
Maybe so.
But in the mean time, the windmills keep sprouting.
Driven by guilt, paid for by misinformed taxpayers.
Benefiting no one, except politicians and their corporate sponsors.
There are way better ways to waste money, other than erecting monuments that proclaim ones foolishness.
LazyTeenager says:
October 28, 2011 at 4:04 pm
And post 1980 the temperature record plateaued for a while as well. So in 1990 you could have said exactly the same thing using the same reasoning. Except the temperature then started to rise again.
===================================================================
The 80s blip, and also the this current plateau, falsifies the CO2 being the driver of the climate hypothesis. We’ve increased CO2 by 40 ppm and nothing…………
Jeff D says:
October 28, 2011 at 12:42 pm
With what appears to be an ocean cooling cycle in the making is it possible that we will also see a drop in CO2 levels, and if so would we see it globally or would it first show up at certain latitude? If the ocean temp drops 1c what kind of ppm of CO2 is possible?
———-
Unlikely. At best a slight reduction in the upward trend.
We know how much CO2 we are producing. Fuels are taxed as royalties, and all the way along the supply chain and the numbers also appear in company reports.
We know the yearly increment in the atmosphere is about half of what we produce.
The difference has to go somewhere and that somewhere is the oceans, with a small proportion going into extra plant coverage.
So altogether the oceans are doing net absorption of CO2 and are not fizzing it out.
Even if the temperature drops were very severe it’s going to take a long time for actual CO2 reductions to occur. Remember when solar insolation changes are the actual driving force for temperature changes, the CO2 response lags by 800 years, as shown by the ice cores.
Our recently quiet sun offers a test of which theory makes the right prediction.
———-
Does that mean that if the next 1-5 years see the warming trend continue and the rise in sea levels trend continue, that you will agree that you are wrong and that climate scientists are right?
Or will you continue with your position and simply make excuses.
I have this expectation that today random downward blips are being called a real trend, but if tomorrow we see a random upward blip you will changed your tune and claim it’s just random variation. Please prove me wrong.
LazyTeenager says:
“Does that mean that if the… rise in sea levels trend continue…”
Don’t you even read the articles before giving your opinion? This is posted in the article.
It’s been argued here many times , on the basis of ice-core measurements, that CO2 increases lag temperature by some 800 years. So I am wondering why some are saying that the “quiet” sun will cause CO2 levels to decline “now”.
Smokey says:
October 28, 2011 at 5:54 pm
LazyTeenager says:
“Does that mean that if the… rise in sea levels trend continue…”
Don’t you even read the articles before giving your opinion? This is posted in the article.
Uh, Smokey, it’s “Lazy” Teenager.
LOL
For what it is worth Connecticut USA is expecting a possible record breaking amount of “Global Warming” (about 4 to 8″ in Goshen) http://classic.wunderground.com/cgi-bin/findweather/getForecast?query=goshen%20ct&wuSelect=WEATHER
Tolland (I was there a month ago) could get a foot.
“Matt G says:
October 28, 2011 at 3:49 pm
So when I change this to include a decade period as close as possible a slight cooling with BEST is detected.
But, to me the sharp trend down towards the end of the data set looks like a error ”
Regarding the first point, it is my understanding that the BEST data only go to May, 2010, and your graph seems to confirm this. So you only have about 8.5 years of BEST versus 10 for the other sets.
As for your second point, from a different post:
“Bill Illis says:
October 22, 2011 at 9:37 am
(It also looks like BEST has an error in their database for April, 2010 which should be +1.035C rather than -1.035C – it is such an outlier compared to the trend and to other data sets – that means all their moving averages have to recalculated as well).”
Not if 2012 breaks decisively lower than 2008–which I think may well happen.
Alec Rawls says: “Is it speculation that the CO2 theory of 20th century warming and the solar theory have opposite predictions for what should happen when the sun goes quiet? It is speculation to note that the sun has dropped into a period of very low activity?” And you continued, “Not that there is anything wrong with speculation (or theory), which generally does come before testing by evidence. But just what speculation is Bob talking about?”
I’m not sure why you’re introducing CO2 into the discussion, Alec, unless you’re trying to insinuate that I’m an AGW proponent. Recall, however, that I’ve explained 70 to 80% of the rise in Global Surface Temperatures from 1982 to present using natural variables in a couple of posts. Here’s one:
http://bobtisdale.wordpress.com/2011/01/28/removing-the-effects-of-natural-variables-multiple-linear-regression-based-or-%e2%80%9ceyeballed%e2%80%9d-scaling-factors/
The topic at hand is your assumption that the “the sun as the primary driver of climate”; that is, that the rise in global surface temperature during the 20th Century can be explained by the increase in solar activity to an “80 year grand maximum” and the recent flattening of that temperature can be explained by “the sun has gone quiet.” So let’s take a look at some data. You know me, I like data, and I like to see explanations based on data.
So here’s my proposal: I’ll prepare graphs based on readily available data. And you explain. I’ll describe my initial scaling, and I’ll be happy to change the scaling as long as you justify any changes you want. If you’d like me to introduce another dataset, such as cloud amount or cloud cover for example, I can do that as long as it’s readily available—from KNMI Climate Explorer for example:
http://climexp.knmi.nl/selectfield_obs.cgi?someone@somewhere
If it’s not available through KNMI, simply provide a link to the data. But the data has to be in an easy-to-use format so that anyone following this discussion can reproduce the graphs. And of course, I could change the filtering to a 133-month running-average to smooth out the solar cycle variations. The offshoot of this, Alec, is that you’ll have some graphs for a future post.
The following is a comparison graph of HADCRUT Global Land plus Sea Surface Temperature anomalies and scaled sunspot numbers from January 1900 to September 2011. The data has been smoothed with a 13-month filter to reduce the seasonal and weather noise. The sunspot scaling is based on an assumed average 0.1% variation in total solar irradiance from min to max for solar cycles 21 through 23, which equates as Leif Svalgaard often calculates…
http://wattsupwiththat.com/2009/05/01/australian-antarctic-division-can-solar-variability-influence-climate/#comment-124913
… to a change in global surface temperature of about 0.07 deg C. So this is our starting point:
http://i43.tinypic.com/15dnp5.jpg
Personally, I can’t see how solar variations could have caused the rise and then flattening in global surface temperatures that you claim. I’ve seen papers that have determined the variation on global temperature for those solar cycles was in the range of 0.2 deg C, yet I don’t think that would be enough to help.
Again, this is only a starting point. I’ll check back tomorrow morning to see what changes you’d like. I’m in the middle of writing a post on the hindcasts of the climate model used by Meehl et al (2011) and Stevenson et al (2011), the NCAR CCSM4 CMIP5 simulations.
(Bob Tisdale says that NOAA has recently started reporting heat content for the top 2000 meters, but apparently it is still a work in progress, as they don’t display it on their heat content page.)
If you download the Global Marine Alta from Argo’s website
ftp://kakapo.ucsd.edu/pub/argo/Global_Marine_Argo_Atlas/Global_Marine_Argo_Atlas_setup.exe
It will install an icon on your desktop you can run, which gives a very good display of argo data, including an ocean profile and time series down to 2000 dbar, which I take to be 200 bar of 30×200 feet = 6000 feet or 2000 meters.
Here is the reference web page for the Argo viewer with instructions. The FTP link is bold but not underlined, making it hard to recognize.
http://www.argo.ucsd.edu/Marine_Atlas.html
Elizabeth Muller’s statement about addressing the skeptics’ concerns in the run up to Durbin really says it all about the REAL purpose of the “BEST” study.
I don’t like this comment sections protocols. To continue my previous comment: The alternate climate theories are only important to people who think the science is important – it won’t get so much as a by-your-leave at Durbin. Remember, Durbin was established to get the US to sign up to suisidal CO2 restriction, cap & trade, etc. SCIENCE is not the driver there.
Leif Svalgaard often calculates to a change in global surface temperature of about 0.07 deg C. So this is our starting point:
Nope. When solar scientists can explain the 100k year anomaly, then we have a starting point in terms of TSI. The problem for solar scientists is that some of the public still remember when solar scientists argued long and loud that Milankovitch was wrong. Then the ocean cores showed otherwise and the solar scientists shut up and the science texts were quietly rewritten, until their was a new generation of true believers.
So if I say I believe in global warming and write my own computer program that shows the earth is warming will people think I’m really smart too? Will I be on tv?
@Stephen Wilde (October 28, 2011 at 4:38 pm)
There are 2 things going on.
Your ideas [which are summarized by Leroux (1993) in a single graph] describe symmetrical climate zone shifts at centennial timescales.
The ‘other thing’ that’s going on has to do with what most lay audiences call jet stream ‘loopiness’, what climatologists call ‘more meridional’ flow (contrasted with ‘more zonal’ flow), and what topologists would call asymmetric fractal geometry.
This latter thing, whatever one wants to call it, introduces (in layman’s terms) “unfair averaging” (Simpson’s Paradox in stat lingo) as a function of (a) anthropomorphic spatiotemporal windowing parameters and (b) ocean-continent heat-capacity contrast.
Hence the multidecadal terrestrial oscillations we observe.
It’s nothing more than quasi-discrete (opposite pole/hemisphere summer) asymmetric aliasing of the temporally-nonstationary solar drive-wheel, but the discussion is so focused around spatial integrals (averages) that spatial gradients (contrasts, particularly pole-equator, particularly along east coasts) are being ignored by most discussion participants. It’s the gradients, particularly the steep ones, that drive jet streams and associated structures.
So-called “experts” are analyzing a 16 dimension problem (integral, 0th, 1st, & 2nd derivatives for x, y, z, & t) in 1 dimension (time’s 0th only). The result is inability to see the forest (multidecadal terrestrial oscillations) for the trees (interannual terrestrial oscillations).
I think the first step for you is to start distinguishing between centennial symmetric latitudinal jet shifts and multidecadal asymmetric jet meridionality/loopiness. (If you don’t understand, talk to Corbyn.)
The next step – down the road – is interannual, but the audience isn’t ready and won’t be anytime soon — e.g. review of symmetry basics will be needed to bring even so-called “experts” into the leagues of the adequately functionally numerate to understand the simple multidecadal terrestrial oscillations first.
Participating in climate discussions has made me realize how grossly immature climate science is. A person of my background & ability levels (a landscape ecologist with moderate mathematical aptitude) should not be able to contribute, and yet it’s a cakewalk finding the constraints on the system that have been overlooked. If people with truly extraordinary talents (practical talents, not academic talents) can be attracted to the problem, progress could be accelerated to leaps & bounds — and myths about all-scale chaos & ENSO felled like the flat Earth.
Regards.
In the “It’s worse than we thought!” category. The first individual site temperature record in the BEST data that I plotted had one month value hiccups in the 15 to 40 degree Celsius range from their low pass filtered trace. Would you believe a monthly average temperature of -12.1 degrees Celsius for July, 1914, for Missouri, USA. (Site 136146 actual USHCN raw average of 26.7 degrees.) I’d think they’d want to do a little better QC before they claimed to have the definitive temperature record for the planet.
Bob Tisdale (October 28, 2011 at 6:51 pm) addressed Alec Rawls: “And of course, I could change the filtering to a 133-month running-average to smooth out the solar cycle variations.”
Caution: That approach ignores the primary geometry of the system. Looking at the wrong markers won’t advance our understanding. What’s worse: It’s likely to cause setbacks …exactly what some are hoping for:
http://judithcurry.com/2011/08/22/can-we-make-good-decisions-under-ignorance/
Regards.
R Barker says:
October 28, 2011 at 3:32 pm
Where is the objective that they discussed with Anthony. It should refer to a new and improved analysis of the last 30 years of data in light of Anthony’s collection of metadata on weather station siting and related issues?
They led Anthony to believe that they had such an objective.
Bob Tisdale says:
October 28, 2011 at 3:45 pm
I think what Bob means is that Rawls’ post suggests that a crucial test is coming in the next few years and that the crucial test will decide between CO2 as the cause of warming and the sun as the cause of warming. I think Bob means to caution that matters are not really so well defined as needed for a crucial test. Things might come together as Rawls suggests but they might not, so it is a matter of speculation. (We are not talking about rigorously formulated physical hypotheses after all.)
Bob Tisdale says:
October 28, 2011 at 6:51 pm
“I’m in the middle of writing a post on the hindcasts of the climate model used by Meehl et al (2011) and Stevenson et al (2011), the NCAR CCSM4 CMIP5 simulations.”
Yes, give us that, please.
Lucy Skywalker says:
October 28, 2011 at 3:14 pm
Well said. Warmista owe us an empirical explanation of why the flat temperature record from pure raw data in pristine records should be combined with patches from data series that are abbreviated or contain gaps.
I think the Palmer article will be seen as a watershed.
As a followup to my earlier post, if I did not make a mistake, the HADCRUT3 average for October 2001 to May 2010 was 0.437. For the period from June 2010 to September 2011, I got 0.395. So even if the one point on the BEST data set was in error, I believe that it can be safely stated that had BEST have all numbers for the last 120 months, the slope would still be slightly negative.
To Bob Tisdale,
Lighten up, dude…let the debate and conversation proceed without your self-aggrandizement and anger. N’uff said.
ferd berple says:
October 28, 2011 at 7:17 pm
Nope. When solar scientists can explain the 100k year anomaly, then we have a starting point in terms of TSI. The problem for solar scientists is that some of the public still remember when solar scientists argued long and loud that Milankovitch was wrong
The Milankovic cycles have nothing to do with the Sun, but with the orientation and shape of the Earth’s orbit. No solar physicist has ever argued otherwise. When skeptics don’t get the basic facts right, their opinion carries no weight.
I hate to say this … but this is true: author Rawls is writing as a magician plays with your mind. After reading the article, you are looking and thinking about the illusion because he has skillfully misdirected your attention. As a mathematician, there is noise and there is signal. A skilled writer will get you to confuse the two, thinking about the noise as signal and vice versa. Bravo to this skilful magician, Alec Rawls.
LazyTeenager says:
October 28, 2011 at 5:32 pm
Our recently quiet sun offers a test of which theory makes the right prediction.
———-
“Does that mean that if the next 1-5 years see
thea warming trendcontinue“resume” over that period and the decreasing and reversing rate of rise in sea levels trendcontinuereverses again to a positive rate, that you will agree that you are wrong and that climate scientists are right?”[corrected to offset laziness]
I wouldn’t, because, 1] then attributing the sea level and temp. rise to CO2 by default or by an “argument from ignorance” does not consider the possibility that other factors, such as cloud extent and placement and the null hypothesis are still in play, even though Svensmark’s mechanism might not be present; and 2] the CO2 = CAGW hypotheses have not yielded even one relevant correct empirical prediction yet: in particular, have they predicted the corrected description of the record above in conjunction with the extention you now predict?
Lazy, are you so lazy that you must repeat the same memes over and over in hopes that they will become true….“someday”? Or are you getting paid to do so? Or what?
It is unfortunate to describe the problem of recent global warming as bi-modal: ie, The cause can be resolved to either Anthropogenic CO2 or the Sun, but not to both nor to some third unknown cause. We are talking about a complex system of many moving parts, so to speak. It is a priori unlikely that just one process is in play.
Certainly some warming from rising CO2, perhaps dampened by negative feedbacks (eg clouds) may be present.
Certainly the various ocean oscillations (eg ENSO, AMO, and PDO) exist and create variations that may dwarf and obscure signals from CO2 or the Sun.
Proving the Cosmic Ray/Solar interactions as an important cause by matching up Global Temps with Sunspots or other index of solar activity will be hard to do because of uncertain lag times, coincidental ocean oscillations coming in and out of phase, and so on. Indeed, if sufficiently many difficult to measure and/or predict variables are at work, then we may need to acknowledge that the Earth’s climate variability, within a range of a few degrees Kelvin, is chaotic and the exact forcings and sensitivities will never be fully teased apart.
We still cannot measure temps reliably either on a local or global scale; on land, in the sea at various depths, nor in the air at various heights. All of the proxies for temps in the historic record are suspect. So compared to the more mature hard sciences (think chemistry or physics) we cannot even agree on what climate data are useful.
Scientists, as opposed to Post Normal Scientists, should begin every communication on climate acknowledging that the science of climate is in its infancy, that nothing is certain or settled, but that perhaps after a few more decades of good study and open discussion, we will figure out some of the major questions. So many scientists these days come across as self-assured blowhards, which makes me sad.
Presntis says:
October 28, 2011 at 9:15 pm
To Bob Tisdale,
Lighten up, dude…let the debate and conversation proceed without your self-aggrandizement and anger. N’uff said.
My my, Presntis, you certainly must have led a very sheltered life – from exposure to real scientific and rational debate, that is. Do you perhaps find such discourse “offensive” or “intolerant”?
I refer you to Willis Eschenbach’s post “What the BEST data actually says”. Below is the graph he plotted.
http://wattsupwiththat.files.wordpress.com/2011/10/best-satellite-and-other-land-temperature.jpg?w=581&h=644
According to Willis, BEST’s temp record has temps rising more than the official records for the last few years.
It’s interesting to note that sea level in the graphs you provide has been offset for things like glacial melt. Obviously, there is heat going into other things than warming the oceans and expanding them. 85% of glaciers continue to decline, Arctic sea ice is losing volume consistently. A proper accounting of the Earth’s energy budget would incorporate all these metrics instead of using just one. And the oceans are much deeper than 700 meters.
Warming from cosmic-rays/clouds is unlikely, as there has been little change in that metric (solar variance) since the 1950s, and clearly the globe has warmed since then. This time frame is fortuitous because it also lies within period you recommend the temperature data is the clearest (post-1945).
Sorry I won’t be able to continue exchange with Bob or anyone else. Am at airport sans keyboard, trying to chicken peck. Will be incommunicado for ten days. I look forward to a debate on how the intra solar-cycle temperature signal boss and does not necessarily limit the amount of heat that gets tucked away in the oceans. (“boss” should have been “does”. Arrgh. I’m done. Next stop Vietnam!)
There is sun in the graphs, but is not what you see through your sunglasses:
http://www.vukcevic.talktalk.net/CDr.htm
Presntis says: “Lighten up, dude…let the debate and conversation proceed without your self-aggrandizement and anger. N’uff said.”
There’s no “self-aggrandizement and anger” in any of my comments on this thread.
Alec rawls says: “Sorry I won’t be able to continue exchange with Bob or anyone else. Am at airport sans keyboard, trying to chicken peck. Will be incommunicado for ten days.”
Feel free to use my October 28, 2011 at 6:51 pm comment as a starting point for your next post here at WUWT. There no reason to come back to this thread in ten days.
ferd berple says: “If you download the Global Marine Alta from Argo’s website…”
How are the graphic capabilities of the software? Can it create temperature anomaly profiles at depth similar to this?
http://www.ecmwf.int/products/forecasts/d/charts/ocean/real_time/xzmaps/
Or this?
http://www.ecmwf.int/products/forecasts/d/charts/ocean/real_time/yzmaps/
With the last example, that’s a snapshot of temperature anomalies along a given longitude. Will the Global Marine Atlas software allow me to average the temperatures for the entire Pacific basin, say from 120E to 120W? I’d like to animate Meridional Overturning Circulation on a basin basis in an effort to see how the depths of 700-2000 meters are warming faster than the depths of 0-700 meters.
Is there really an organization that is monitoring all 160,000 glaciers throughout the world? Where can I see their data?
The CERN research is fascinating, but its relevance to climate change may be less than most of the respondents to this article suggest. This may be the case for several reasons:
1) Even if it can be demonstrated that cosmic rays do somehow promote cloud formation, still the effect of clouds on global temperatures is problematic. Clouds lower global temperature through their albedo effect, and raise temperature as greenhouse gases. Higher altitude clouds seem to raise temperatures and lower level clouds seem to lower it. The composition of clouds (water particles or ice particles) and their density are also important factors, and different types of cloud formations have different effects. Many scientists have concluded that, paradoxically, this most striking feature of the atmosphere may have only a slight influence, one way or the other, on global temperature.
2) If it can be shown that clouds do significantly raise or lower global temperatures, still, it needs to be shown why this rules out CO2 as being another important factor.
3) If we find that both cloud formation and atmospheric CO2 are influences on global temperature, still we need to discover which factor, if any, is dominant.
So CERN’s research, while valuable and fascinating, will not in itself tell us much about climate change. Its significance will only be found only in its relation to other factors, which are the most problematic ones that climate science has to deal with.
Werner Brozek says:
October 28, 2011 at 6:31 pm
Yes, thanks for pointing that out. Diffcult to compare the last 10 years when BEST has data missing.
This covers the last 10 years of BEST with the time frame covering the error removed.
http://www.woodfortrees.org/plot/best/from:2000.2/to:2010.2/normalise/plot/best/from:2000.2/to:2010.2/normalise/trend/plot/rss/from:2000.2/to:2010.2/normalise/plot/rss/from:2000.2/to:2010.2/normalise/trend/plot/uah/from:2000.2/to:2010.2/normalise/plot/uah/from:2000.2/to:2010.2/normalise/trend
When starting with a La Nina period and ending with a El Nino though is a unfair situation to dudge trends. In this situation all 3 trends have changed with the negative ones becoming positive and the positiive one becoming flat. The ones showing the biggest change are the ones most sensitive to ENSO. (ie the satellite data)
Gary,
Did someone say there was? I don’t believe so. Various groups have collected data kept by various nations. The study below represents one such effort – the sample size and methodology is described.
http://www.ncbi.nlm.nih.gov/pmc/articles/PMC26446/
Wherever and however the data is sampled, different groups come up with similar results.
Bob Tisdale says:
October 28, 2011 at 6:51 pm
……The topic at hand is your assumption that the “the sun as the primary driver of climate”; that is, that the rise in global surface temperature during the 20th Century can be explained by the increase in solar activity to an “80 year grand maximum” and the recent flattening of that temperature can be explained by “the sun has gone quiet.” So let’s take a look at some data. You know me, I like data, and I like to see explanations based on data……
Personally, I can’t see how solar variations could have caused the rise and then flattening in global surface temperatures that you claim. I’ve seen papers that have determined the variation on global temperature for those solar cycles was in the range of 0.2 deg C, yet I don’t think that would be enough to help.
_______________________________________
Bob you are looking at only one variable of the sun. More is changing that TSI
From NASA:
“September 29, 2009: Planning a trip to Mars? Take plenty of shielding. According to sensors on NASA’s ACE (Advanced Composition Explorer) spacecraft, galactic cosmic rays have just hit a Space Age high.
“In 2009, cosmic ray intensities have increased 19% beyond anything we’ve seen in the past 50 years,” says Richard Mewaldt of Caltech.
The cause of the surge is solar minimum, a deep lull in solar activity that began around 2007 and continues today. Researchers have long known that cosmic rays go up when solar activity goes down. Right now solar activity is as weak as it has been in modern times, setting the stage for what Mewaldt calls “a perfect storm of cosmic rays.”
“We’re experiencing the deepest solar minimum in nearly a century,” says Dean Pesnell of the Goddard Space Flight Center, “so it is no surprise that cosmic rays are at record levels for the Space Age.”…..” http://science.nasa.gov/science-news/science-at-nasa/2009/29sep_cosmicrays/
Companion piece:
“Sept. 23, 2008: In a briefing today at NASA headquarters, solar physicists announced that the solar wind is losing power.
“The average pressure of the solar wind has dropped more than 20% since the mid-1990s,” says Dave McComas of the Southwest Research Institute in San Antonio, Texas. “This is the weakest it’s been since we began monitoring solar wind almost 50 years ago.”
The heliosphere is a bubble of magnetism springing from the sun and inflated to colossal proportions by the solar wind….
“The solar wind isn’t inflating the heliosphere as much as it used to,” says McComas. “That means less shielding against cosmic rays.”
“Ulysses also finds that the sun’s underlying magnetic field has weakened by more than 30% since the mid-1990s,” says Posner. “This reduces natural shielding even more.”
….But any extra cosmic rays can have consequences…..Also, there are controversial studies linking cosmic ray fluxes to cloudiness and climate change on Earth. That link may be tested in the years ahead. http://science.nasa.gov/science-news/science-at-nasa/2008/23sep_solarwind/
Peer reviewed Paper: The influence of cosmic rays on terrestrial clouds and global warming “…It is worthwhile noticing that at epochs of sunspot maxima, solar irradiance is enhanced and the low cloud cover is reduced together with the Earth’s albedo. The opposite effect occurs at sunspot minima. Thus, the low cloud albedo change, and the increase in solar irradiance which accompanies increasing solar activity, both operate to warm the climate and the respective radiative forcing contributions are compounded….
…The lack of correlation between cosmic rays and low cloud factor over the poles and the significant degree of correlation in the tropics, is also unexpected….”
Although the TSI (total energy) stays the same the MIX changes.
Another NASA article
NASA: Solar Dynamics Observatory: The ‘Variable Sun’ Mission
“Over longer periods of decades to centuries, solar activity waxes and wanes with a complex rhythm that researchers are still sorting out….
To the amazement of many researchers, the solar constant has turned out to be not constant.
“‘Solar constant’ is an oxymoron,” says Judith Lean of the Naval Research Lab. “Satellite data show that the sun’s total irradiance rises and falls with the sunspot cycle by a significant amount.”
At solar maximum, the sun is about 0.1% brighter than it is at solar minimum. That may not sound like much, but consider the following: A 0.1% change in 1361 W/m2 equals 1.4 Watts/m2. Averaging this number over the spherical Earth and correcting for Earth’s reflectivity yields 0.24 Watts for every square meter of our planet….
Finally – and of most immediate relevance for Earth–SDO will observe the sun at wavelengths where the sun is most variable, the extreme ultraviolet (EUV).
During a solar flare, the sun’s extreme ultraviolet output can vary by factors of hundreds to thousands in a matter of seconds. Surges of EUV photons heat Earth’s upper atmosphere, causing the atmosphere to “puff up” and drag down low-orbiting satellites. EUV rays also break apart atoms and molecules, creating a layer of ions in the upper atmosphere that can severely disturb radio signals. According to Judith Lean, “EUV controls Earth’s environment throughout the entire atmosphere above about 100 km.”
“EUV is where the action is,” agrees Woods. ”
Another NASA article
Deep Solar Minimum
A 50-year low in solar wind pressure: Measurements by the Ulysses spacecraft reveal a 20% drop in solar wind pressure since the mid-1990s—the lowest point since such measurements began in the 1960s……
A 12-year low in solar “irradiance”: Careful measurements by several NASA spacecraft show that the sun’s brightness has dropped by 0.02% at visible wavelengths and 6% at extreme UV wavelengths since the solar minimum of 1996. …. Earth’s upper atmosphere is heated less by the sun and it is therefore less “puffed up.” ….
A 55-year low in solar radio emissions: After World War II, astronomers began keeping records of the sun’s brightness at radio wavelengths. Records of 10.7 cm flux extend back all the way to the early 1950s. Radio telescopes are now recording the dimmest “radio sun” since 1955….
“Since the Space Age began in the 1950s, solar activity has been generally high,” notes Hathaway. “Five of the ten most intense solar cycles on record have occurred in the last 50 years. We’re just not used to this kind of deep calm.”……
A University Today Article:
“New measurements from a NASA satellite show a dramatic cooling in the upper atmosphere that correlates with the declining activity of the current solar cycle. For the first time, researchers can show a timely link between the Sun and the climate of Earth’s thermosphere….
“The Sun is in a very unusual period,” said Marty Mlynczak, SABER associate principal investigator and senior research scientist at NASA Langley. “The Earth’s thermosphere is responding remarkably — up to an order of magnitude decrease in infrared emission/radiative cooling by some molecules.”
The TIMED measurements show a decrease in the amount of ultraviolet radiation emitted by the Sun. In addition, the amount of infrared radiation emitted from the upper atmosphere by nitric oxide molecules has decreased by nearly a factor of 10 since early 2002. These observations imply that the upper atmosphere has cooled substantially since then….” http://www.universetoday.com/47851/earths-upper-atmosphere-is-cooling/
A screen capture of a n Article:
NOAA: From the late fifties the SUN has been at its most active in 11,500 years and may have caused the present warming
What I get from this is a correlation of sun and cloud cover in the tropics. An INCREASE in cloud cover and albedo at Solar minima while there is a DECREASE in ultraviolet radiation and Extreme ultraviolet radiation. From other information we know these are the wavelengths that penetrate deepest into the Ocean and also hold the most energy. There is also indications of longer term sun cycles besides the 11 yr and in the last fifty years, since the late fifties,(surprise) the sun has been very active till now.
On top of that is the 20% increase in cosmic rays and a 30% decrease in the “sun’s underlying magnetic field”during the last minimum.
Therefore I still say we really do not have enough information except to say there are a lot of factors and you can not deal the sun out of the game just based on the basis of a near constant TSI
Sorry MattG, but ‘trend’ after ‘normalise’ is utterly meaningless!
Gail Combs says:
October 29, 2011 at 7:48 am
On top of that is the 20% increase in cosmic rays and a 30% decrease in the “sun’s underlying magnetic field”during the last minimum.
Several myths rolled into one. The 20% decrease in cosmic rays was for the lowest energies [which do not even reach the Earth] and was just since the minimum in 1996 [we didn’t have space measurements before that]. Every other minimum [1996, 1976, 1954, …] has lower cosmic rays for well-known reasons. The magnetic field of the sun is now back to where it was about 100 years ago. The Sun has not been the most active [in 11,000 years] this past century, and so on. http://www.leif.org/research/Historical%20Solar%20Cycle%20Context.pdf
http://www.leif.org/research/Does%20The%20Sun%20Vary%20Enough.pdf
http://www.leif.org/research/How%20Well%20Do%20We%20Know%20the%20Sunspot%20Number.pdf
Gail Combs says: “What I get from this is a correlation of sun and cloud cover in the tropics.”
Please provide links to cloud cover and which ever solar dataset you prefer and we’ll plot them. KNMI has a couple of long-term cloud cover datasets to choose from, but they are spatially incomplete: ICOADS (oceans), CRU (land), They also have a couple of short-term spatially complete (satellite based) cloud datasets too. But they are very short.
(Eeeek! Just looked out the window. It’s snowing like crazy. Ground’s too warm for it to stick right now, but it’s accumulating on the bushes and pine trees.)
woodfortrees (Paul Clark) says:
October 29, 2011 at 7:50 am
When comparing trend without normalise just recently there is no difference. (should have known this really)
Thanks for letting me know, good tool BTW.
barry says:
October 29, 2011 at 6:10 am
Gary,
Is there really an organization that is monitoring all 160,000 glaciers throughout the world?
Did someone say there was? I don’t believe so. Various groups have collected data kept by various nations. The study below represents one such effort – the sample size and methodology is described.
http://www.ncbi.nlm.nih.gov/pmc/articles/PMC26446/
Wherever and however the data is sampled, different groups come up with similar results.
You mean like the cash value, both scientific and in a perhaps also valid pecuniary way, of The conclusion from the study you link to?
It is, however, clear that carefully measured glacier data are limited both temporally and spatially. Existing records need to be expanded to better understand the relations between glacier volume change and climatic driving forces.
Or is the word of the WWF final?
Bob Tisdale says:
October 29, 2011 at 9:22 am
Gail Combs says: “What I get from this is a correlation of sun and cloud cover in the tropics.”
________________________________
Bob I was quoting from the paper:
The influence of cosmic rays on terrestrial clouds and global warming
E. Palle Bago and C. J. Butler
Paper appeared in Astronomy & Geophysics, August 2000. Vol 41, Issue 4, pp 18-22.
Original: http://star.arm.ac.uk/~ambn/341epb.ps
The link I quoted from: http://www.solarstorms.org/CloudCover.html
Has several graphs.
________________________________
Lief,
I was quoting from NASA links directly. As I said we need a lot more information before we start tossing out “The Science says” type of statements. We are just not there yet, although I certainly agree Water in all its forms, Clouds, Oceans, Ice and Vapor is a real big player. But you still can not get around the fact ALL energy comes from the sun except for geothermal. (Volcanoes seem to be another big player in at least short term weather events.) I am also very well aware that correlation is not causation – Skirt lengths and the stock markets come to mind.
Bob, Lief, we all know that there are Ocean oscillations, did it ever occur to you that once an oscisilation is in place it does not take much additional energy to KEEP that oscillation going???
Here is another NASA link:
NASA Finds Sun-Climate Connection in Old Nile Records
“March 19, 2007
Long-term climate records are a key to understanding how Earth’s climate changed in the past and how it may change in the future. Direct measurements of light energy emitted by the sun, taken by satellites and other modern scientific techniques, suggest variations in the sun’s activity influence Earth’s long-term climate. However, there were no measured climate records of this type until the relatively recent scientific past…..
Now, however, a group of NASA and university scientists has found a convincing link between long-term solar and climate variability in a unique and unexpected source: directly measured ancient water level records of the Nile, Earth’s longest river.
Alexander Ruzmaikin and Joan Feynman of NASA’s Jet Propulsion Laboratory, Pasadena, Calif., together with Dr. Yuk Yung of the California Institute of Technology, Pasadena, Calif., have analyzed Egyptian records of annual Nile water levels collected between 622 and 1470 A.D. at Rawdah Island in Cairo. These records were then compared to another well-documented human record from the same time period: observations of the number of auroras reported per decade in the Northern Hemisphere. Auroras are bright glows in the night sky that happen when mass is rapidly ejected from the sun’s corona, or following solar flares. They are an excellent means of tracking variations in the sun’s activity.
Feynman said that while ancient Nile and auroral records are generally “spotty,” that was not the case for the particular 850-year period they studied….
Since the time of the pharaohs, the water levels of the Nile were accurately measured, since they were critically important for agriculture and the preservation of temples in Egypt,” she said. “These records are highly accurate and were obtained directly, making them a rare and unique resource for climatologists to peer back in time.”
A similarly accurate record exists for auroral activity during the same time period in northern Europe and the Far East. People there routinely and carefully observed and recorded auroral activity, because auroras were believed to portend future disasters, such as droughts and the deaths of kings.
“A great deal of modern scientific effort has gone into collecting these ancient auroral records, inter-comparing them and evaluating their accuracy,” Ruzmaikin said. “They have been successfully used by aurora experts around the world to study longer time scale variations.”
The researchers found some clear links between the sun’s activity and climate variations. The Nile water levels and aurora records had two somewhat regularly occurring variations in common – one with a period of about 88 years and the second with a period of about 200 years……”
Research, published in a paper in the May 15, 2002 issue of Geophysical Research Letters,
Study of Dust in Ice Cores Shows Volcanic Eruptions Interfere with the Effect of Sunspots on Global Climate
“University at Buffalo scientists working with ice cores have solved a mystery surrounding sunspots and their effect on climate that has puzzled scientists since they began studying the phenomenon.
The research, published in a paper in the May 15 issue of Geophysical Research Letters, provides striking evidence that sunspots — blemishes on the sun’s surface indicating strong solar activity — do influence global climate change, but that explosive volcanic eruptions on Earth can completely reverse those influences.
It is the first time that volcanic eruptions have been identified as the atmospheric event responsible for the sudden and baffling reversals that scientists have seen in correlations between sunspots and climate…..
Bob Tisdale says:
October 29, 2011 at 9:22 am
(Eeeek! Just looked out the window. It’s snowing like crazy. Ground’s too warm for it to stick right now, but it’s accumulating on the bushes and pine trees.)
I live in the sunny SOUTH, mid north Carolina and they have a blasted FREEZE warning out tonite!!!!
Maybe we will be lucky and Washington DC will get a snow storm……
I just checked. Forecast for today was ice pellets.
“Now
Light snow…occasionally mixing with rain…will continue across the metropolitan areas of Washington DC and the city of Baltimore this evening. Through 8 PM…additional accumulations along the Mason Dixon line of around an inch will be possible…but elsewhere little or no additional snowfall accumulation is expected.
http://classic.wunderground.com/cgi-bin/findweather/getForecast?query=Washington%20DC&wuSelect=WEATHER
I do like Mother Nature’s sense of humor.
JPeden,
Have the WWF published peer-reviewed work on glaciers? I’m not aware of that.
In study after study at least 85% of monitored glaciers are receding/losing mass balance. Many studies show a greater percentage, but I think it’s better to lay out conservative values.
Gail Combs says:
October 29, 2011 at 3:39 pm
I was quoting from NASA links directly.
There are thousands of papers [going back to at least ~1630] claiming sun-weather-climate relationships. Including some of mine.
Gail Combs: Thanks for the links. I had run across them a while back. The Bago and Butler paper appears to show an agreement for almost one solar cycle (not a real convincing argument), with the low level clouds lasting a little longer. It would be interesting to extend this another decade/solar cycle. Also, the ISCCP Cloud Amount data was originally influenced by volcanic aerosols (the reason for the divergence in 1992-94 at mid and high levels?). It was also globally incomplete–a big slice of the Indian Ocean is missing through the late 1990s if memory serves me well. I’ll plot the ISCCP cloud amount data (1983-2006) tomorrow, and see if the agreement still holds.
Regards
Gail Combs: Curiosity got the best of me. Any correlation ended in the early 1990s. They appear to me to be so far out of line past then that there was no reason for me to download the data.
Global Total Cloud Amount Anomalies:
http://i40.tinypic.com/soa62h.jpg
Low Level (A shift after 1997/98 El Niño?):
http://i44.tinypic.com/s309jn.jpg
Mid Level:
http://i40.tinypic.com/2rq1468.jpg
High Level:
http://i41.tinypic.com/110kmpv.jpg
Gail (& Bob): No use hunting with the wrong markers.
Conjecture about clouds divorced from awareness of circulation isn’t sensible.
http://wattsupwiththat.files.wordpress.com/2011/10/vaughn1.png
Layman’s analogy:
It’s winter & it’s frigid outside. You’re wearing a thick, puffy jacket and you’re warm because you just stepped out from a toasty building, but you forgot to wear a hat and insulated boots…
See the cautionary notes I offered Mr. Rawls above Gail.
M.A.Vukcevic (October 29, 2011 at 12:49 am) wrote: “There is sun in the graphs, but is not what you see through your sunglasses: http://www.vukcevic.talktalk.net/CDr.htm “
Solar cycle acceleration/deceleration modulates the dominant temporal cycles for the variables you’ve plotted, but be mindful of confounding, maintaining an open mind to the possibility that common modulation is via parallel pathways. Multiple pinion sizes (trees) don’t matter; what matters is the common drive wheel (forest). The mechanic I’m discussing this stuff with intuitively & immediately picked up on the SCL’ metric as an indicator of the forest — i.e. the common driver of the whole system [ http://wattsupwiththat.files.wordpress.com/2011/10/vaughn4.png ], regardless of the varied cycles of the system’s internal components, many of which lie along different drive lines. http://wattsupwiththat.com/2011/10/29/new-wuwt-polar-vortex-reference-page/#comment-782132
Paul Vaughan says:
October 29, 2011 at 8:48 pm
the SCL’ metric as an indicator of the forest — i.e. the common driver of the whole system
Paul, this is total nonsense. It seems that the Kruger & Dunning conclusions apply to you as well.
The first post you made seemed to simply dismiss the entire idea, without qualifications. You seemed to dismiss the idea that a quiet sun may effect the climate and that we might be able to use this time of quiet sun and rising CO2 as a test of which idea was right entirely as “speculation”, As far as that went, simply stopping there and my post would have been true, simply dismissing all of it without reason would be unscientific. However, since you have eventually followed it up with actual reasons why you may believe that the specifics of this article may be non scientific (not data based) I can see your point, and I withdraw my earlier post.
However, concerning that idea, that a quiet sun may not produce the recent cooling, there are reasons, scientific ones (data), that may show you wrong. At least now we are talking science (data).
When I look at it, I see the following:
There is some cooling recently, this must have some cause.
Any cause must have something eventually to do with the sun, since the sun is where allwarming comes from.
Whether this short term cooling is caused by solar quietness certainly may be speculative.
It may be that the sun causes warming or cooling only over longer terms (through slow heating of the sea, or lack thereof).
However, there is some recent data which strongly suggests that the sun may have shorter term effects.
First, there is the now recently known fact that the UV radiation changes a lot with a quieter sun.
This could cause some heating of the upper atmosphere, and/or change jet streams and the like.
The CERN cloud experiment and another similar one showed that cosmic rays may indeed have a strong effect to create clouds, this data looks fairly conclusive.
There is also some data showing that short term increases in cosmic rays may result in short term increases in clouds (some data to back it up, possibly not conclusive).
Therefore this recent data about a fairly large change in UV radiation plus some fairly plausible data to suggest that a quiet sun may result in more cosmic rays and more clouds and shade strongly suggests that these theories may have some basis in fact.
Note, I reject, however, the idea that it is either only UV or cosmic rays, it could be some of both (or it may be something else as yet not known about).
About the specific data on clouds you presented, I see one problem with it. The temperature data only shows a large temperature drop very recently, within a year (before that and since 2000 or so, the drop is too gradual to be conclusive). The cloud data stops several years ago, thus, the cloud data does not cover the period when there is a great enough short term cooling that it may be able to show if cloud data has any bearing on that cooling. Needed is cloud data that covers all the way up through this cooling, I believe all the way to 2010 or even 2011. One could also say the same about UV, is there any radical change in UV around this time, what about increased cosmic rays, change in magnetics?
This is the data I was talking about in my last post. Note the very sharp drop right at the end of 2010, that is the place I would want to look for cosmic rays and possibly associated changes in clouds, and/or UV changes and/or anything else that might change short term temperatures
Legatus says:
October 29, 2011 at 9:55 pm
This is the data I was talking about in my last post.
=================================================
Legs., I thought I’d let you know I used some of the info you presented here….. http://suyts.wordpress.com/2011/10/29/the-mischaracterization-of-skepticism-and-the-misapplication-of-the-skeptic-label/ THANKS!
EOP content is bitterly inconvenient for some. Download those data & archive them. One never knows when publicly-available data might get vandalized.
http://upload.wikimedia.org/wikipedia/commons/3/3a/Simple_CV_Joint_animated.gif
http://wattsupwiththat.com/2011/10/29/new-wuwt-polar-vortex-reference-page/#comment-782252
@Legatus (October 29, 2011 at 9:50 pm)
Tip: Pay attention to Piers Corbyn’s commentary (filtering off the potentially-distracting politics / persuasive psychology inserted) on Svensmark’s ideas. Although very polite towards Svensmark, Corbyn disagrees fundamentally with Svensmark’s ideas (a ship eventually due for torpedoing in what some suspect is an alarmist set-up).
barry says:
October 29, 2011 at 4:09 pm
JPeden,
Have the WWF published peer-reviewed work on glaciers? I’m not aware of that.
In study after study at least 85% of monitored glaciers are receding/losing mass balance. Many studies show a greater percentage, but I think it’s better to lay out conservative values.
In answer to your first question, which then specifically reflects upon your following claim, No. But the WWF reports have made their way into the IPCC’s analyses at high and significant levels. The following link states the situation as pertaining to the ipcc’s report on Himalayan glaciers below and then gives an incomplete list of some of the other relevant WWF “papers” cited by the IPCC, which don’t look like they were “peer reviewed” either:
http://nofrakkingconsensus.blogspot.com/2010/01/more-dodgy-citations-in-nobel-winning.html
Similarly, the only reason the IPCC can declare that “Changes in climate are affecting many mountain glaciers, with rapid glacier retreat documented in the Himalayas, Greenland, the European Alps, the Andes Cordillera and East Africa” is because a WWF report makes this claim [about the Himalays]
The next link gives a little history of what happened in the case of the completely anecdotally derived WWF paper’s inclusion in the ipcc’s report on Himalayan glaciers and its dominant role there, also including the fact that an Indian glaciologist had recently published a paper refuting the ipcc’s claim:
http://wattsupwiththat.com/2010/01/17/told-ya-so-ipcc-to-retract-claim-on-himalayn-glacier-melt-pachauris-arrogance-claim-backfires/
James Sexton says Legs., I thought I’d let you know I used some of the info you presented here…..
Actually, you may have written it up a bit better than I did…
(Certainly shorter and sweeter anyway)
I kinda like the idea of being called “Legs”, “Ain’t there nobody that can shoot this guy so he don’t bounce back?”
Uh, where is this commentery going on?
As for commentary or disagreeing, I prefer to use the scientific method, that is, find a way to test it, then do so, all else is merely opinion.
What are the facts? Again and again and again-what are the facts? Shun wishful thinking, ignore divine revelation, forget what “the stars foretell,” avoid opinion, care not what the neighbors think, never mind the unguessable “verdict of history”–what are the facts, and to how many decimal places? You pilot always into an unknown future; facts are your single clue. Get the facts! Robert Heinlein
So far, such limited tests of Svensmark’s ideas seem to point to it being at least partially true.
Paul Vaughan says:
October 29, 2011 at 8:48 pm
………….
Hi Paul
I take a simple view (see my post http://wattsupwiththat.com/2011/10/29/uh-oh-it-was-the-best-of-times-it-was-the-worst-of-times/#comment-782381)
I agree, the Svensmark’s hypothesis may be a big ‘unprofitable’ detraction. There isn’t much there that hasn’t been known before.
Legatus says: “However, concerning that idea, that a quiet sun may not produce the recent cooling, there are reasons, scientific ones (data), that may show you wrong. At least now we are talking science (data).”
I never said that the “quiet sun” did not have an impact on climate; my research shows that the solar variability, in and of itself, is not the primary driver of the flattening of Surface Temperature in recent years or the primary driver of the rise in surface temperatures over the past century.
Are you aware that you can reproduce the underlying global temperature anomaly curve using the a common ENSO index, NINO3.4 SST anomalies?
http://bobtisdale.wordpress.com/2009/01/25/reproducing-global-temperature-anomalies-with-natural-forcings/
It simply requires a different mindset about what ENSO represents. ENSO is a process, not an index. I have in numerous other posts discussed and illustrated and animated the processes through which ENSO can and is responsible for that underlying curve–at least from 1982 to present, the era of satellite-based sea surface temperature data. In the post I linked above, I also used scaled sunspot number data as a means of accounting for the insignificant impact the solar cycle has on global temperatures…
http://i42.tinypic.com/k50pd0.jpg
…and used volcanic aerosol data for their short-term impacts.
http://i39.tinypic.com/w7fz7k.jpg
That curve follows quiet closely back to about 1905, better than what we’re seeing out of most general circulation models.
Regards
:
Bob Tisdale says:
October 30, 2011 at 6:59 am
While I agree Bob, the question is where did that extra energy come from to fuel the ENSO?
I can’t find a better explanation than global cloud albedo dropping 5 percent during the same period referred too in your post. Therefore, the sun did cause this indirectly with increasing solar radiation reaching the ocean surfaces. A prime example of a mechanism that can warm the ocean, but doesn’t have to change itself to do so. (at least by radiation energy wise externally)
The difficult part it was caused this albedo to decline and while there are possible ideas that include the polar vortex, that influence especially the AO and NAO. The question is what caused these changes and with these lately changing especially with regards to a quieter solar cycle. The current source could well be the sun, but can’t be sure at least at this moment of time. That’s why the Met Office recently reported quieter sun causing UK winters to become colder, but with some spin in it to keep global warming going.
The warming of the polar vortex, favourable AO, NAO and jet stream closer to the equator, increases the area around the globe where cold and warm air collides. These in turn increase instability and formation of clouds, so if stays more often nearer the equator cloud albedo increases. Closer to the pole as pre 2001 during the warming period cloud albedo declines.
@M.A.Vukcevic (October 30, 2011 at 2:28 am)
Try this [ http://wattsupwiththat.files.wordpress.com/2011/10/vaughn3.png ] on CET.
—
Bob Tisdale:
The spatiotemporal geometry isn’t what you (implicitly, not explicitly) assume with your solar comments.
Regards.
Paul Vaughan says:
October 30, 2011 at 9:58 am
The spatiotemporal geometry isn’t what you (implicitly, not explicitly) assume with your solar comments.
Whatever it is, it is not physics and does not bring anything worthwhile to the table.
The importance of Northern hemisphere rotation asymmetry in aliasing solar drive wheel shifts has been overlooked by the mainstream.
It’s not sensible to assume symmetric spatial kernels when aggregating from a field with such a high fractal dimension (length:area & area:volume ratios). A quick look at the north-south “waviness” vs. “straightness” of this [AnimMSLP http://i54.tinypic.com/swg11c.png ] (for a univariate example) should make this crystal clear, but we’re dealing with folks lacking the functional numeracy to see that they’re basing their statistical inference on patently untenable assumptions.
They’ve failed absolutely at data exploration. Normally collegiality & diplomacy would demand that such things not be said in public, but they’ve gone too far with their nature-denigrating data misinterpretations.
Multidecadal terrestrial oscillations are guaranteed by the spatiotemporal version of Simpson’s Paradox, the “unfair averaging” (in layman’s terms) of straight vs. loopy land-ocean heat-capacity contrasts with zonal vs. meridional jet shifts on an asymmetric planet.
A quick look at the north-south fractal dimension contrast (length:area ratio) of isolines here [ http://i54.tinypic.com/swg11c.png ] makes that crystal clear.
The changes are only tenths of a degree K, but they do account for the multidecadal terrestrial oscillations we observe, as I’ve shown [ http://wattsupwiththat.files.wordpress.com/2011/10/vaughn4.png ]. It’s just asymmetric aliasing of the solar drive wheel. If climate discussion participants had a better handle on complex numbers (high-school math) and correlation (1st year university intro stats) they’d realize it’s as simple as 1 + 1 = 2.
One of the challenges plaguing the media & the public in the climate discussion is the relentless mainstream direction of our attention to average anomalies where climate cannot be understood without maintaining vigilant cognizance of absolute gradients (differentially driving circulation & water states across hemispheres & basins).
Perhaps mainstreamers don’t want the public to develop a clue about asymmetric aliasing of solar-driven cumulative circulation because every department & disciplinary branch wants their share of the boat-loads of public climate research funding before everyone clues in to what we already know with crystal clarity from EOP. Is it atrophy from too many years on the gravy train or just the blinding carrot on the stick? Too costly for society & civilization either way. Checks & balances needed.
Don’t fall for the expensive CERN ‘cloud’ set-up.
Paul Vaughan says:
October 30, 2011 at 11:56 am
If climate discussion participants had a better handle on complex numbers (high-school math) and correlation (1st year university intro stats) they’d realize it’s as simple as 1 + 1 = 2.
It is an uphill struggle when you are the only one with full understanding of something and all the rest of the World is clueless. But take solace in the fact that scientists are fully cognizant and knowledgeable about complex numbers and correlations. This [as you point out] may not be the case with the average participant on WUWT – although many might disagree with your characterization of their ability].
It’s not knowledge of physics that’s the primary problem at present. It’s parameterization of constraints on spatiotemporal mass distribution and integrals of circulation.
In layman’s terms:
They haven’t got the circulatory geometry right in the models.
It’s absolutely not chaos at all scales. Aliasing & integrals are constrained spatiotemporally in ways the central mainstream has so far ignored.
Currently, the primary bottlenecks in the climate discussion are sampling theoretic. The modelers might have a relative cakewalk getting the models right once the spatiotemporal framework hurdle has been overcome.
As a minimum criteria for candidacy, a model should be able to reproduce all EOP (Earth Orientation Parameters). This means modelers have a lot of work to do.
And if they think they (very well paid workers) should get a free pass on this minimum modeling requirement, I recommend cautioning them as follows: Forget it. And be thankful for having interesting paid work to do at a time when so many are excluded from the economy.
Best Regards to All. (Off to work for the next 5 days…)
Paul Vaughan says:
October 30, 2011 at 2:12 pm
As a minimum criteria for candidacy, a model should be able to reproduce all EOP (Earth Orientation Parameters)
Those are consequences of climate [through poorly known mechanisms] so it is nonsense to try use those as criteria.
Legatus says:
October 29, 2011 at 9:55 pm
This is the data I was talking about in my last post. Note the very sharp drop right at the end of 2010, that is the place I would want to look for cosmic rays and possibly associated changes in clouds, and/or UV changes and/or anything else that might change short term temperatures
______________________________
Do not forget the erupting volcano Eyjafjallajokull on April 14, 2010. … The plumes have closed some of Europe’s busiest airports and the spring here in NC was very cool.
Paul Vaughan says:
October 30, 2011 at 11:56 am
……One of the challenges plaguing the media & the public in the climate discussion is the relentless mainstream direction of our attention to average anomalies where climate cannot be understood without maintaining vigilant cognizance of absolute gradients (differentially driving circulation & water states across hemispheres & basins).
Perhaps mainstreamers don’t want the public to develop a clue about asymmetric aliasing of solar-driven cumulative circulation because every department & disciplinary branch wants their share of the boat-loads of public climate research funding before everyone clues in to what we already know with crystal clarity from EOP. Is it atrophy from too many years on the gravy train or just the blinding carrot on the stick? Too costly for society & civilization either way. Checks & balances needed……
_________________________________________
I think the problem is far more simple. Schools no longer bother to teach arithmetic much less math! Statistics??? -whats that. (28% of US students entering college have to do remedial classes) The majority of college students do not go much beyond the first year of high school math (algebra) and then maybe a course in “business math”
If I can barely follow what you are saying with a BS in Chemistry, how the heck can the liberal arts major (journalists and teachers) hope to understand? Most people in the USA at least have a heck of a lot less science/math education then you find in this blog.
…..
Back on subject.
In simple language you seem to be saying that the asymmetrical distribution of the land mass with the majority of land mass in the Norther hemisphere and most of the water in the southern hemisphere is the cause of the ocean oscillations … with help from the “11 year” solar cycle??? or without the solar cycle???
For data there is also Project Earthshine Earth’s global albedo, I do not know if the data sets are available.
It may be that we are talking about too short a time frame and “quiet sun” may be a relative term. Specifically, we came out of a Little Ice Age about 150 years ago. During that time, there was a Maunder Minimum and a Dalton Minimum. Now, those appear to have been more extreme and longer periods of quiet sun than we have experienced for the last 100 years. We don’t have much in the way of measurements of anything like UV radiation or cosmic rays from the Little Ice Age, or accurate world wide temperature measurements to compare to the UV or cosmic rays then. Since then, it is quite possible that the sun has not gone quiet to the same extant as it did back then. Thus when we are talking “quiet sun”, comparatively, those two minimum periods might be called “real quiet sun”. To effect noticeable temperature changes, we may need another period of “real quiet sun”. It may be that the mechanism by which “real quiet sun” creates a little ice age may indeed be by increases in cosmic rays resulting in increased clouds, and/or a change in UV radiation.
Thus, the reason you may say that solar variability does not cause climate changes is simply because we have had no serious solar variability of note during the time period you have measurements for. However, there is a prediction that we are right now 10 years into a period of another solar minimum, one a little less extreme than the last two, but still a definite minimum. If that is the case, in the next several decades, we may indeed have a large enough change in solar variability to actually test out the cosmic ray and/or UV change theories (buy long underwear). The simple fact is that the Little Ice Age definitely was a period of climate change, and it did indeed coincide with not one but two periods of solar minimum, and thus there is a very good chance that solar variability is the prime cause of that coolness, and it may very well be that the solar variables that had the most effect on the climate are the suns’ effect on cosmic rays and/or UV changes.
Also, ENSO alone cannot cause warming. ENSO merely moves heat around, it is not the source of that heat. The sun is the source of the heat, the oceans store that heat and release more or less of it at various times. If over the last 150 years it has been getting slowly warmer, the sun is the only factor that could cause that, it being the sole source of heat. The oceans may simply, because they store so much heat, be able to mask any short term effects of solar variability so that we will not see a direct correlation between solar variability at the time they happen with climate changes. Most people say that it takes two solar cycles to see significant change, and we are still in the first one, and the Little Ice Age suggests that we may need a “very quiet sun”, not just a “quiet sun”, before the seas’ delaying action on climate changes is overcome in at the earliest the next solar cycle.
To sum up:
You may not agree that solar variability changes temperature because you have not seen real solar variability.
It may be that the delaying action of the stored heat in the oceans delays any temperature change caused by solar variability.
There is a good chance that you will get a chance to see if solar variability changes temperature, however, you may have to wait 10+ years.
So I would not simply dismiss the cosmic ray or UV ideas just yet…
For that matter, just because recently the total radiance of the sun changes only 0.1% does not mean that in a real solar minimum it will continue to change so little.
Remember, during the time period we are able to measure UV and cosmic rays and total radiance, we have not had a real minimum to measure.
Leif Svalgaard (October 30, 2011 at 2:34 pm) writing of EOP (Earth Orientation Parameters): “Those are consequences of climate [through poorly known mechanisms] so it is nonsense to try use those as criteria.”
Misrepresentation.
We know EOP are consequences (not causes) of climate, but your claim that the mechanisms are poorly known is far less true now than it was a year ago. The full solution is within striking distance if the right multidisciplinary combination of people cooperate, but politics seems likely to build in lengthy delays.
Until the climate models can reproduce EOP, the climate models are omitting fundamentals and thus their output does not warrant more than casual consideration.
More respect for nature would be a welcome development.
Paul Vaughan says:
October 30, 2011 at 10:37 pm
but your claim that the mechanisms are poorly known is far less true now than it was a year ago.
So the EOP experts have made significant progress lately. Perhaps some references to papers describing their new-found insights might be helpful.
Anecdote: When I checked the news last night I found this: Skeptic’s own study finds climate change is real = http://www.ctv.ca/CTVNews/TopStories/20111030/skeptic-study-finds-climate-change-real-111030/
The title of the article is a gross, humorous misrepresentation.
—
@Gail Combs (October 30, 2011 at 3:48 pm)
Since Earth is tilted & asymmetric, it aliases the solar cycle.
Anomaly-think has probably been a major factor retarding mainstream realization of this sheer simplicity. The decomposition of absolutes into climatology + anomaly is based on untenable geometric assumptions; certainly it provides an eminently sensible & practical first order approximation, but anyone who looks with great non-assumptive care will find lurking factors systematically scrambling the variance partitioning.
Certainly you are correct that Western math education systems are declining. Teaching basic symmetry concepts (e.g. reflection, rotation, translation) to university math education students was one of the eye openers for me about inconsistencies in the population.
Paul Vaughan says:
October 30, 2011 at 10:37 pm
Until the climate models can reproduce EOP, the climate models are omitting fundamentals
One would think that the climate models should reproduce climate first and foremost.
Legatus says:
October 30, 2011 at 5:04 pm
Remember, during the time period we are able to measure UV and cosmic rays and total radiance, we have not had a real minimum to measure.
The current thinking is that that real minimum shows itself every 11 years, i.e. that the Sun can’t get any more quiet than what it is at every solar minimum,.e.g. Schrijver et al. 2011 http://www.leif.org/EOS/2011GL046658.pdf :
“Therefore, the best estimate of magnetic activity […] for the least-active Maunder Minimum phases appears to be provided by direct measurement in 2008-2009. ” see also their Figure 2.
Legatus started his comment with: “It may be that we are talking about too short a time frame and “quiet sun” may be a relative term. Specifically, we came out of a Little Ice Age about 150 years ago. During that time, there was a Maunder Minimum and a Dalton Minimum…”
Please provide a link to any graph of a solar dataset and a global temperature dataset out of all those that appear on the web to illustrate your belief. Make sure your graph idenifies the source of the data. We can then discuss your beliefs from there.
Matt G says: “I can’t find a better explanation than global cloud albedo dropping 5 percent during the same period referred too in your post.”
Please identify the source of the 5% drop in cloud albedo you’re referring to.
Also, the fuel for El Nino events is provided by the reduction in cloud amount caused by La Nina events
Paul Vaughan says: “The spatiotemporal geometry isn’t what you (implicitly, not explicitly) assume with your solar comments.”
Care to elaborate?
Bob: Yes – as time permits over the months & years. My immediate concern this week: paid work. Best Regards.