By Joseph D’Aleo, CCM, AMS Fellow
The arctic ice appears to have bottomed out at a level 6.4% higher than the 2007 record. Mark Serreze of the National Snow and Ice Data Center says the Arctic could be ice-free in the summer by about 2030, though that is hard to predict; other scientists say it could be mid-century before that dramatic point is reached. The article continues Why does this matter? Ice that’s floating on the sea surface doesn’t raise the sea level when it melts. But researchers suspect it will alter the weather that reaches us far to the south. It’s already affecting Arctic wildlife.
Thousands of walruses that usually float around on sea ice and dive down to feed on the ocean floor abandoned those floes when the only ice left off the coast of Alaska was over water that was too deep. Walruses spend 2/3rds of their time in water and like the polar bear the talk of their demise will likely be proven wrong. Polar bear populations are at record highs. Here is today’s ice plot versus 2007.

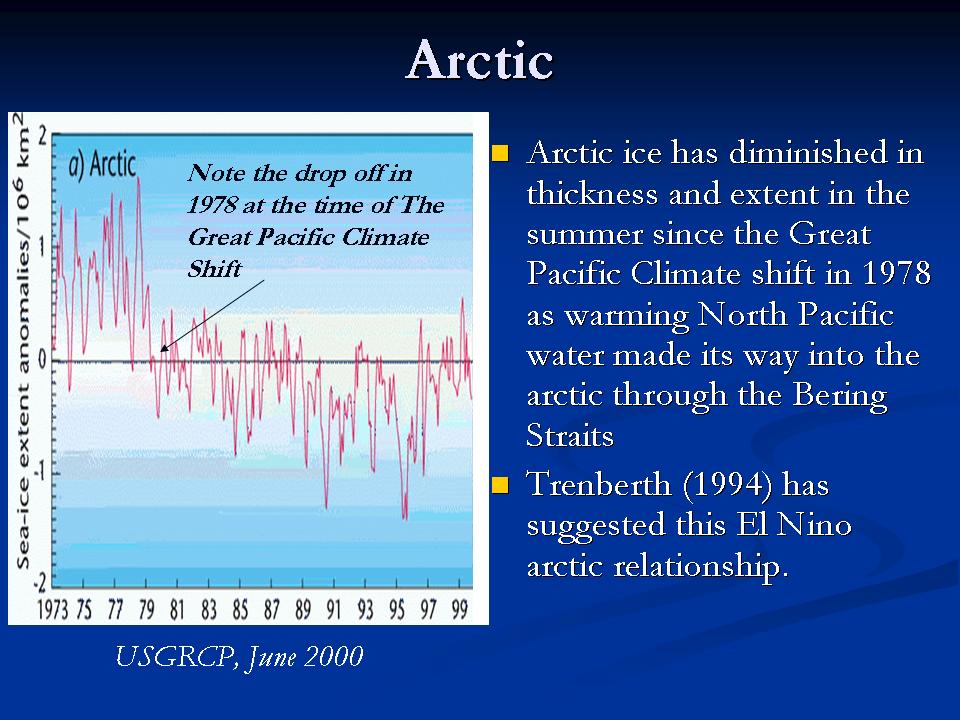
The temperatures in the arctic have indeed risen in recent years and ice has declined, bottoming out in 2007 but it is not unprecedented nor unexpected. The arctic temperatures and arctic ice extent varies in a very predictable 60-70 year cycle that relates to ocean cycles which are likely driven by solar changes. It has nothing to do with CO2, showing poor correlation and since cold open arctic ice is a significant sink for atmospheric CO2 just as warm tropical waters are the primary source.
In 2007, NASA scientists reported that after years of research, their team had assembled data showing that normal, decade-long changes in Arctic Ocean currents driven by a circulation known as the Arctic Oscillation was largely responsible for the major Arctic climate shifts observed over the past several years. These periodic reversals in the ocean currents move warmer and cooler water around to new places, greatly affecting the climate. The AO was at a record low level last winter explaining the record cold and snow in middle latitudes. A strongly negative AO pushes the coldest air well south while temperatures in the polar regions are warmer than normal under blocking high pressure. See post here.
We agree. And indeed both oceans play a role. In the record-setting (since satellite monitoring began in 1979) summer melt season of 2007, NSIDC itself before funding opportunist Serreze took over editorial control, noted the importance of both oceans in the arctic ice.
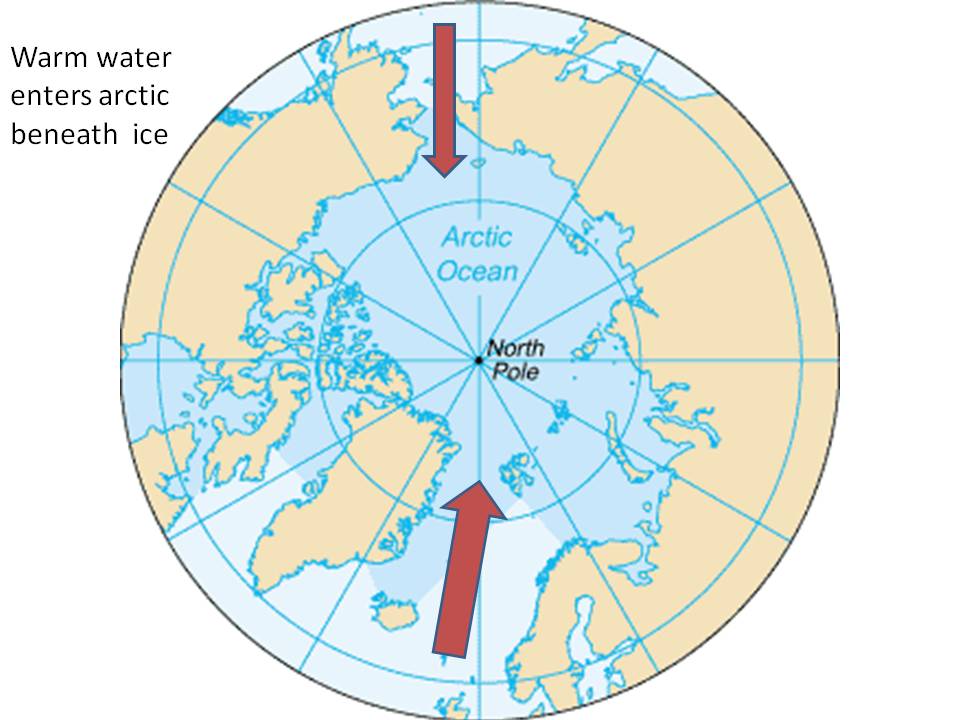
“One prominent researcher, Igor Polyakov at the University of Fairbanks, Alaska, points out that pulses of unusually warm water have been entering the Arctic Ocean from the Atlantic, which several years later are seen in the ocean north of Siberia. These pulses of water are helping to heat the upper Arctic Ocean, contributing to summer ice melt and helping to reduce winter ice growth.
Another scientist, Koji Shimada of the Japan Agency for Marine-Earth Science and Technology, reports evidence of changes in ocean circulation in the Pacific side of the Arctic Ocean. Through a complex interaction with declining sea ice, warm water entering the Arctic Ocean through Bering Strait in summer is being shunted from the Alaskan coast into the Arctic Ocean, where it fosters further ice loss. Many questions still remain to be answered, but these changes in ocean circulation may be important keys for understanding the observed loss of Arctic sea ice.”

Enlarged here.
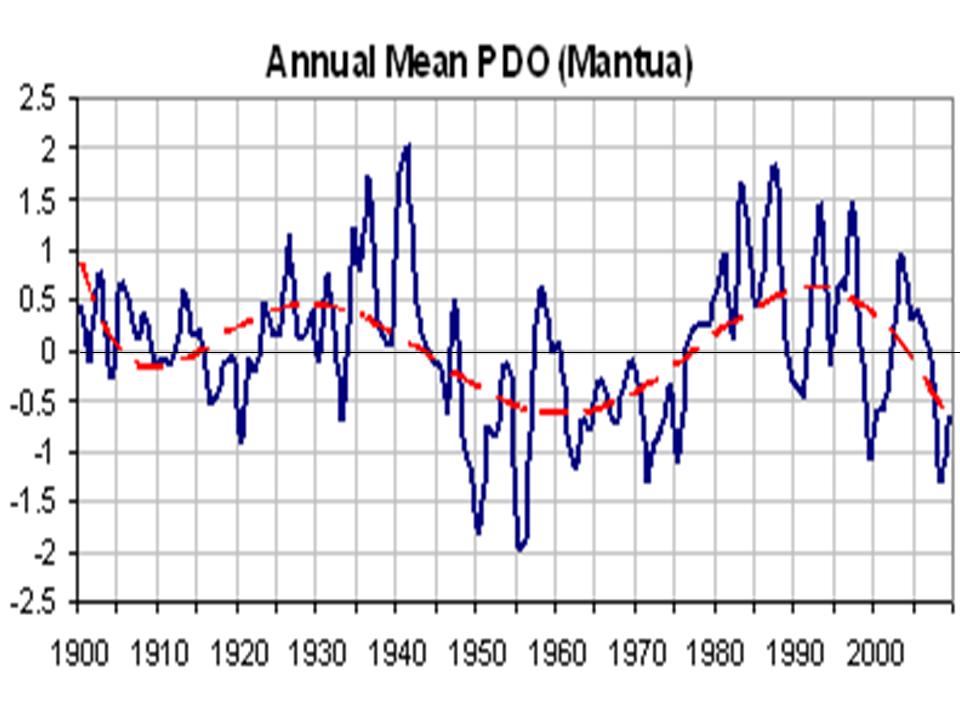
The Pacific warm mode favors more El Ninos and warmer water in the far northern Pacific including the Bering Straits. The PDO flipped into its warm mode in 1978 and the arctic temperatures began to warm and ice began to melt.

Enlarged here.

Enlarged here.
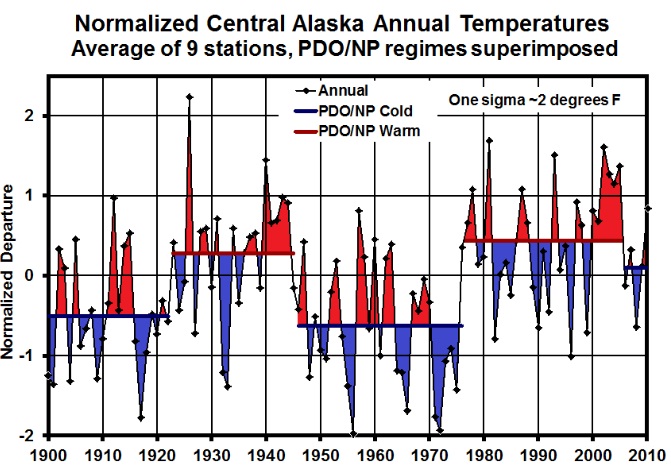
Notice how the temperatures in Alaska go through step changes tied to the PDO (Keen).

Enlarged here.
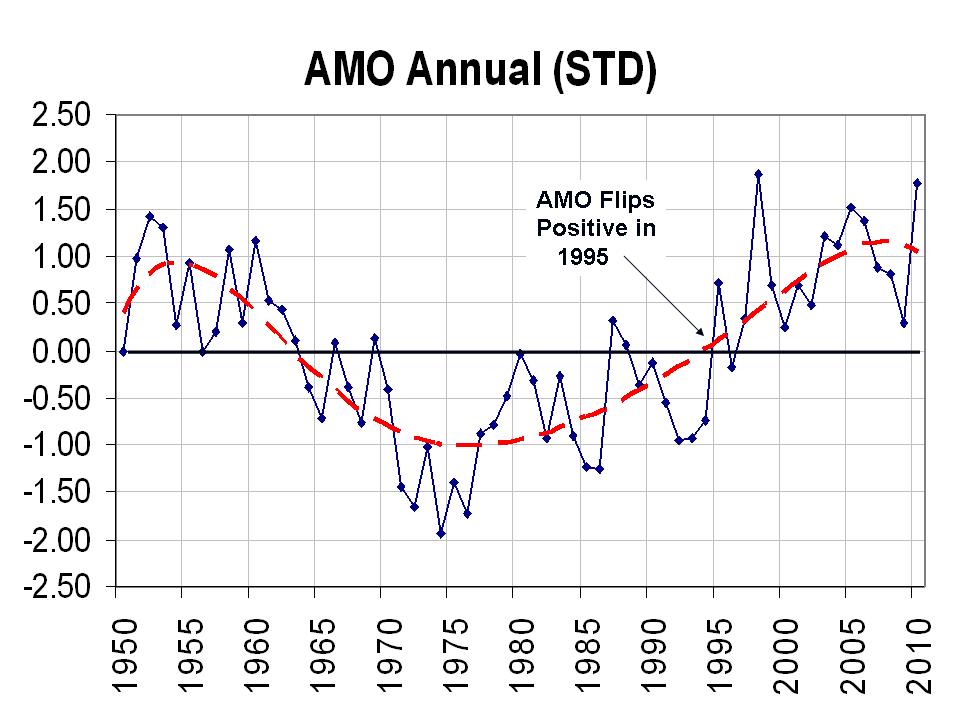
The Atlantic also cycles on a 60-70 year period. The Atlantic Multidecadal Oscillation or AMO returned to the positive warm mode in 1995.

Enlarged here.
Frances et al. (GRL 2007) showed how the warming in the arctic and the melting ice was related to warm water (+3C) in the Barents Sea moving slowly into the Siberian arctic and melting the ice. She also noted the positive feedback of changed “albedo” due to open water then further enhances the warming.
The International Arctic Research Center at the University of Alaska, Fairbanks showed how arctic temperatures have cycled with intrusions of Atlantic water – cold and warm.

Enlarged here.
The correlation was also confirmed by Juraj Vanovcan.

Enlarged here.
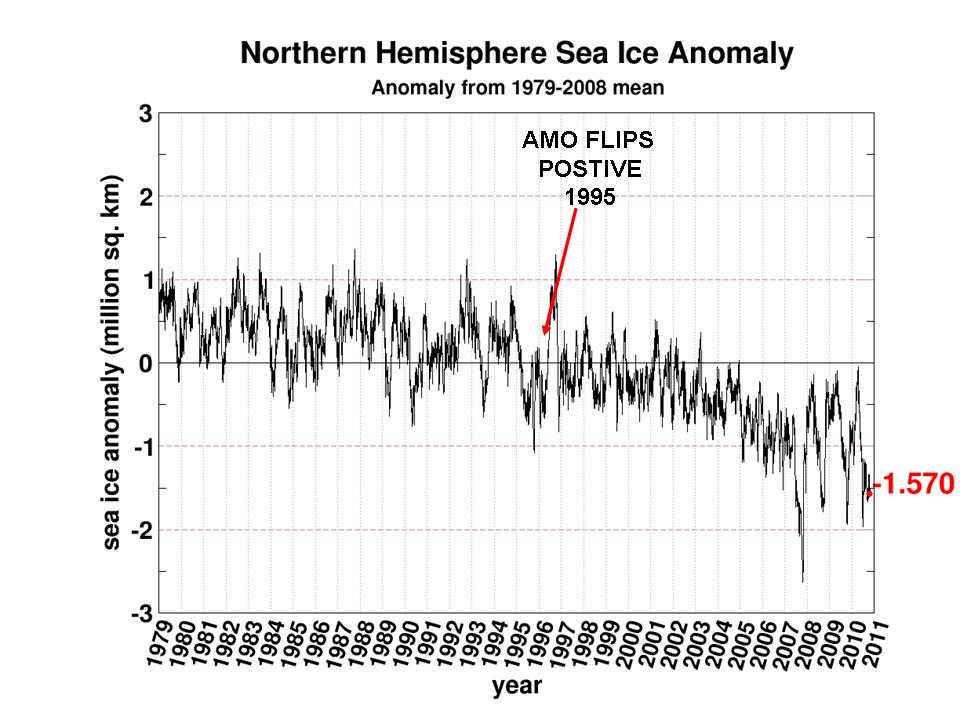
See how quickly the arctic ice reacts to warming of the Atlantic sea surface temperatures in 1995 (source Cryosphere Today). This marked a second leg down. We have seen large swings after the big dip in 2007 following a peak in Atlantic warmth in 2004-2005.

Enlarged here.
Although the PDO and AMO are measured differently, both reflect a tri-pole of ocean temperatures. Both have warm north and tropics and cool relative to normal in between in the positive phase and cold north and tropics and warm in between in the negative phase. By normalizing the two data sets and then adding the two, you get a measure of net warmth or cooling potential for both global and arctic temperatures. See how well the sum tracks with the arctic temperatures. Though we don’t have measurements of ice extent, there are many stories and anecdotal evidence that arctic ice was in a major decline from the 1920s to 1940s.

Enlarged here.
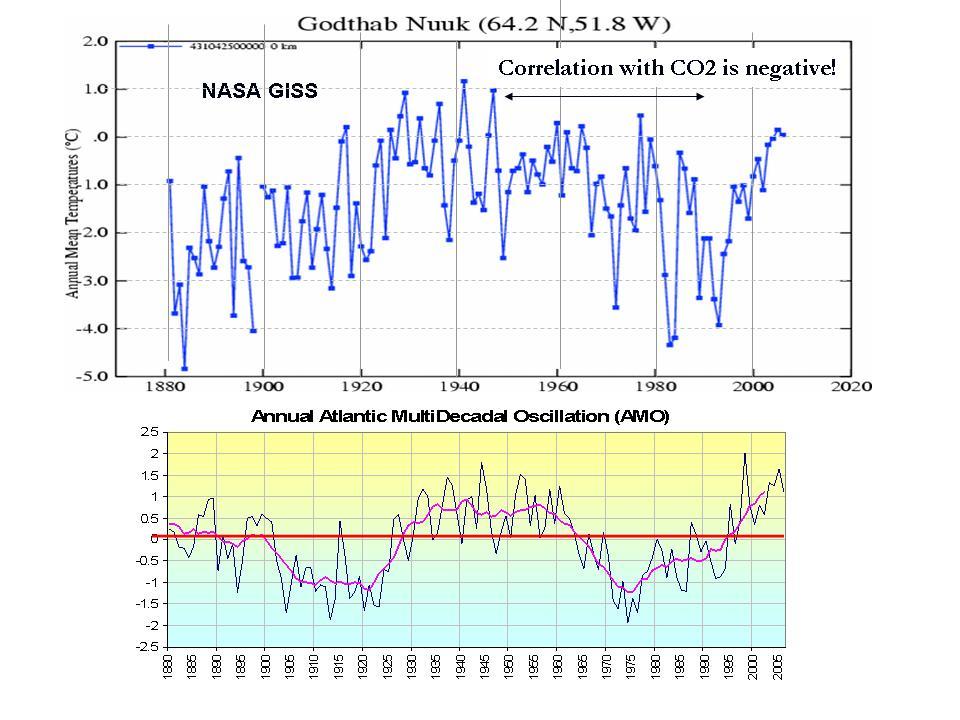
At the edge of the arctic Greenland behaves in the same way – with warming and cooling tied to the AMO.

Enlarged here.
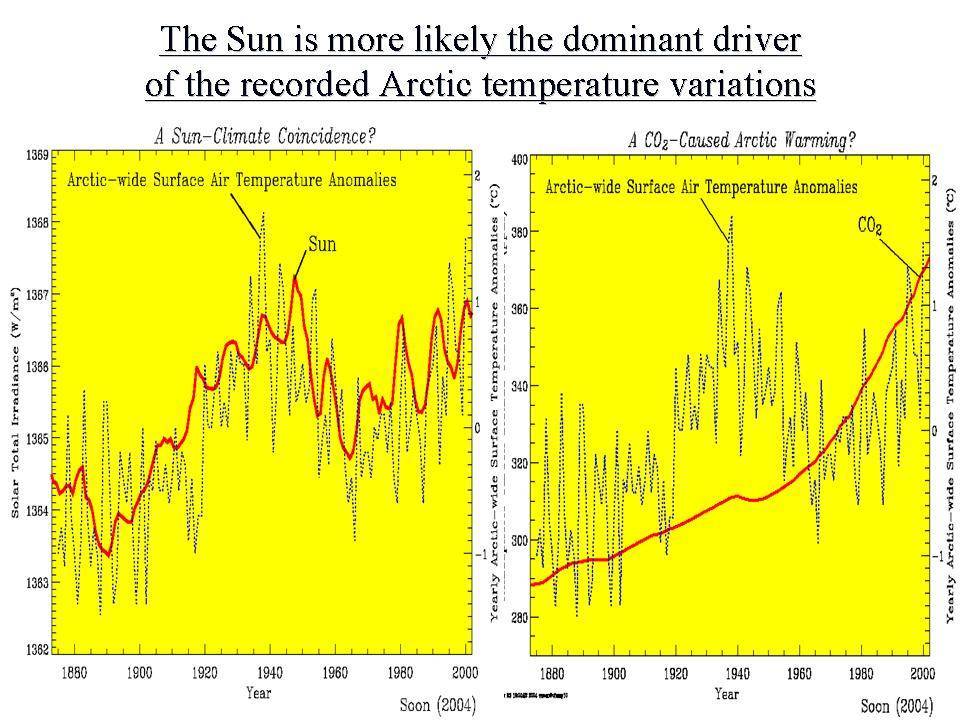
Dr. Willie Soon has shown how the arctic temperatures match the solar Total Solar Irradiance (Hoyt/Schatten/Willson) well. Correlation is poor with CO2.

Enlarged here.
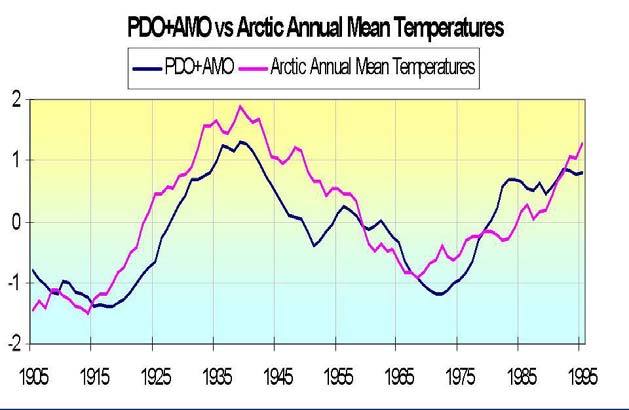
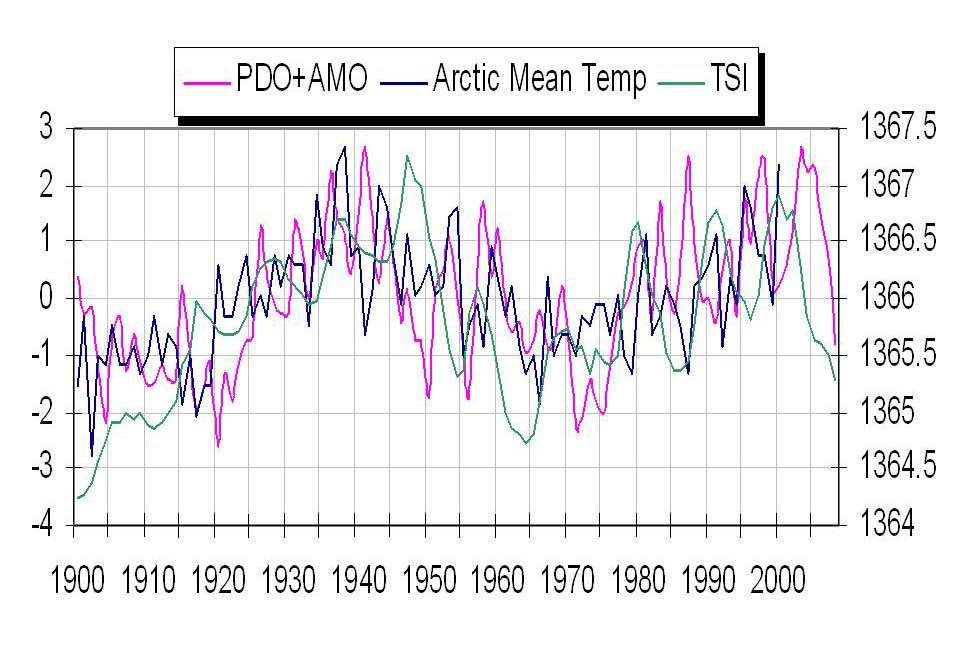
We see here how the annual TSI and annual PDO+AMO track together with arctic temperatures.

Enlarged here.
Though the current spike in the Atlantic temperatures and more high latitude blocking may cause another spike of melting in the next few winters as warm water from the AMO pop the last year works its way into the arctic, longer term you can expect arctic temperatures to decline and ice to rebound as the Pacific stays cold and the Atlantic cools and the sun stays in its 213 year Eddy minimum.
That doesn’t preclude some very cold and snowy winters short term. In 2008 glaciologist Bruce Molnia reported a bitterly cold Alaskan summer of 2008 following a La Nina winter with extreme cold and heavy snows resulted in area glaciers to expand, rather than shrink for the FIRST TIME IN RECORDED HISTORY. Summer temperatures, which were some 3 degrees below average, allowed record levels of winter snow to remain much longer, leading to the increase in glacial mass for the first time in at least 250 years.
See PDF here. See Verity Jones recent post on the arctic data here.

Enlarged here.
See more on glaciers and icecaps here.
See post by Arnd Bernaerts on Verity Jones’ Digging in the Clay here with much more on the arctic. See also here how the decade is almost up for the arctic ice disappearing here.
Also interesting that the minimum was 2 weeks earlier than 2007.
On a similar note, 1st snows of the season in Colorado high country this week :
Interesting and related paper by Polyakov, Walsh and Kwok published today, available here :
http://journals.ametsoc.org/doi/pdf/10.1175/BAMS-D-11-00070.1
Well worth a read, IMO.
Walruses sleep, mate, and nurse their young while in the water. They don’t need ice.
By 2030, not only will the Arctic not be ice free, it will have as much ice as in 1970. That is the bottom of the next cycle.
Hi,
The TSI Chart that is used is not what is considered the proper construction because it shows TSI varying by more than 3watts/M squared. I don’t see many other problems but you can still used the newer reconstructions to show it varies similar to the other indices.
Jim Arndt
It is all about the headline….Second lowest on record….missing that the record is only 4 years old and the whole record is only 30 years long.
How about doing a plot of polar bear and walrus populations versus ice cover ?
The post again raises the PDO plus AMO dataset. The two datasets cannot be added. I discussed this obvious and repeated error most recently here:
http://bobtisdale.wordpress.com/2011/06/08/on-the-amopdo-dataset/
It was also cross post here at WUWT.
Those stinking melt ponds can really mess up a good bias….can’t they
Joe D’Aleo writes: “Dr. Willie Soon has shown how the arctic temperatures match the solar Total Solar Irradiance (Hoyt/Schatten/Willson) well.”
The Hoyt and Schatten TSI reconstruction is obsolete. It was created to explain the warming in the early portion of the 20th Century. I understand that Hoyt no longer agrees with that reconstruction, yet it continues to be referenced and used in comparisons.
If one goes back 6-7000 years ago, there is evidence of an ice-free arctic and less ice than today. This also corresponds to evidence of higher temps.
http://www.ngu.no/en-gb/Aktuelt/2008/Less-ice-in-the-Arctic-Ocean-6000-7000-years-ago/
“One prominent researcher, Igor Polyakov at the University of Fairbanks, Alaska, points out that pulses of unusually warm water have been entering the Arctic Ocean from the Atlantic, which several years later are seen in the ocean north of Siberia. These pulses of water are helping to heat the upper Arctic Ocean, contributing to summer ice melt and helping to reduce winter ice growth.
Another scientist, Koji Shimada of the Japan Agency for Marine-Earth Science and Technology, reports evidence of changes in ocean circulation in the Pacific side of the Arctic Ocean. Through a complex interaction with declining sea ice, warm water entering the Arctic Ocean through Bering Strait in summer is being shunted from the Alaskan coast into the Arctic Ocean, where it fosters further ice loss. Many questions still remain to be answered, but these changes in ocean circulation may be important keys for understanding the observed loss of Arctic sea ice.”
There is substantial evidence that atmospheric oscillations and wind have a major influence on Arctic Sea Ice. In this October, 1 2007 NASA article;
http://www.nasa.gov/vision/earth/lookingatearth/quikscat-20071001.html
Son V. Nghiem of NASA’s Jet Propulsion Laboratory, said that “the rapid decline in winter perennial ice the past two years was caused by unusual winds. “Unusual atmospheric conditions set up wind patterns that compressed the sea ice, loaded it into the Transpolar Drift Stream and then sped its flow out of the Arctic,” he said. When that sea ice reached lower latitudes, it rapidly melted in the warmer waters.
“The winds causing this trend in ice reduction were set up by an unusual pattern of atmospheric pressure that began at the beginning of this century,” Nghiem said.”
Per this 2001 paper, “Fram Strait Ice Fluxes and Atmospheric Circulation: 1950–2000″ by Torgny Vinje published in the American Meteorological Society Journal of Climatet;
“The corresponding decadal maximum change in the Arctic Ocean ice thickness is of the order of 0.8 m. These temporal wind-induced variations may help explain observed changes in portions of the Arctic Ocean ice cover over the last decades. Due to an increasing rate in the ice drainage through the Fram Strait during the 1990s, this decade is characterized by a state of decreasing ice thickness in the Arctic Ocean.”
http://journals.ametsoc.org/doi/abs/10.1175/1520-0442%282001%29014%3C3508%3AFSIFAA%3E2.0.CO%3B2
This 2004 paper “Variations in the Age of Arctic Sea-ice and Summer Sea-ice Extent” by Ignatius G. Rigor & John M. Wallace, states that;
“The winter AO-index explains as much as 64% of the variance in summer sea-ice extent in the Eurasian sector, but the winter and summer AO-indices combined explain less than 20% of the variance along the Alaskan coast, where the age of sea-ice explains over 50% of the year-to year variability. If this interpretation is correct, low summer sea-ice extents are likely to persist for at least a few years. However, it is conceivable that, given an extended interval of low-index AO conditions, ice thickness and summertime sea-ice extent could gradually return to the levels characteristic of the 1980′s.”
http://seaice.apl.washington.edu/IceAge&Extent/Rigor&Wallace2004.pdf
This 2007 paper “Rapid reduction of Arctic perennial sea ice” by Nghiem, Rigor, Perovich, Clemente-Colo, Weatherly and Neumann states that;
“Perennial-ice extent loss in March within the DM domain was noticeable after the 1960s, and the loss became more rapid in the 2000s when QSCAT observations were available to verify the model results. QSCAT data also revealed mechanisms contributing to the perennial-ice extent loss: ice compression toward the western Arctic, ice loading into the Transpolar Drift (TD) together with an acceleration of the TD carrying excessive ice out of Fram Strait, and ice export to Baffin Bay.”
http://seaice.apl.washington.edu/Papers/NghiemEtal2007_MYreduction.pdf
This 2010 paper, “Influence of winter and summer surface wind anomalies on summer Arctic sea ice extent” by Masayo Ogi, Koji Yamazaki and John M. Wallace, published in Geophysical Research Letters states that;
“We have shown results indicating that wind‐induced, year‐to‐year differences in the rate of flow of ice toward and through Fram Strait play an important role in modulating September SIE on a year‐to‐year basis and that a trend toward an increased wind‐induced rate of flow has contributed to the decline in the areal coverage of Arctic summer sea ice.”
http://www.jamstec.go.jp/frcgc/research/d2/masayo.ogi/2009GL042356.pdf
This 2011 paper, “Recent wind driven high sea ice export in the Fram Strait contributes to Arctic sea ice decline”, submitted to The Cryosphere by L. H. Smedsrud, et al. used;
“geostrophic winds derived from reanalysis data to calculate the Fram Strait ice area export back to 1957, finding that the sea ice area export recently is about 25 % larger than during the 1960’s.”
http://www.the-cryosphere-discuss.net/5/1311/2011/tcd-5-1311-2011-print.pdf
” Iceshelves can melt NOT ONLY WITH HOT WATER BUT ALSO WITH CONC: DEICERS. Ocean analysis indicating that 7,100 p.p.m of Megnesium Chloride & 35,000 p.p.m Sodium Chloride are present at certain Oceans & Seas at certain time of year. As I have those datas since 1980, I will be only able to solve this Global Calamities. Welcome to visit Sarva Kala Vallabhan Group & Airconditioning of Mother Earth. & comment. Book publishing soon in US ” Environmental Rapes & H. R. Abuses Lead to Climate Change Control ” ( full color- 500 pages ) by Raveendran Narayanan.For more information Google Search Engine. : “Raveendran Narayanan” “Climate Change”
The post includes a comparison of the Godthab Nuuk Land Surface Temperatures and the AMO:
http://icecap.us/images/uploads/ARCTIC10.jpg
It’s pretty obvious that the two datasets have little in common other than a mid-century hump, but just in case it’s not that easy for you to see, here are the two datasets on the same graph with the AMO data scaled (multiplied by a factor of 5):
http://i55.tinypic.com/2w7kciq.jpg
The Godthab Nuuk data leads the AMO by a couple of decades for the early warming period, so it would be difficult for the “warming and cooling [to be] tied to the AMO” if the Godthab Nuuk temperatures rise for a few decades while the AMO is declining. And the AMO leads the Godthab Nuuk temperature anomalies by a few decades during the latter warming period. It’s tough to tie the AMO to the Godthab Nuuk temps during this period with that much of a lag.
The reality: the correlation coefficient for the two datasets on annual basis is only 0.39. That’s pretty poor.
“Notice how the temperatures in Alaska go through step changes tied to the PDO”
And I noticed that they started tracking Arctic ice at about the time it switched to the warm phase.
Hmm. 6.4% higher would be significant in and of itself, but the fact the minimum extent was reached two weeks earlier could be even more important.
However, since climate is what you expect, and weather is what you get, we’ll just have to wait and see.
Anything is possible says September 16, 2011 at 5:59 pm
Interesting and related paper by Polyakov, Walsh and Kwok published today, available here :
http://journals.ametsoc.org/doi/pdf/10.1175/BAMS-D-11-00070.1
Yes, very interesting:
“Between 2005 and 2008 (Figure 1), the Arctic Ocean lost 42% of its multiyear ice (MYI = ice which survives at least one arctic summer) coverage.”
“Much of the export is MYI. Data collected by the International Arctic Buoy Programme suggest that the thinning of the sea ice in the early to mid-1990s was attributable to an increase in ice area export through Fram Strait. Through that time period, this increased export has been linked to the positive phase of the Arctic Oscillation, which increases the cross-strait gradient in sea level pressure.”
“Interannual variability in sea-ice export through Fram Strait is significant, with a low of 516,000 km2 in 1984–85 and a high of 1,002,000 km2 in 1994–95. An anomalously large wind-driven export event (for example, the peak 1994–95 export) could have a long-lasting impact on the survival of the MYI ice cover, especially when large export events are superimposed on a warming trend.”
“Recent changes of arctic multiyear sea-ice coverage and the likely causes” by Igor V. Polyakov, Ronald Kwok, and John E. Walsh, 2011:
http://journals.ametsoc.org/doi/pdf/10.1175/BAMS-D-11-00070.1
I too, think the early refreeze is important…
For reference, here is the RSS Northern Polar Temperature:
ftp://ftp.ssmi.com/msu/graphics/tlt/plots/rss_ts_channel_tlt_northern%20polar_land_and_sea_v03_3.png
The warming trend is .339 C per decade. I am sure this warming influences some melt around the fringes of the Ice Pack, but it was obviously not the reason that “Between 2005 and 2008 (Figure 1), the Arctic Ocean lost 42% of its multiyear ice (MYI = ice which survives at least one arctic summer) coverage.”
This Sea Ice Thickness 30 day animation is helpful in visualizing sea ice transport through the Fram Straight;
http://www7320.nrlssc.navy.mil/hycomARC/navo/arcticict_nowcast_anim30d.gif
this 12 month Sea Ice Thickness animation gives a good view of the annual cycle;
http://www7320.nrlssc.navy.mil/hycomARC/navo/arcticict_nowcast_anim365d.gif
as does this 30 year Arctic Sea Ice extent animation:
Neven was nice enough to keep a play by play on this year’s Fram Strait Sea Ice Transport, e.g.
“Update August 8th: Added images from the previous three days. Some serious ice transport going on there. If this keeps up…”
“Update August 11th: Added images from the previous two days, and removed images from July. Transport is steaming full speed ahead.”
http://neven1.typepad.com/blog/2011/07/2011-fram-strait-animation.html
This 30 day Wind Speed and Drift Animation is helpful in understanding how atmospheric circulation and wind can transport multi-year sea ice through the Fram Straight.
http://www7320.nrlssc.navy.mil/hycomARC/navo/arcticicespddrf_nowcast_anim30d.gif
And this 12 month Wind Speed and Drift Animation help to see polar vortices form and spin out.
http://www7320.nrlssc.navy.mil/hycomARC/navo/arcticicespddrf_nowcast_anim365d.gif
Polar Vortices;
http://en.wikipedia.org/wiki/Polar_vortex
“are caused when an area of low pressure sits at the rotation pole of a planet. This causes air to spiral down from higher in the atmosphere, like water going down a drain.”
http://www.universetoday.com/973/what-venus-and-saturn-have-in-common/
Here’s an animation of the Arctic Polar Vortex in Winter 2008 – 09;
When a Polar Vortex breaks down it causes a Sudden Stratospheric Warming:
http://en.wikipedia.org/wiki/Sudden_stratospheric_warming
This animation helps to visualize Northern Hemesphere Atmospheric Circulation and the Arctic Oscillation (AO);
http://www.cpc.ncep.noaa.gov/products/intraseasonal/z500_nh_30d_anim.gif
and you can find a wide array of data and information on the AO and other Oscilations on the WUWT Atmospheric Oscillation page:
http://wattsupwiththat.com/reference-pages/atmospheric-oscillation/
I must admit, I tend to skim-read a lot of the scientific detail in some of these posts but, on a more hum-drum basis, what struck me as odd a few weeks ago was the spectacle of the Row To The Pole jokers dragging their boat across thick ice in late summer to get to an arbitrary ex-Magnetic North Pole position (from 1996), 790 miles south of the real North Pole.
The reason it struck me as being odd is that if there is still so much darn ice left at that time of year, and it’s 6.4% above the oft-quoted warmist ‘darling’ year of 2007, then something would have to seriously change to melt the last ~800 miles of ice, in order to have the ‘ice-free Arctic summer’ that the AGW brigade yearn for so badly.
Maybe I’m missing the point, but since things seem to be cooling down again, it strikes me as being a crack-pot idea drummed up to alarm people unnecessarily.
If global warming is causing the increase in Arctic ice melt how come the Antarctic Ice is increasing at .9% per decade?
It’s not difficult to understand…
http://www.skepticalscience.com/Why-is-Antarctic-sea-ice-increasing.html
http://www.newscientist.com/article/dn16988-why-antarctic-ice-is-growing-despite-global-warming.html
http://www.nasa.gov/vision/earth/environment/sea_ice.html
But don’t fret janama, it’s only a temporary phenomenon.
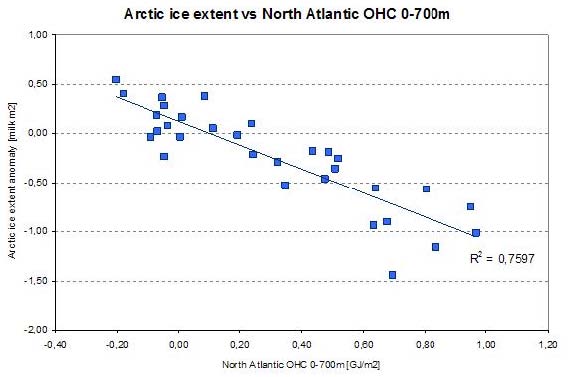
We see that the correlation between the arctic ice-concentration and the Upper Ocean Heat Content (OHC) of the waters northward 60N during summer (April….September) is very tight http://climexp.knmi.nl/data/g20110914_0943_17033_4.png .
Now we calculate the difference between the temperatures of the nordic extratratropics ( northward of 25 N) and the southward extratropics ( southward of 25S) and compare this value with the OHC 60N…90N we find a good coincidence: http://www.dh7fb.de/noaice/ohcamo.gif .
The detrended correlation with yearly smoothed data is 0,6.
The value (N ext – S ext) has a very similar pattern to the AMO and it could describe the transport of heat poleward from the tropics in a global view and not only in the atlantic bassin.
Data: T HadCRUT3, OHC: NODC heat content 0-700m , available via http://climexp.knmi.nl/selectfield_obs2.cgi?someone@somewhere .
Bob Tisdale says:
September 16, 2011 at 6:29 pm
The post again raises the PDO plus AMO dataset. The two datasets cannot be added. I discussed this obvious and repeated error most recently here:
http://bobtisdale.wordpress.com/2011/06/08/on-the-amopdo-dataset/
It was also cross post here at WUWT.
Hi Bob, I’ve asked this question before but not seen a reply from you:
“Why doesn’t someone produce datasets of these major oceanic oscillations which can be compared and added?”
Seems like a no-brainer to a layman. It’s almost as if the climate community doesn’t want to know the answers…
Bob Tisdale says:
September 16, 2011 at 6:42 pm
Joe D’Aleo writes: “Dr. Willie Soon has shown how the arctic temperatures match the solar Total Solar Irradiance (Hoyt/Schatten/Willson) well.”
The Hoyt and Schatten TSI reconstruction is obsolete. It was created to explain the warming in the early portion of the 20th Century. I understand that Hoyt no longer agrees with that reconstruction, yet it continues to be referenced and used in comparisons.
True, but unimportant. Soon has also demonstrated that sunshine hours correlates well with surface temperature elsewhere. Small variations in TSI are apparently amplified by terrestrial feedbacks, as demonstrated by Nir Shaviv in his JGR paper “Using the oceans as a calorimeter”.
Well, I think our friend Joe is just going to copy/paste that same post every year
http://wattsupwiththat.com/2010/11/01/arctic-temperatures-and-ice-%E2%80%93-why-it-is-natural-variability/
Looks similar, no?
Tallbloke says: “True, but unimportant. Soon has also demonstrated that sunshine hours correlates well with surface temperature elsewhere.”
Elsewhere does not help this post.
tallbloke says: “Why doesn’t someone produce datasets of these major oceanic oscillations which can be compared and added?”
I don’t recall seeing this question before, tallbloke. Let me reply with a question. Why not simply plot the sea surface temperature anomalies of the combined dataset and then detrend them as necessary? All of the major SST anomaly datasets are available through the KNMI Climate Explorer. It only takes a few moments to go to the website, select the dataset, input the coordinates and download the data.
“National Snow and Ice Data Center says the Arctic could be ice-free in the summer by about 2030, though that is hard to predict; other scientists say it could be mid-century before that dramatic point is reached. ”
All the various ice charts have a similar pattern where maximum melt starts, which from my humble observations looks to start around June 1st at an average rate of 1mil square k/10 days for around 60 days. Thats a maximum rate of around 6 mil square K. To get to ice free the ice would need to get down to around 2 mil sq k by August. Which means the start point needs to be 2 mil square k lower and therefore maximum ice needs to be lower . The difference between max and min appears to be between 8 and 10 mil sq k, so the start point for an ice free arctic would need to be a max area/extent of around 8 / 10mil sq k. IMHO
How possible is that?
Correction:
since cold open arctic ice
Is wrong. It should read;
since cold open arctic water
It has nothing to do with CO2, showing poor correlation and since cold open arctic ice is a significant sink for atmospheric CO2 just as warm tropical waters are the primary source.
———-
Badly expressed. Seems to have started a line of thought and then gone off on a tangent so that the whole does not make sense.
The AO was at a record low level last winter explaining the record cold and snow in middle latitudes
——–
So a 60-70 year long cycle can explain both record cold in winter and record warmth in summer at the same time?
I guess I am conflicted. I like the fact that mother nature is making fools of the alarmist so-called scientists. I enjoy seeing their predictions fail.
But I must admit I would like to see the planet warm about 4 degrees or more. Warm is good; cold is not.
When the Arctic warms, the Antarctic cools? That’s why it’s called “Ant-“. 😀
Coincidentally one of the guys from that row to the poll expedition – you know the one that didn’t make it because of the ice – is going to be (or has been if you are reading this later) on BBC R4 this morning (Saturday 17th).
http://www.bbc.co.uk/programmes/b014lzg7
The interviewer John McCarthy likes his travellers who also “campaign about global warming” so I doubt there will be a question about whether they made it or not. He was one of the two Brits held in Beirut for a long time in the 1980s.
Sorry, I pasted this comment accidentally into the other tread.
In the North Atlantic is not so much ‘global warming’ as the redistribution of the available heat energy. The N. Atlantic warm drift current splits into 2 branches; http://wattsupwiththat.files.wordpress.com/2011/08/ocp07_fig-6.jpg?w=600&h=473
higher the Atlantic inflow across the Greenland-Scotland ridge warmer the Arctic.
In contrast the Arctic’s cold waters overflow will eventually cool US Atlantic coastline.
It is to do with strength of the Subpolar gyre, complex system of currents located to the south of Greenland, that circulates anticlockwise between 50°N and 65°N.
Subpolar gyre is the engine of the heat transport across the North Atlantic Ocean, and is the essential component of the northern Atlantic basin’s climate system.
This is clearly shown in the dataset (I assembled just over a year ago)
http://www.vukcevic.talktalk.net/SST-NAP.htm
and goes back to 1650
http://www.vukcevic.talktalk.net/CDr.htm
If correct it shows that the N. Atlantic area will cool in forthcoming decade or two.
Bob Tisdale says:
September 16, 2011 at 7:50 pm
………………
Hi Bob
Re your comment from the other day: It is from the North Atlantic SST showing difference between summer JJA and winter JFM months:
http://www.vukcevic.talktalk.net/Data.htm
Joe, in the same 2007 article that you refer to as “before funding opportunist Serreze took over editorial control”, NSIDC writes :
Climate models have long told us that as greenhouse warming takes hold, rises in surface temperature over the Arctic Ocean will be especially large compared the rest of the Northern Hemisphere. A key part of this so-called “arctic amplification” is the growing impact through time of the very process just described.
http://nsidc.org/arcticseaicenews/2007.html
So besides an unsubstantiated ad hominem at Serreze, your claim that “It has nothing to do with CO2” has no scientific basis at all and contradicts not just our understanding of Arctic amplification, but even radiative transfer theory itself. Do you have any science to back up your rather unorthodox statement that “It has nothing to do with CO2” ?
before funding opportunist Serreze took over editorial control,
——–
Gratuitous ad hominem. Roger doesn’t approve of that.
““One prominent researcher, Igor Polyakov at the University of Fairbanks, Alaska, points out that pulses of unusually warm water have been entering the Arctic Ocean from the Atlantic, which several years later are seen in the ocean north of Siberia. These pulses of water are helping to heat the upper Arctic Ocean, contributing to summer ice melt and helping to reduce winter ice growth.”
The Atlantic Ocean continues to widen by several cm per year. Therefore the ocean gap between Greenland and Norway is widening also. Also I thought the gulf stream was weakening?
Just The Facts says:
September 16, 2011 at 8:26 pm
“Between 2005 and 2008 (Figure 1), the Arctic Ocean lost 42% of its multiyear ice (MYI = ice which survives at least one arctic summer) coverage.”
I am unable to find anywhere a measurement of what the max expected age of MYI. The only definition is the one above, which would mean that as all the ice cannot be melted in one season (yet) movement of ice out of the Arctic is a massive contributor to the yearly melt season. As has been stated by several commentators previously. Conversely the Antarctic has no multi-year ice.
‘Thousands of walruses that usually float around on sea ice and dive down to feed on the ocean floor abandoned those floes when the only ice left off the coast of Alaska was over water that was too deep’
I wonder what research is available to show the limit of the walrus’s abililty to feed off the sea bed,
and is there only deep water in sea areas away from land?.
——
That is a pretty signicant curve upwards in the graph and is not likely to change back if the cold has arrived two weeks early. Let’s hope the figures show a dramatic increase in ice cover over the next few weeks, the reduction of which, in recent years, has been the lynch pin upon which the false arguments supporting AGW is the means by which the cult have succeeded in spreading their scare stories. Trenbeth, Hanson, Mann et al must be having a pretty miserable time having read the latest Arctic Ice stats.
Rob asked Joe D’Aleo: “So besides an unsubstantiated ad hominem at Serreze, your claim that ‘It has nothing to do with CO2’ has no scientific basis at all and contradicts not just our understanding of Arctic amplification, but even radiative transfer theory itself. Do you have any science to back up your rather unorthodox statement that ‘It has nothing to do with CO2’ ?”
Polar amplification occurs regardless of the cause of the rise or fall in surface temperatures.
http://bobtisdale.wordpress.com/2011/01/15/notes-on-polar-amplification/
If you don’t want to believe the data I’ve presented, you can refer to the following RealClimate post:
http://www.realclimate.org/index.php/archives/2007/12/tropical-troposphere-trends/
There RealClimate notes, “They both have the same enhancement in the tropics and similar amplification in the Arctic.” And they continue, “If the pictures are very similar despite the different forcings that implies that the pattern really has nothing to do with greenhouse gas changes, but is a more fundamental response to warming (however caused).”
I presented this in an earlier post on polar amplification:
http://bobtisdale.wordpress.com/2009/06/06/another-look-at-polar-amplification/
Regards
Looking at arctic ice anomaly, arctic ice seems to be declining much slower (if at all) since 2007. That’s not only about minima but about the whole anomaly.
And if we consider that arctic would become completely iceless, wouldn’t it act like very powerful cooler due to change to the albedo?
The extra heat pumped into the oceans by three rampant solar cycles is dissipating into the arctic. The open waters allow huge amounts of heat to be swallowed by the night sky. One decade is about the life cycle of of extra heat until it meets the ice. The sun has been dozing for around a decade and the oceans are now cooling, so no new heat in the pipe line, throw in a double dip La Nina and your tomatoes will have problems. May the fire gods be appeased for one or two large volcanoes in the coming years will be painful. Nit picking about the science that makes which ocean current go where and why is irrelevant when it can be measured.
Our world tries it’s darndest to maintain an equitable temperature with an unplumbed heat pump activated by the sun using water as a refrigerant. The perturbations that disturb the system are many and varied as shown by thousands of scientific papers. There are leads and lags in the system but the Earth does a pretty good job of keeping us alive. The time has come for an holistic look at how our Earth operates, an overview without bias or political agenda.
Holistically the melting of arctic ice is the world ridding itself of excess heat in the oceans, it has worked a treat as the oceans are no longer rising or getting hotter. The inertia in the system will with lessor heat imput overshoot, and as JOE says we will get colder for a time.
.
“What it’s telling us is that the long-term decline in Arctic sea ice is continuing, and even appears to be accelerating at this point,” he says.
Sounds to me like Serreze is in denial. I guess he’s still hoping for a miracle to save his “arctice ice death spiral”.
Interesting how they’ve latched onto walruses now, since polar bears didn’t work out so well for them.
Trevor Johansen (@TJexcite) says:
It is all about the headline….Second lowest on record….missing that the record is only 4 years old and the whole record is only 30 years long.
The latter being especially significent if there is a 60-70 year cycle involved. You’d really want a record of at least 120-140 years!
Bob Tisdale says:
The Hoyt and Schatten TSI reconstruction is obsolete. It was created to explain the warming in the early portion of the 20th Century. I understand that Hoyt no longer agrees with that reconstruction, yet it continues to be referenced and used in comparisons.
In other words it’s a mathematical/computer model. One of the people who created it thinks they got it wrong. So it probably is of little practical use.
Trenbeth, Hanson, Mann et al must be having a pretty miserable time having read the latest Arctic Ice stats
They never believed one word of what they said. They are not in it for the science but for the political prestige and money.
“What it’s telling us is that the long-term decline in Arctic sea ice is continuing, and even appears to be accelerating at this point,” Serreze
==================================================================
We are all being played for fools…..
When you allow the very people claiming it’s not normal……to define what is normal.
example: Look at where the ‘normal’ ice boundary line is drawn on their maps….
…and stop and think about natural variability
Russians would have never built sea ports there….
…if that were truly Arctic ice extent…..there would have been years that they couldn’t even get to their sea ports
Once they got away with defining what is normal…..it’s easy to make the science fit that
janama says:
If global warming is causing the increase in Arctic ice melt how come the Antarctic Ice is increasing at .9% per decade?
In the Arctic you have an ocean surrounded mostly by land. If you look at the Arctic circle on a globe you will find a lot of land, quite a bit of the water consists of lakes and bays rather than ocean. In the Antarctic you have land surrounded by ocean. If you look at the Antarctic circle you will find virtually all ocean. The peninsula is the only part of Antarctica which extends significently to the North.
The Arctic and Antarctic are very much “polar opposites”.
Bernard J. says:
September 16, 2011 at 11:47 pm
Actually, I read your links and apparently it is difficult to understand. One blames the ozone hole, one blames changes in ocean circulation, and the other blames increases in precipitation (which is related to ocean circulation). Also, the second link had this quote at the end:
Well, at least some people are honest. The deal is, some GCMs since the early 90s have shown Antarctic ice to grow, but attribution of this even in the model is sketchy. In real life, attribution for both the Arctic and Antarctic hasn’t been accomplished. And while CAGWers may love to say the Antarctic growth is caused by circulation changes and the like, they seem to turn a deaf ear when a skeptic says that the Arctic losses could be due to the same or when changes at either pole might be due, in part or in full, to natural processes.
-Scott
Good Job wayne Job!..Liked your post!
Stephen Skinner says: September 17, 2011 at 2:49 am
I am unable to find anywhere a measurement of what the max expected age of MYI. The only definition is the one above, which would mean that as all the ice cannot be melted in one season (yet) movement of ice out of the Arctic is a massive contributor to the yearly melt season. As has been stated by several commentators previously.
I don’t know of any way to measure “max expected age” per se, as while “First-year and multiyear ice have different electromagnetic properties that satellite sensors can detect, allowing scientists to distinguish the two.”;
http://nsidc.org/seaice/characteristics/multiyear.html
estimating the age of muiltyear ice requires tracking movement, analysis and modeling. Furthermore, “max expected” would be based on such a brief time period, i.e. since 1979, as to offer an insignificant basis for maximum expectations.
However, in “Distribution and trends in Arctic sea ice age through spring 2011” by James Maslanik, Julienne Stroeve, Charles Fowler and William Emery, 2011, used an “Analysis of a satellite-derived record of sea ice age for 1980 through March 2011 shows continued net decrease in multiyear ice coverage in the Arctic Ocean, with particularly extensive loss of the oldest ice types. The fraction of total ice extent made up of multiyear sea ice in March decreased from about 75% in the mid 1980s to 45% in 2011, while the proportion of the oldest ice declined from 50% of the multiyear ice pack to 10%.”
http://www.agu.org/pubs/crossref/2011/2011GL047735.shtml
In “Recent changes of arctic multiyear sea-ice coverage and the likely causes” by Igor V. Polyakov, Ronald Kwok, and John E. Walsh, 2011:
At the end of the 2010 summer, only 15% of the ice remaining in the Arctic was more than two years old, compared to 50 to 60% during the 1980s. There is virtually none of the oldest (at least five years old) ice remaining in the Arctic (less than 60,000 km2 compared to 2 million km2 during the 1980s). Between 2005 and 2008 (Figure 1), the Arctic Ocean lost 42% of its multiyear ice (MYI = ice which survives at least one arctic summer) coverage.
http://journals.ametsoc.org/doi/pdf/10.1175/BAMS-D-11-00070.1
“Sea Ice Cover” by D. Perovich, W. Meier, J. Maslanik, and J. Richter-Menge offers several good graphics on Sea Ice Age towards the bottom:
http://www.arctic.noaa.gov/reportcard/seaice.html
In “Variations in the Age of Arctic Sea-ice and Summer Sea-ice Extent” by Ignatius G. Rigor & John M. Wallace, they used a model to estimate Arctic Sea Ice Age from 1984 – 2002, and the resultant graphics can be found on pages 2 and 3:
http://seaice.apl.washington.edu/IceAge&Extent/Rigor&Wallace2004.pdf
Conversely the Antarctic has no multi-year ice.
This is not true. “Multiyear ice is much more common in the Arctic than in the Antarctic. This is because ocean currents and atmospheric circulation move sea ice around Antarctica, causing most of the ice to melt in the summer as it moves into warmer waters, or as the upper ocean heats up due to absorption of solar heat by open water areas. Most of the multiyear ice that does occur in the Antarctic persists because of a circulating current in the Weddell Sea, on the eastern side of the Antarctic Peninsula.”
http://nsidc.org/seaice/characteristics/multiyear.html
The portion of Antarctic Sea Ice that remains each year can be seen here:
Serreze and others are talking about the Arctic sea ice melting out in the summer as early as 2030 (others have even said 2013 but that was obviously an unphysical exggeration).
Serreze and others are fitting polynomial functions to the sea ice minimum which is where they get the 2030 or 2045 from. But this is also unphysical and I will show you why.
Here are the trends in Arctic sea ice since 1972. We start the year out with sea ice at about 14.0M km2; there is a little over 9.0M km2 of melt during the season and we have minimum in mid-September of around 5.0M km2.
http://img850.imageshack.us/img850/5617/nhseasonaltrends2011.png
The March Maximum is slowly declining, the Melt during the season is slowly increasing and the September Minimum is decreasing a little faster (being the combination of those other two factors).
If we take these as linear lines, there is still sea ice left in the summer by 2100.
http://img199.imageshack.us/img199/9575/nhseasonaltrendsto2100.png
But Serreze and others note that the sea ice Minimum looks more like a polynomial function (the R^2 for a 2nd Order polynomial is actually a little higher than the linear one and the 3rd Order Poly is even higher than both). So it we extend those functions out for 25 years, we get no sea ice in 2030 or 2050 or something.
But if we extend those functions forwards “and backward” in time, we get sea ice doing all kinds of wierd things which means global warming resulting in a Poly is not the true trend or that there is some other unusual cycles that do not match the history. The Polys cannot be justified.
2nd order then 3rd order.
http://img198.imageshack.us/img198/7831/nhseastrpoly.png
http://img839.imageshack.us/img839/5459/nhseastr3poly.png
@De’Aleo
“It has nothing to do with CO2, showing poor correlation and since cold open arctic
icewater is a significant sink for atmospheric CO2 just as warm tropical waters are the primary source.”Fixed it for ya!
Yes, I cant wait until 2012 and 2013, when we finally break that 2007 minimum. So alarmists can begin to claim victory while the rest of us know that in 10 years, the arctic ice will grow to above its 30 yr average. Of course, this is all based on speculation and no facts, much like 90% of the comments here. I like the hand picked facts, and throwing around comments like “oooh, 2007 minimum is only 30 years old” and “ooh we’re in recovery, up 6.5%”.
People, read a bit. understand volume, extent and area, and the differences and significances of these. The next few years should be interesting. Low volume, increased activity due to solar cycle, weather patterns coinciding… 2007 was a one-in-10 year weather pattern. Hm, that gives us about 6 years within which to statistically repeat that.
Consider lowest arctic extent, area, and volume in the last 5 years, out of a minimum 30yr average, add to that solar cycle and weather pattern. What do you all think you will get? I expect a bombardment of fact-free opinion and little evidence or reference to observable and recorded trends.
Anyway, there are better sites with more data out there. SKip over scientific info if you like, but dont blame anyone else when your wake up call isnt what you expect it to be.
HAHA, I’ve been labelled an alarmist. Cute.
I really wish you would not state solar/temp cycle connections unless you also state your mechanism. Your rest of your article goes on to explore connections with natural intrinsic variability and drivers but does not mention your main opening statement related to solar changes. In my opinion the underlying mechanism has yet to be shown or given rigorous peer review. Correlations are weak when considering longer time spans.
However, since your included your solar connection position, a better way to state what you said, that “…The arctic temperatures and arctic ice extent varies in a very predictable 60-70 year cycle that relates to ocean cycles which are LIKELY [my emphasis] driven by solar changes…”, would be to say, “…which MAY be connected to solar changes as one of the drivers.” By saying it thusly, you would be free to include your proposed mechanism without suffering accusations of unfounded statements.
Kasuha, what extra rampant solar heat? Do you have comparative numbers for that, measured above Earth’s atmosphere (Earth’s atmosphere has a habit of varying the amount of solar heat that reaches the Earth’s surface)? I don’t recall any solar scientist stating that the Sun has been extra and unusally hot to the extent that the Earth would notice.
Lazyteenager, yes it can. Dry air is both warmer and colder. Let me explain. When there is little evaporation going on, the air is dryer. And a slow down in evaporation means that the air is colder, not warmer. How do I know? Warm air causes the oceans to cough up water vapor when the air is warmer than the ocean. Cold air slows down this process, resulting in less water vapor. A cold ocean combined with cold dry air is a killer.
And now for the warmer part. When this dryer air moves over land, this translates into seasonally higher day time summer temps (solar heat is not reflected away by water vapor) with cooler nights, and bitter cold day and night winter temps (stronger radiative cooling in the absence of water vapor), just like the daily change in dry desert temps.
It is during these conditions that you can get a huge spread between maximum and minimum temps in a single spring or fall day in the Western half of the US, as much as a 70 to 80 degree difference. So yes dryer air can be both warmer and colder.
Just The Facts says:
September 17, 2011 at 7:50 am
Thank you. I was obviously not looking hard enough.
Pamela Gray says:
September 17, 2011 at 8:55 am
=====================================
Pamela, thank you for that!
I was having a hard time with it too……….
Alarmist says:
September 17, 2011 at 8:15 am
I expect a bombardment of fact-free opinion and little evidence or reference to observable and recorded trends.
Thanks for giving us one.
Accusations of cherry picking from the sidelines:
http://tamino.wordpress.com/2011/09/17/cold-cherries-from-joe-daleo/
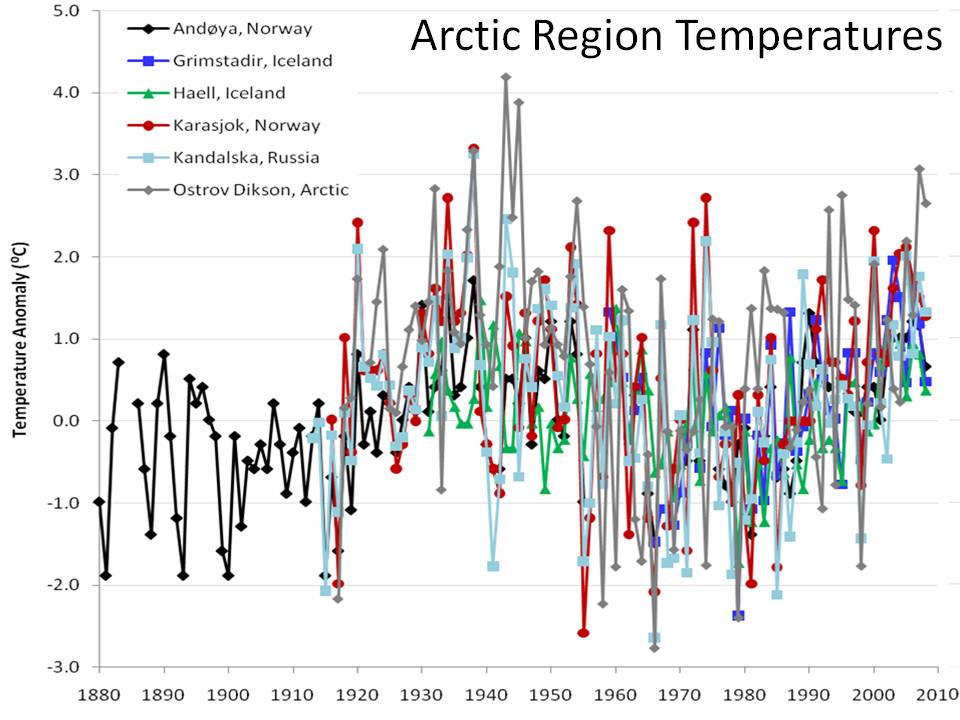
The plot of Arctic temperature in D’Aleo’s post uses only a very small subsection of available data, and happens to show the mid-20th century being warmer than the present. This isn’t a result that you get when looking at all available 137 Arctic stations, rather than just D’Aleo’s 6.
If there is a strong case to be made, it should be possible to make it without this sleight-of-hand. Including more data can ONLY make conclusions more robust, even if it takes away some of the ‘wow’ factor. This is the kind of thing that makes me highly suspicious of D’Aleo’s motives. Is he trying to make a robust case, or a weak, unscientific case that might make you go ‘wow’ at first but doesn’t stand up to scrutiny?
A good WUWT posting, nearly one year ago:
http://wattsupwiththat.com/2010/10/25/soot-ahoy-ship-traffic-in-the-arctic/
I believe that ocean traffic through the Arctic has had a greater influence on loss of ice than has been acknowledged by the hockey team. Certainly, the Russians find cross-Arctic shipping to be to their advantage! We are probably looking at the “new normal,” with Arctic sea ice extent around 4 M sq.km. minimum. I doubt we will ever get to an ice-free Arctic, unless the icebreakers really go at it.
Pamela Gray says:
September 17, 2011 at 8:55 am
I have found examples of diurnals in N. Calif. reaching 70 degrees. Most times, it ranges from 50 to 60 degrees. The 70 degree diurnals are found exclusively in the 1930’s. It was bad.
Stu N says:
September 17, 2011 at 5:13 pm
Quite possibly right…I should look into the details. But Tamino knows cherries well himself, particularly on this topic. Do a search on his site for “Bremen”. You’ll find one posting…one where he points out how Bremen set a record low in ice extent this year. Not once in all his other ice postings has he mentioned or shown the Bremen data (at least to my knowledge, agreeing with the search on his site…please let me know if this assertion is otherwise in error). Also, he’s almost always focused on monthly data because it avoids the daily noise…yet he calls out this daily record even though there’s a fair chance even Bremen won’t show 2011 as the record low for the monthly average?
-Scott
CRS, Dr.P.H. says:
September 17, 2011 at 5:20 pm
I concur. The effect of increased shipping and ice-breakers on sea-ice extent minima is certainly worthy of investigation. It would be an ideal topic for a PHd. thesis, IMO.
Trouble is, where is the funding going to come from? Environmentalists don’t want to hear that Arctic Ice decline is caused by anything other than CO2, while “Big Oil” want to open up the area for exploitation, ideally without be accused of destroying the ice.
BTW, Scott. Notice the slight drop in the IJIS extent yesterday? A bit more support for my “secondary minmum” theory.
Wriggly lines cause Global Warming.
“You’ll find one posting…one where he points out how Bremen set a record low in ice extent this year. Not once in all his other ice postings has he mentioned or shown the Bremen data (at least to my knowledge, agreeing with the search on his site…please let me know if this assertion is otherwise in error). Also, he’s almost always focused on monthly data because it avoids the daily noise…yet he calls out this daily record even though there’s a fair chance even Bremen won’t show 2011 as the record low for the monthly average?”
Yes, I think that’s Tamino’s only mention of Bremen data. And it was only briefly mentioned in a post where says how busy he’s been. Perhaps if he had more time he’d have qualified the statement more. Still, in the same post he mentions lots of other datasets, some of which indicate a record low, and some which don’t. Can that really be called deliberate cherry-picking?
That’s a high standard to hold him to, I reckon.
Anything Possible:
“The effect of increased shipping and ice-breakers on sea-ice extent minima is certainly worthy of investigation. It would be an ideal topic for a PHd. thesis, IMO.”
Four or five ships a year cannot be responsible for the massive Arctic-wide loss in ice thickness, which is much more pronounced that either area or extent. Ice melts from below, not from the sides. While this year’s extent is about the same as 2007,. volume is 30% less because of thickness loss. Final loss in area and extent are likely to be highly non-linear because of this. Anyone who has seen a lake melt in the spring will tell you the same thing.
Stu N says:
September 17, 2011 at 8:17 pm
You’re probably right, it is a high standard to hold him too. Not too different from the standards he seems to hold for people he disagrees with though. I don’t consider it at all a coincidence that the first time he brings up a data set (that’s been around since before he started posting on a topic that he’s posted on a dozen times or more) is when it and it alone sets a record.
I guess I shouldn’t hold people to the standards they hold for other people.
-Scott
Anything is possible says:
September 17, 2011 at 7:53 pm
Yep, that drop caused my prediction of 2011 surpassing 2008 on the daily value on Sept 16 to be off hardcore. The preliminary number for the 17th also shows a small decline. Still don’t know if I call it a secondary minimum though… 😛
-Scott
“Not too different from the standards he seems to hold for people he disagrees with though.”
I would disagree, given that it’s my informed opinion that Tamino has penned blog posts on some very serious cherry picking, and other issues. Your example is a rather tortured definition of cherry picking, given that he also mentions the majority of other datasets in the same breath and then describes the situation they present. It’s not as if there’s some other dataset showing the complete opposite that he conveniently ignored, is it?
Socratic says: September 17, 2011 at 9:04 pm
Four or five ships a year cannot be responsible for the massive Arctic-wide loss in ice thickness, which is much more pronounced that either area or extent.
While obviously not responsible for the majority of the sea ice decreace, “There were approximately 6,000 individual vessels, many making multiple voyages, in the Arctic region during the AMSA survey year; half of these were operating on the Great Circle Route in the North Pacific that crosses the Aleutian Islands. Of the 6,000 vessels reported, approximately 1,600 were fishing vessels.”
“The AMSA has developed the world’s first activity-based estimate of Arctic marine shipping emissions using empirical data for shipping reported by Arctic Council member states. Emissions were calculated for each vessel-trip for which data was available for the base year 2004. The 515,000 trips analyzed represent about 14.2 million km of distance traveled (or 7.7 million nautical miles) by transport vessels; fishing vessels represent over 15,000 fishing vessel days at sea for 2004. Some results could be an underestimation of current emissions, given potential underreporting bias and anecdotal reports of recent growth in international shipping and trade through the Arctic.”
“A specific example of where cruise ship traffic is increasing at a rapid rate is off the coast of Greenland. As Table 5.3 shows, cruise ship visits and the number of passengers visiting Greenland has increased significantly between 2003 and 2008. For example, between 2006 and 2007, port calls into Greenland increased from 157 to 222 cruise ships. The number of port calls in 2006 combined for a total of 22,051 passengers, a number that represents nearly half of Greenland’s total 2006 population of 56,901.
In 2008, approximately 375 cruise ship port calls were scheduled for Greenland ports and harbors, more than double the number of port calls seen in 2006.”
“The 2004 U.S. Commission on Ocean Policy reported that, while at sea, the average cruise-ship passenger generates about eight gallons of sewage per day and an average cruise ship can generate a total of 532,000 to 798,000 liters of sewage and 3.8 million liters of wastewater from sinks, showers and laundries each week, as well as large amounts of solid waste (garbage). The average cruise ship will also produce more than 95,000 liters of oily bilge water from engines and machinery a week. Sewage, solid waste and oily bilge water release are regulated through MARPOL. There are no restrictions on the release of treated wastewater.”
“During 2004-2008, there were 33 icebreaker transits to the North Pole for science and tourism. An increasing number of icebreakers and research vessels are conducting geological and geophysical research throughout the central Arctic Ocean related to establishing the limits of the extended continental shelf under UNCLOS.”
http://www.pame.is/images/stories/PDF_Files/AMSA_2009_Report_2nd_print.pdf
Bob Tisdale, Polar amplification occurs regardless of the cause of the rise or fall in surface temperatures.
Thank you Bob, to confirm that CO2 forcing is not exempt from polar amplification.
Which takes away the last shred of credibility behind D’Aleo’s claim that “It has nothing to do with CO2”.
Bill Illis But Serreze and others note that the sea ice Minimum looks more like a polynomial function (the R^2 for a 2nd Order polynomial is actually a little higher than the linear one and the 3rd Order Poly is even higher than both). So it we extend those functions out for 25 years, we get no sea ice in 2030 or 2050 or something.
Good observation Bill, which seems to confirm the statistical analysis done by Julia at the BlackBoard :
the quadratic fit is statistically significant and comparing the corrected Akaike values (AICs), which indicate if the only two possible models are linear or quadratic, the quadratic model much more likely than the linear model.
http://rankexploits.com/musings/2011/connelly-dekker-bet-actually-robs-got-a-very-good-chance-of-not-losing/
I hate it when I click Post Comment and wind up with an IE error message. My reply did not show up as awaiting moderation, so I will assume it got lost in the ethers. Good thing I wrote it in Word. Let’s try again.
Rob says: “Thank you Bob, to confirm that CO2 forcing is not exempt from polar amplification…”
And natural variables are not exempt. . The problem at hand is determining if anthropogebic or natural causes are the primary cause of the warming, and resulting polar amplification, during the more recent warming epoch. In a number of evaluations of Surface Temperatures during the satellite era, we determine that natural variables could be responsible for approximately 70% to 90% of the warming since 1982. Refer to
http://bobtisdale.wordpress.com/2011/01/09/can-most-of-the-rise-in-the-satellite-era-surface-temperatures-be-explained-without-anthropogenic-greenhouse-gases/
And:
http://bobtisdale.wordpress.com/2011/01/28/removing-the-effects-of-natural-variables-multiple-linear-regression-based-or-%e2%80%9ceyeballed%e2%80%9d-scaling-factors/
Stu N says:
September 17, 2011 at 10:06 pm
But it is his history of pointing out all the cherry picking that causes me to hold him to the high standard. Hypocrisy makes things stand out. Particularly this exact issue – as he rightfully pointed out when Steve Goddard cherry picked which data sets to use in his sea ice discussions.
In fact there is. The NANSEN Arctic ROOS shows 2011’s (daily) minimum to be above 2008 (to date at least).
Maybe you’re right though. Maybe I shouldn’t call it cherry picking and instead call it something else…but it’s clearly not a coincidence that it happened at the time that it did.
-Scott
A very interesting and illuminating article.
Perhaps the least publicised data, and the data most worthy of widespread publicity, is the PD/AMO correlation with arctic temperatures. It implies that arctic sea ice oscillates and that around 1979 we were close to the top of the cycle, not at an ‘average’ point. It might also imply that we are around the bottom of the cycle now with the implication that arctic sea ice levels may rise for the next 30 odd years. Given the predictions for low solar output for the next two cycles, it will be interesting to note whether that feeds directly into oceanic and ice parameters or whether such effects are delayed by a few decades…..
http://www.wunderground.com/blog/JeffMasters/comment.html?entrynum=1932
excerpt:
Arctic sea ice bottoms out near all-time low; August was Earth’s 4th – 8th warmest
Posted by: JeffMasters, 6:11 PM GMT on September 17, 2011 +21
Arctic sea ice extent hit its minimum on September 9 this year, falling to its second lowest value since satellite measurements began in 1979, according to the National Snow and Ice Data Center . More than one third (35%) of the Arctic sea ice was missing this summer, compared to the 1979 – 2000 average. This is an area about the size of the Mediterranean Sea. The 2011 sea ice minimum was very close to the all-time record low set in 2007; in fact, the University of Bremen rated the 2011 loss the greatest on record. For the fourth consecutive year, and fourth time in recorded history, ice-free navigation was possible in the Arctic along the coast of Canada (the Northwest Passage), and along the coast of Russia (the Northeast Passage.) Mariners have been attempting to sail these waters since 1497.
While the record low sea ice year of 2007 was marked by a very unusual 1-in-20 year combination of weather conditions that favored ice loss (including clearer skies, favorable wind patterns, and warm temperatures), 2011’s weather patterns were much closer to average. The fact we pretty much tied the record for most sea ice loss this year despite this rather ordinary weather is a result of the fact that large amounts of thicker, multi-year ice has melted or been flushed out of the Arctic since 2007. As a result of the loss of this old, thick ice, both 2010 and now 2011 set new records for the lowest volume of sea ice in the Arctic, according the University of Washington PIOMAS model. Given the very thin ice now covering most of the Arctic, we can expect truly dramatic sea ice loss the next time 1-in-10 year or 1-in-20 year warmth and sunshine invades the Arctic. We are definitely on pace to see the Arctic virtually sea ice-free in summer by 2030, as predicted by several leading Arctic sea ice scientists. I expect we’ll see more than half of the Arctic ice gone and the North Pole liquid instead of solid by the summer of 2020, and probably sooner.
Rhys Jaggar says:
September 18, 2011 at 3:51 am
A very interesting and illuminating article.
Perhaps the least publicised data, and the data most worthy of widespread publicity, is the PD/AMO correlation with arctic temperatures. It implies that arctic sea ice oscillates and that around 1979 we were close to the top of the cycle, not at an ‘average’ point.
—————
The data would suggest otherwise…
http://nsidc.org/sotc/images/mean_anomaly_1953-2010.png
http://nsidc.org/sotc/sea_ice.html
Of course, the data before 1979 is pre-satellite, but it’s what we have and it doesn’t suggest any cyclic behaviour.
Just The Facts says: September 17, 2011 at 11:33 pm
Socratic says: September 17, 2011 at 9:04 pm
Four or five ships a year cannot be responsible for the massive Arctic-wide loss in ice thickness, which is much more pronounced that either area or extent.
While obviously not responsible for the majority of the sea ice decreace, “There were approximately 6,000 individual vessels, many making multiple voyages, in the Arctic region during the AMSA survey year; half of these were operating on the Great Circle Route in the North Pacific that crosses the Aleutian Islands. Of the 6,000 vessels reported, approximately 1,600 were fishing vessels.” [deletia]
Good reply JTF. Obviously there are more than “four or five” ships per year in the Arctic and it is obvious that vessel traffic will not result in an increase in Arctic ice. If you’ve ever seen a log jam, it often only takes a small number of logs being released for the rest of the logs to become free. Ice that has been disturbed by vessel traffic is obviously more free to transported by ocean currents than undisturbed ice. I agree this should be studied more, as well as the impact of soot from the exhaust of the ships.
There’s been some questions raised about the authenticity of the last graph displayed in this post. See here: http://tamino.wordpress.com/2011/09/17/cold-cherries-from-joe-daleo/
Has D’Aleo responded to these questions or otherwise explain why he selected just those six sites to represent the Arctic climate? Tamino uses the full 137 Arctic sites from GHCN and the trend he derives is much stronger than that displayed by the six sites in D’Aleo’s graph. Those sites appear to be unrepresentative of the Arctic basin as a whole, whether from location or equipment changes. Of course, any site could suffer from those, but the more sites you use, the less such noise would be evident in the data. This would seem to be the equivalent of an alarmist cherrypicking the six sites with the highest temperature increase and using them to suggest it’s even worse than we think.
Norwegean news are reporting satelite measurements showing lowest ice extent ever. They would usually not report such news unless some scientist or research group was doing the same. It was part of a story about a greanpeace ship with a researcher from Cambridge doing thickness measurements on the ice. Are there any proper reports on lowest extent or is it just greampeace frothing at the mouth?
Vaguely related. Pole Cam #1 has gone kaput. Suspect it’s due to a combination of extreme cold and possibly being buried in a snow drift. Last good image was on a very frigid Sept 14, after multiple major snow events in rapid succession.
RE: Given the very thin ice now covering most of the Arctic
Show me the data.
I suspect the opposite is true. Lots of very compacted / obducted / compressed ice. It is notable how solid the core was this year a huge raft of near 100% concentration. Withstood the summer sun and wind (not to mention sea) very well. Once a certain edge was reached it really did not change much except for the usual area North of Europe.
Hi folks,
Would someone ‘in the know’ help me out and tell me what temperature source Dr. Soon used for the Arctic temperature v. TSI graph? I’ve googled and searched around a bit, and darned if it’s not difficult to find the answer. Or even a link to his paper, if it’s available free online (full paper only please & actually that’d be nice to have regardless… I’m assuming the abstract doesn’t include the data source he used for Arctic temps, so unless it does, the abstract only won’t help). I referenced his chart in a comment elsewhere, and a follow up coment asked me the temp source he used… so I’d like to reply if I can.
Thanks in advance for your help!
Stu
That post very clearly demolishes this one from Joe D’Aleo.
Scott,
How did you go with that?