Guest post by Dr. J Storrs Hall
A bit over a year ago, in the wake of Climategate, I put up a blog post over at the Foresight Institute which got picked up and run here at WUWT. The essence of the post was that there was lots of natural variation in the ice core record of climate, so that it was reasonable to be skeptical of scientists who claimed that recent CO2 variations were “the only thing that could account for the recent warming trend” (quoting myself).
Apparently that got enough exposure — and was persuasive enough — that over a year later the alarmists still feel the urge to “debunk” it. Most recently, Rob Honeycutt at the “SkepticalScience” alarmist fanboi blog weighed in with this: Crux of a Core, Part 1 – addressing J Storrs Hall. Now the thing about this particular piece that jumped out at me at first was the fact that he associated me with a graph I never used, and he calls me “Mr. Hall” to make me sound less qualified than other sources such as “Dr. Alley” he refers to. It’s Dr. Hall (and yes, I am a scientist, not a nanotech engineer as he claims), a fact that he could have discovered in 3 seconds with Google. That told me about all I needed to know about Honeycutt’s bona fides (in the original Latin sense of acting in good faith).
The only substantive point in the post is that GISP2 (or any specific ice core) is a local as opposed to global temperature record. Is it misrepresentation to use it as a proxy for global climate? Well, the inconvenient truth is that I’m hardly the first person to use ice cores as climate proxies in popular presentations:
… but, on the other hand, it’s actually an interesting question and one worth looking at.
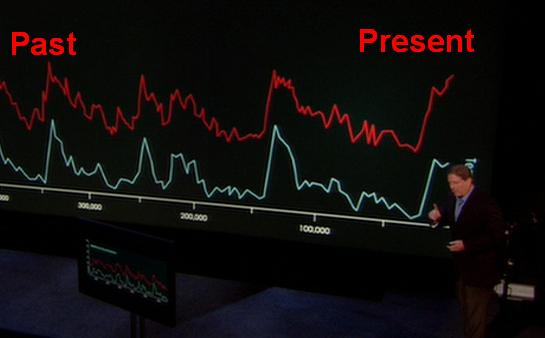
How Ice Cores Record a History of Climate
That’s not my title, it’s from this page at the GISP2 site. Not “a history of local temperature,” — of climate. Here are some quotes from the abstracts of papers by GISP2 authors:
“Ice cores provide high-resolution, multi-parameter records of changes in climate and environmental conditions spanning two or more full glacial- interglacial cycles. …”
“Polar ice contains a unique record of past climate variations; …”
“One of the most dramatic climate events observed in marine and ice core records is the Younger Dryas (YD), … High resolution, continuous glaciochemical records, newly retrieved from central Greenland, record the chemical composition of the Arctic atmosphere at this time. This record shows that both onset and termination of the YD occurred within 10-20 years …”
“The Greenland Ice Sheet Project 2 (GISP2) core can enhance our understanding of the relationship between parameters measured in the ice in central Greenland and variability in the ocean, atmosphere, and cryosphere of the North Atlantic Ocean and adjacent land masses. …”
“High-resolution, continuous multivariate chemical records from a central Greenland ice core provide a sensitive measure of climate change…”
“The accumulation record from the GISP2 core as an indicator of climate change throughout the Holocene” (paper title)
So, sure, a single ice core is not a global average temperature record; but it is quite a bit more than one thermometer. It’s just mud-slinging to claim that using it for a climate proxy is “misinformation”.
… especially when I didn’t just use one ice core in my post but two, and the other one was from Antarctica. One way to cut past the verbiage is simply to look at a comparison of the Greenland and Antarctic data and see how well they correlate:

(This is GISP2 in green, NGRIP, another Greenland core, in cyan, and the Vostok Antarctic core in blue. The Vostok has been scaled and shifted for a best match with the others; the temperature in Antarctica is colder, with smaller variations, than in Greenland. Furthermore, there are some time-scaling issues — note the temporal divergence of the two Greenland records before about 40 kya. It’s possible that NH/SH actually match better than this plot indicates. Look here for data.)
Nowhere near a perfect match, but it’s pretty clear that these are all from the same planet. Even Vostok shows the Younger Dryas, which is generally believed to be a mostly northern-hemisphere event. The NH has more variability in ice ages, notably the Dansgaard-Oeschger events, but the SH more, on a relative scale, in the Holocene.
The GISP2 people also compared their core’s record with Antarctic ones; on this page they say that it “shows close correlation between GISP2 and Vostok in the delta 18O of air in these ice cores.” (That’s a key temperature proxy.) On this page they say “Holocene climate is characterized by rapid climate change events and considerable complexity. GISP2 Holocene ¶18O (proxy for temperature) (Grootes, et al., 1993) and EOF1 (composite measure of major chemistry representing atmospheric circulation) show parallel behavior for the Early Holocene but not for the Late Holocene (O’Brien, et al., 1995).”
Note that bit about “rapid climate change events.” In the words of Jeffrey Masters here, “The historical records shows us that abrupt climate change is not only possible–it is the normal state of affairs. The present warm, stable climate is a rare anomaly.” (And he’s talking specifically about the lessons of GISP2 — although alas he takes home the wrong lesson from it.) See also this recent post here by Don Easterbrook.
Does GISP2 — or any other paleoclimate record — show us that climate change isn’t happening? No, of course not. It shows us that climate change always happens. The 20th-century warming was hardly unprecedented, and doesn’t call for unusual explanations.
Maybe there’s an existential explanation. Every age and era has prominent factions who want urgently to believe that they live in the End Times. A bunch of little Louis XVs: “Après
moinous, le déluge!” Can’t bear the thought of life going on after their unremarked passing, I guess.Oh Dr. Hall, the warmistas are going to be very angry that you are using their own information against them! Good show!
I wonder why it seems that the NH and the SH were “out of phase” between 50-60kya. I also notice little blips of the same thing at other times, SH will go cold, NH will shoot warm or vice versa. Look at around -40k. SH blips warm, NH goes cold. A similar event happens at about -65k.
Seems that if they do not like your comments on Real Climate a new impossible capcha is presented.
Dr. Hall said: “I am a scientist, not a nanotech engineer.” Let’s see.
Here on WUWT you were only identified as J. Scott Hall, not Dr. Hall. Did you complain?
According to wikipedia: “John Storrs Hall is involved in the field of molecular nanotechnology. He founded the sci.nanotech Usenet newsgroup and moderated it for ten years, and served as the founding chief scientist of Nanorex Inc. for two years. He has written several papers on nanotechnology and developed several ideas such as the Utility fog, the space pier, a weather control system called The Weather Machine and a novel flying car.”
Is this you: http://autogeny.org/ ?
If so your CV lists nothing about climate science.
http://autogeny.org/HallCV.html
The Foresight Institute’s mission is to ensure the beneficial implementation of nanotechnology.
You are entitled to your views but one or two ice cores do not provide enough information to reconstruct global climate.
This is an interesting discussion. The graph presented, in my view, looks a bit noisy, but I’d like to see more and how they’d line up. It would be nice if there were a consistent message about ice-cores and their representation of the globe or not. Let me see if I get this right……..in terms of historic CO2 levels, yes ….very valid and speaks to the entire globe……in terms of temps, no way! Its just local! 😐 :-0 😐 :-0 😐
Dr. Hall, thanks for the money quote and a nice summary statement. “It shows us that climate change always happens. The 20th-century warming was hardly unprecedented, and doesn’t call for unusual explanations.” This can’t get repeated often enough.
Excellent post.
Don’t mess with Dr Hall!
Another takeaway for me from the chart is that while we are enjoying the warmest climate in the past 80+K years, the recent trend is down.
The new tactics are really quite pathetic. They are not doing themselves any favours. Childish really.
Looking at these long-term ice cores always reminds me just how ironic the term “climate change” is. The climate has always been changing and hopefully always will. It would be amusing to start a parody ‘counter-scare’ by announcing that it appears earth’s climate has *stopped* changing. Climate data from the last 13 years certainly supports that conclusion. Perhaps the underlying magnetic, geothermal, etc forces that have driven our planetary climate variation for billions of years are finally “running out”. Such a trend of climate stagnation would be unprecedented and if it continues the consequences are likely to be catastrophic! Is the “engine of the earth” dying? The alarming press release practically writes itself.
Of course the cause of climate non-change is obviously man-made. As our society has industrialized more people and their machines have been put in motion. When in contact with the earth, this motion causes forces which have a measurable impact on the planet. This can easily be shown with Newton’s Laws so the science is settled. Clearly, we need to strive for a motion-neutral society. Fortunately, those who need to move mass at high speeds, such as drag racers and fire trucks, can buy motion offsets. 🙂
If the data supports the AGW alarmist orthodoxy it’s teleconnected data that is a global measurement, if not it’s obviously a local anomaly.
> The Vostok has been scaled and shifted for a best match with the others…
Could you be more specific about this? I have no issues about scaling or shifting the Y-axis (temperature) — it’s shifts of the X-axis (time) that I’m asking about.
What do these three plots look like, without X-axis shifting? Do you think shifting is informative because it corrects for dating errors? Or because there is a temporal lag between Arctic and Antarctic events, as shown in these records? (Or something else, of course.)
@Mike
You’re looking at the finger!
Mark says:
March 1, 2011 at 9:54 am
It would be amusing to start a parody ‘counter-scare’ by announcing that it appears earth’s climate has *stopped* changing.
Great idea Mark, but I hate to tell you that the folks pushing the Maya calendar 2012 apocalypse have beaten you to it.
Give it another shot after December 21, 2012 when the end of the world prognostications start fresh.
Mike says:
March 1, 2011 at 9:33 am
Dr. Hall said: “I am a scientist, not a nanotech engineer.” Let’s see.
Here on WUWT you were only identified as J. Scott Hall, not Dr. Hall. Did you complain? ……
=======================================
Are you intentionally being obtuse? Try applying a concept called “context”.
“…..and he calls me “Mr. Hall” to make me sound less qualified than other sources such as “Dr. Alley….”
It seems, all Dr. Hall is asking for is to be afforded the same respect and treatment given to others. Is that really too much to ask? Do you think it likely he didn’t complain about WUWT because he was afforded fair treatment?
@ Mike
“served as the founding chief scientist of Nanorex Inc.”
—–
Did you miss that part, that you yourself read? An engineer is different from a scientist, though a person can swing between professions, it’s a completely different sort of skill set and role. He’s a scientist in the nanotech world, not an engineer.
And when ice cores from completely different sides of the planet are in general agreement, then the local climate of two different sides of a planet are generally the same… then how is that not global climate? I don’t think you understand what global is if you honestly believe that.
Clearly Rob Honeycutt has made a fool of himself. Those on Skeptical Science that couldn’t take the time to validate Honeycutt’s statements also look like fools. Now, we see Mike (March 1, 2011 at 9:33 am) adding his name to the list of fools.
Tell me Mike, if you were going to claim someone is passing misinformation don’t you think one should at least figure out who the person is? If Honeycutt can’t get that right why would you expect anything else he says to be right?
Series of geomagnetic storms in last 2-3 hours shifted Earth’s magnetic meridian by 1.5 degrees.
http://www.vukcevic.talktalk.net/gms.htm
@ Mike
WOW , don’t ever participate in archery ! If you miss the target with as bigger margin as you missed the point with your post then no one would want to be in the same square mile !! LOL !! did you not read the article properly ?? No wonder people fall for AGW, are there many more who scan, misread, and then accept ??
Dr Hall, you did “it” again. Look at the last sentence of you post … is there a “global” inference again?! If you compare the GISP2 data with the Vostok data on a more revealing time scale (aside from well understood glacial/interglacial events) you’ll note that the abrupt climate events between the poles is typically anti-phase. Again, indicating local swings, not global in scope.
@Ged Darkstorm
Hall has zero background in climate science. The difference between an applied scientist in industry and an engineer is nil. Further, Honeycutt intended no degradation in identifying Hall as an engineer. And two points simply do not cover the global.
I’ve analyzed as much ice core data as I could find on the web and came to the same conclusions. http://www.kidswincom.net/climate.pdf. We must recognize that data are bi-variant proxies. Both time and temperature are calculate values, their values and accuracy changing with depth and latitude value. Calibrating time scales to the Younger- Dryas and adjusting latitude effects to a common latitude produces a time temperature relationship that reveals many climate cycles of different frequencies that have continued into the present so that our present changes are not unique.
The article would appear to speak for itself when the only rebuttal is a rather poorly researched ad hominem, re: @Mike says:
March 1, 2011 at 9:33 am
stupidboy says:
March 1, 2011 at 10:37 am
@Mike
You’re looking at the finger!
Jack Greer said:
“a more revealing time scale”
Correction: “a more revealing time scale with smoothing representation x-noise.”
@Bushy –
I am not an Al Gore basher, but since they point out so often anyone who isn’t exactly one of the Hockey Team, it should be pointed out that Al Gore is about as far from a climatologist as can be. The double standard is pretty despicable.
Many of the scientists who have AGW papers are physicists or other scientists, but if they are AGWers, fine and dandy. Yet perhaps the greatest scientist of the last 40 years, Freeman Dyson, is frowned upon as “just a physicist,” when he voices skeptical points.
Right on Severian!
We have see it claimed so many times before: MWP is European weather when it shows it is not as hot today as it was then. If the numbers can be ‘stepped on’, it is climate because is it supports escatology. Dr becomes Mr in order to emphasize that the priestly class of self-appointed alarmist oracles are demanding real money to stop the metaphorical eclipse that is eating the metaphorical sun.
*Yawn*……..
Is anyone interested in the actual science? You know, the kind with numbers and relationships, where effects have causes? Where non-effects don’t need a cause? Must be a slow news week if we have to stoop to mentioning RC and science in the same breath.
Mr, Dr? Scientist, schmientist? These are manifestations of the World of Names. It is polite and correct to refer to people by their legitimate titles as part of our social convention. It is one of the foundations of civil discourse. If you can’t at a minimum research someone’s title(s) correctly, what does that indicate about the quality of rest of your work?
Excellent article. Michael Mann’s acolytes are the ones who don’t believe in climate change prior to the mid-1800’s. Skeptical Science, a blog run by a cartoonist, has a large number of Mann followers.
Mann’s Hokey Stick chart showed almost no change until the beginning of the industrial revolution, when suddenly temperatures shot straight up. But Mann’s chart has been completely debunked by McIntyre & McKittrick, and the IPCC dares not use it any more, much as they would love to; it was visually spectacular. It was also bogus science fiction.
We know from both Northern Hemisphere and Southern Hemisphere ice cores [and numerous other proxies] that the Medieval Warm Period was warmer than today, and the Roman warm period was warmer than the MWP, and the Minoan Optimum and Holocene Optimum were much warmer than the RWP.
What we observe currently is indistinguishable from previous warming cycles. While there may be a minuscule amount of warming due to the increase in CO2, it is insignificant and can be disregarded. Most of the *mild* 0.7°C warming over the past century and a half is natural variability.
It appears that the current warming cycle may be topping out. If so, we are cutting back on CO2 at exactly the wrong time; warm interglacials are rare.
Well, I am confused as to the purpose of this post titled “Rebuttal to the Skeptical Science ‘Crux of a Core,’” I thought the rebuttal was to Honeycutt’s point.
You wrote “The only substantive point in [Honeycutt’s] post is that GISP2 (or any specific ice core) is a local as opposed to global temperature record. Is it misrepresentation to use it as a proxy for global climate? ”
That’s all Honeycutt is addressing. I don’t know if your answer to your question is Yes or No.
Or are you saying that Honeycutt has the purpose of your original post wrong?
Mike says:
March 1, 2011 at 9:33 am
“You are entitled to your views but one or two ice cores do not provide enough information to reconstruct global climate.”
Tell that to James Hansen. In this paper:
http://pubs.giss.nasa.gov/docs/2008/2008_Hansen_etal.pdf
…he simply divides the Vostok temperatures by two and calls it “calculated global temperature” (and he has used the same stunt in several papers).
Mike says:
March 1, 2011 at 9:33 am
So blinded by your faith that you are reading words that are simply not there.
This NSF overlay may show the correlation a little better.
Skepticalscience is a fundamentalist propaganda site. I have had my fair share of online discussions where fundamentalist warmists fling links to Skepticalscience, presented as the ultimate “truth”. Afterall, they have been following the home-cooked recipe for “how to argue against skeptics”.
When the posts at Skepticalscience are examined more closely, most of them present only a carefully selected review of the scientific basis, and then goes on to misrepresent even this selection in a warmist direction.
Of course when these facts are brought to the table, the warmists have a way of disappearing from the discussion..
I have found only one redeeming example of somewhat balanced reporting from Skepticalscience, and this was actually acknowledging Lindzen’s estimate for forcing, making the span 0,5 to 1,0 degrees for a doubling of CO2. (then of course going on to make 3-4 degrees the most probable from a consensus sort of view).
It says a lot about their credibility that one is surprised to find that they don’t totally misrepresent the facts in ALL their posts, as they have in the case of the main post here, and in many others.
@Mike
I’m a scientist, so I know how the system works. Therefore I can say you honestly have no idea if you truly believe what you say. You don’t know what an “applied” scientist is, and you don’t know what an “engineer” is when in comparison to; if you honestly think there’s little difference.
Him not being a “climate scientist” is also irrelevant. Science is about data and data only, it cares not about titles or professions, only data. The title someone has simply says they are the ones working in that field to generate new data which EVERYONE can then evaluate. And indeed, the point of science is to make data which EVERYONE then evaluates and judges, not just oneself. An hypothesis must be challenged by many. If others challenge my hypothesis, even those outside my field, if their analysis is sound, then it’s completely valid. Nor is anything I would say about my own work more or less valid than what someone else says if they have EVIDENCE to back it up.
Finally, two points on completely other sides of the planet when in agreement, how would you explain that agreement if it isn’t a general trend across the globe? Some areas are more responsive to the “global” average anomaly and some less, but ice should be the most responsive of all. Or did you forget that warming is supposed to be “amplified” at the poles? If anything, ice core data should be an exaggeration of the planet’s complex climate trend, and both ice cores generally agreeing from two different sides of the world means we can be confident in that trend. Nor are they the only evidence. Read some of the papers on the ice core data, and you’ll see what I’m talking about.
Or, do you disagree with all paleoclimatology?
Mike says:
March 1, 2011 at 11:13 am
@Ged Darkstorm
Hall has zero background in climate science. The difference between…..
======================================================
Meaning he’s not adept at making stuff up.
Coincidentally, I agree, one can’t infer much from 2 points on the globe. However, as pointed out up the thread, this is exactly what many alarmists do. The problem, Mike, is when you attack messengers such as Dr. Hall, any valid thoughts you may have to this particular issue is muted by your violation of societal mores.
vukcevic says:
March 1, 2011 at 11:00 am
Series of geomagnetic storms in last 2-3 hours shifted Earth’s magnetic meridian by 1.5 degrees.
Misrepresentation or misunderstanding. The Declination varied over a few hours [and very different amount at different locations. E.g. at Thule 4 degrees, at other stations but a fraction of a degree], as it usually does during a geomagnetic storm and is back again as it always is. Nothing ‘shifted’.
Mike said:
You are entitled to your views but one or two ice cores do not provide enough information to reconstruct global climate.
OK… What else do you have that goes back that far, and do they disagree with the ice cores??????
Fred H. Haynie says:
March 1, 2011 at 11:17 am
Thanks for this. I’ve read a lot of your work and it find it thought provoking and interesting. Many thanks
AMac: The graphs as presented are without any x-axis (time) shifting from the original data. I noted the issues because the estimated time scales that come with them are uncorrected for things like different ice flow rates a mile down over umpteen thousand years. You can see the effects clearly in the two Greenland records, which match very nicely ca. 30-40 kya and then diverge for the earlier 10 ky — though the peaks would seem to match if some time-warping were done. The scientists who do core studies are well aware of this phenomenon and indeed there is a substantial literature on the whole subject.
In general, folks, scientists who study a subject are both very bright and have dug a lot deeper than casual onlookers, or even well-read amateurs. You just don’t catch them on the details very often. Saltative paradigm shifts are rare and generally involve very deep assumptions that are inaccessible to empirical test. One instigates them at one’s peril — the rebels are more often wrong than the old guard.
The main reason we can have any confidence in questioning the current CO2-phobia orthodoxy in climate science is that it is reasonably cast as the hobby-horse of rebel paradigm shifters who took over the reins by political means rather than a fair scientific fight on the basis of evidence and experiment. The status quo ante orthodoxy was natural variation. One doesn’t have to question the entire edifice of climate science to favor it, but simply take part in a debate which should have happened but was played out on a very, very tilted playing field.
Climate changes. Its something it does naturally. Always has and always will.
The pseudoscience of AGW should be recognised as such.
Here is an excerpt from an article in the Science Daily:
“In a letter published recently in the journal Nature, Los Alamos National Laboratory researchers and an international team of scientists report that the Southwest region of the United States undergoes “megadroughts” — warmer, more arid periods lasting hundreds of years or longer. MORE SIGNIFICANTLY, A PORTION OF THE RESEARCH INDICATES THAT AN ANCIENT PERIOD OF WARMING MAY BE ANALOGOUS TO NATURAL PRESENT-DAY CLIMATE CONDITIONS. [Amazing what?]
But then it goes onto say:
“If so, a cooler, wetter period may be in store for the region, unless it is thwarted by increased concentrations of greenhouse gasses in the atmosphere that could warm the planet.” – No signs of that so far
http://www.sciencedaily.com/releases/2011/02/110228183853.htm
Mike says:
March 1, 2011 at 9:33 am
You are entitled to your views but one or two ice cores do not provide enough information to reconstruct global climate.
But one tree does?
@Mike:
There’s a difference between a climate scientist and an engineer.
If Greenland ice core shows business as usual, it is not valid, because it is just one core. If Greenland temp. station shows warm year because of positive AMO, it is a sure sign of the end of the world.
Mere GISP2 and CET record efficiently demolish the whole AGW scam.
Mike says:
March 1, 2011 at 11:13 am
“Hall has zero background in climate science.”
So?
“The difference between an applied scientist in industry and an engineer is nil.”
Not so sure about that one. But heck, what do I know, I’m just an engineer working in industry alongside other engineers and scientists. And don’t forget, engineers are the ones who keep notes.
“Further, Honeycutt intended no degradation in identifying Hall as an engineer.”
You know that because…?
“And two points simply do not cover the global.”
Dr Hall doesn’t claim they do. He does say ‘Nowhere near a perfect match, but it’s pretty clear that these are all from the same planet.’ Do you disagree with that?
Thanks for the graphic, Smokey. I always knew us engineers had a particularly interesting view of the world.
It seems to me that this “rebuttal” can be boiled down to 3 points:
1) Hall has a PhD
2) Al Gore did it too
3) The Vostok temperature proxy looks kinda sorta like the GISP2
So #1 – okay you’re “Dr.” not “Mr.”
#2 – Gore was simply showing the correlation between CO2 and temperature. It makes sense to use the CO2 and temperature data from the same source (Vostok, I believe) for that purpose.
#3 – In his article, Rob provided a plot which shows GISP2, Vostok, 6 other Holocene temperature proxies, and the average. If we’re keeping score, he just beat you 9 to 2, being generous since you didn’t actually do any real analysis of the Vostok data in your “rebuttal”.
Not much of a rebuttal.
Mike says:
March 1, 2011 at 9:33 am
“You are entitled to your views but one or two ice cores do not provide enough information to reconstruct global climate.”
Ok, how about one tree? Remember YAD061, the magical enchanted Larch of Yamal? We do.
Sorry to differ, Dr Hall, but the correlation in the rescaled graphs of the 3 ice cores you show is quite poor. There is no way I’d invest money in a scheme that relied on these, as in a prospectus.
For a start, you would need to put error bars on them. Then you’d need to show audit evidence, say 1 in 10 samples replicated. Then you’d need to explain the various known influences on the data, including the proposition that the Greenland pattern is partly dependent on the direction of prevailing winds at the time. Then you’d need to explain how a qualitative mechanism like fractionation of isotopes on evaporation and condensation, at distances from the core holes that are uncertain, with uncertain mixing processes, becomes a quantitative relationship with temperature. (It becomes quantitative only when the researcher uses circular logic).
Just as dendrothermometry has shown failure, I expect that oxygen isotopes in ice cores will also fail. There is altogether too much wishful thinking. I too, wish that we could find a truly reliable proxy that would end the volumes of speculation that now exist. We are not there yet.
The heart of Mr. Hall’s post seems to be tossing an insult at Skeptical Science, and mentioning that Mr. Hall has a doctorate. Just like Richard Alley, except Alley is world-class paleoclimatologist who helped drill and analyze the Greenland ice core.
Greenland and other northern-hemisphere reconstructions sometimes show opposite phases to Antarctica. Climatologists understand that neither by itself is a proxy for global climate. Hall’s graph hides this substantive point, but Honeycutt’s Skeptical Science post stated it clearly.
So, what’s the take away?
•GISP2 is clearly a local record of temperature for the summit of the Greenland ice sheet, not a proxy for global temperature.
•It requires looking at multiple lines of evidence to piece together a complete picture of the Holocene.
•The Holocene shows a very slow, gradual cooling trend over the past 6,000 years but the mechanisms behind the cooling are well understood.
•The cooling during the past 6,000 years globally is on the scale of 1-2C and we have abruptly altered the trend and are now pushing the planet toward warming.
“It shows us that climate change always happens. The 20th-century warming was hardly unprecedented, and doesn’t call for unusual explanations.”
Exactly.
A couple of points of disagreement from someone who regularly uses the published ice core data:
1. Prior to approx 20,000 years ago there was an element of anti-correlation between Antarctic and Greenland temperatures as measured from ice cores. This has been confirmed through the analysis of temperatures and currents in oceanic bottom waters. So when the Greenland and Antarctic temperature graphs are overlaid, one on the other, the position of the temperature peaks actually should be displaced by around 800 to 1500 years. There is plenty of published research on this in the various Geophysical and Quaternary Geology/Climate Journals. Please note that the relative timing is usually determined via dating of the ice using a synchronous tracer, typically variations in the atmospheric methane content of each core.
2. It is becoming increasingly clear that the Younger Dryas is not represented in Antarctic Ice Cores. The cooling event one sees in the Vostok core dates from around 15,000 years ago. It is called the “Antarctic Cold Reversal (ACR)” and can also be found in climate records from New Zealand, Tasmania and Chile. This event predates the Younger Dryas by at least 1000 years. It is another manifestation of anticorrelation or at least “phase shift” between events at the two ends of the world.
The causes/ forcing mechanisms for the offset in climate trends recovered from the Northern and Southern Hemisphere ice-cores are sill being debated.
Other than this I see no problem with the concept that temperature trends identified from ice cores can be used to identify temperature trends that are at least Hemispheric in extent. The simultaneous trends identified at a host of Greenland ice core sites have been replicated from 100’s of Northern Hemisphere sea floor cores (sea surface and ocean floor temp), from dozens of pollen records, from records of Loess deposition and from numerous speleothem records. These temperature fluctuations have also been tied in with changes in sea level (measured for instance at coral reefs) that appear to relate to melt-recharge and ice-flow cycles on the Northern Hemisphere ice sheets.
I agree with Dr Hall that temperature trends identified in Greenland ice are more than just local. This applies not just over the last ice-age cycle shown in the graph above, but also through the Holocene warm period that we now live in. Numerous Hemispheric scale temperature trends identified in Greenland for the last 10,000 year period are as large or larger than the modern trend coming out of the Little Ice Age.
This last point is significant. In the modern period the supposed AGW trend is mainly a Northern Hemisphere event. It is not present in the Southern Ocean sea surface temperature record and is barely discernable in the South Pacific (refer to numerous postings by Bob Tisdale). SO a change in the average Northern Hemispere temperature can result in a change in the global average without the event being truely global. There is no doubt that such circumstances have applied frequently in the past (i.e. throughout the Quaternary period and probably longer still).
Looks like an article worthy of WUWT, Vuk, if (a) you can explain in layman’s terms what those interesting graphs show (b) you can avoid raising Leif’s ire!
Smokey says:
March 1, 2011 at 12:26 pm
@Mike:
There’s a difference between a climate scientist and an engineer.
============================================
LOL, very nice, smoke!
Last February, Andrew Revkin asked Dr. Alley, the lead scientist for GISP2, to respond to the interpretation of GISP2 by people like Dr. Hall. His response then is equally applicable today. A couple clips:
“First off, no single temperature record from anywhere can prove or disprove global warming, because the temperature is a local record, and one site is not the whole world. One of the lessons drawn from comparing Greenland to Antarctica and many other places is that some of the temperature changes (the ice-age cycling) are very widespread and shared among most records, but other of the temperature changes (sometimes called millennial, or abrupt, or Younger-Dryas-type) are antiphased between Greenland and the south, and still other temperature changes may be unrelated between different places (one anomalously cold year in Greenland does not tell you the temperature anomaly in Australia or Peru). ”
… and …
“So, using GISP2 data to argue against global warming is, well, stupid, or misguided, or misled, or something, but surely not scientifically sensible. And, using GISP2 data within the larger picture of climate science demonstrates that our scientific understanding is good, supports our expectation of global warming, but raises the small-chance-of-big-problem issue that in turn influences the discussion of optimal human response.”
Here’s the full Revkin article: http://dotearth.blogs.nytimes.com/2010/02/08/richard-alley-on-old-ice-climate-and-co2/#h%5B%5D
J Storrs Hall —
> The graphs as presented are without any x-axis (time) shifting from the original data.
Thanks for that clarification.
Nanorex is not a scientific company. Unless a software game company like Nintendo is a scientific company. They are a computer modeling. They design graphic tools and fancy CAD/CAM type drawing programs for scientists to flog their actual accomplishments in science. Similar to the graphics that Al Gore uses in his presentations. He started a carbon trading fund. He utilized the “science” of sociology and human behavior to persuade people to invest.
My guess is that Nanorex does not even have a Bunsen burner on site. Modeling for persuasive presentations is handy for separation science, however. Separating a VC investor from his money, that is.
Now, getting back to Catastrophic Climate Stagnation, …
Ok. Climate science is not a house of cards. But after paying attention to the debate for a few years, it doesn’t matter if CAGW is a friggin fortress, it’s still coming down if you look at the accumulated amount of firepower it has taken. By it, I mean of course the ‘consensus’ based on ‘settled science’. If you still defend the ‘consensus’, you must be in complete and utter DENIAL
I hope someone will correct me if I get this wrong.
The general public has been led to believe the Ice cores are a very granular look at temperature and CO2 changes over an extended period of time in Greenland and Antarctica. Part of the reason they think this is because the charts connect the sample points in a linear way.
When one looks at the amount of snow necessary to create an inch of glacial ice and the amount of ice core necessary to produce sufficient gas to sample, the picture radically changes.
The ice core samples are actually a very general look at temperature and atmospheric change over years to establish a single point on the graph and do not reflect seasonal changes like a warmer Greenland and Antarctica within the same year or season. Nor do they reflect simultaneous atmospheric change which isn’t even feasible due to atmospheric mixing and the difference in land mass in the Northern and Southern hemispheres.
The charts are misleading, they should be bar charts which should also reflect the missing samples?
@Mike
I would think that mathematics is the same whatever field of science you delve in, no ?
Cimate science is just that, mathematics.
Smokey’s NSF overlay shows nicely that Arctic and Antarctic do fit well together, each affirms the other therefore both are basically trustworthy. So much for Honeycutt’s assertions.
Anyway, Honeycutt, sauce for the goose is sauce for the gander. If you don’t like the temperature records of the ice cores, then why should you trust the ice core CO2 records? though I trust the temperature records, based on isotopes, far more than the depleted records of the craftily absconding CO2 that are spliced into that highly-suspect Ice Hockey Stick flaunted by your article.
I bet you didn’t check with Dr Storrs Hall to see if he had any comments, before doing that article. But hey, why don’t you add my Primer (click my name) to your list of places that use his graph? I’ve done one of the best renditions I reckon. Oh, and read my Primer in the process… my, my, you’d have enough articles there to last you for a year. Might actually goad us into crowdsourcing answers to the whole of Skeptical Science. That would be a good idea. Yes, do.
I get the impression that many of the folks who disagree with the science posted by Dr J Storrs Hall can only throw insults rather than put up credible scientific challemges.
Lucy Skywalker says:
March 1, 2011 at 1:42 pm
Anyway, Honeycutt, sauce for the goose is sauce for the gander. If you don’t like the temperature records of the ice cores, then why should you trust the ice core CO2 records? though I trust the temperature records, based on isotopes, far more than the depleted records of the craftily absconding CO2 that are spliced into that highly-suspect Ice Hockey Stick flaunted by your article.
======================================================
No doubt. Isn’t it interesting that we’re told about the last 800,000 years CO2 was never over 310 ppm, globally……..based on ice core samplings. But, the same cores are only local in terms of temps……. and there are people out there that believe this stuff!!!
Thank you for that article Dr Hall. So that was the source of that tremendous series of graphs that I’ve made even more pointed! Now I’ve been able to insert credits.
This is good. We need more rebuttals of Skeptical Science
Excuse me, moderators! Mods! one of Smokey’s models is missing something.
But because it is Smokey, I will just say the earth/moon picture is missing the sun.
Is there really a match between ice cores even from different locations on Antarctica? There certainly is not in the lowest strata, those are incredibly chaotic.
bubbagyro says “My guess is that Nanorex does not even have a Bunsen burner on site. Modeling for persuasive presentations is handy for separation science, however. Separating a VC investor from his money, that is.”
So bubba – how many bunsen burners do you think Gavin Schmidt has? And as far as separating people from their money at least investors make the choice to invest, the climate change fanatics are taking from the people without regard to full disclosure.
Take a look at this short video, with the Danish Jørgen Peder Steffensen of the Niels Bohr Institute – leader of the GISP2 projekt – and the 3 km drilling through Greenlands ice cap, with information of 130 thousand years of climate information. He has a verry surprising conclusion!
The video is called – We live in cold times – and is here:
stupidboy says:
March 1, 2011 at 10:37 am
@Mike
You’re looking at the finger!”
For some the finger is more interesting than the moon. For others, it’s all they are capable to ponder.
Lucy:
I’d just like to say that nobody really uses bunsen burners anymore.
I have recently plotted (again) the Greenland ice core data sets
just to see what they purport to have recorded (climatically) in the (recent) past,
with regards to warming and cooling episodes (and rates of) over the Holocene.
http://i53.photobucket.com/albums/g43/DerekJohn_photos/Greenland%20revisited%20DJA%202010/Diesendorf%20cherry%20pie/Slide2-1.jpg
http://i53.photobucket.com/albums/g43/DerekJohn_photos/Greenland%20revisited%20DJA%202010/Diesendorf%20cherry%20pie/Slide3-1.jpg
It is quite easy to see why such “evidence” is soooo disliked / dismissed.
Damned inconvenient.
SØREN BUNDGAARD,
Thanks for the video. It seems as if, in that spot on Greenland anyway, that there was a Roman Cool period, according to the ice core.
Update:
http://www.vukcevic.talktalk.net/gms.htm
J StorrsHall says
‘The main reason we can have any confidence in questioning the current CO2-phobia orthodoxy in climate science is that it is reasonably cast as the hobby-horse of rebel paradigm shifters who took over the reins by political means rather than a fair scientific fight on the basis of evidence and experiment.’
This is an interesting hypothesis…..cast a bit longer as a small cabal of otherwise underemployed and career limited physicists at NASA, switching their focus to modelling the globe and prediction of futures….with a very expensive and very employment demanding computerised crystal ball. But they were still scientists and though limited in the fields of real world climatology – such as sediment and ice-core studies where the scientist actually spends hours in the field and lab, they really felt they could really find a place of scientific overview…using their incredible NASA-developed skills as modellers. And of course there was a genuine heartfelt desire, as many scientists feel, to bring the benefits of science to all of humanity, and certainly to protect from impending ecological disasters. It could be seen as a laudable quest….and when confronted with the real scientific uncertainties where choices of some variables (like converting a radiative forcing at the top of the atmosphere measured in watts, to a change in temperature at the surface measured in degrees C ) thought it best to embrace the newly invented precautionary priciple and go with the scarier values for that constant. And also lend consideration to some theoretically large positive feedbacks.
So this was the rebel core….and within very few years, they had formed committees, lobbied governments and taken the issue to the very heart of the United Nations. They were supported by legions of political activists – from Greenpeace to the Royal Society for the Protection of Birds (in the UK, of course). Within fifteen years, their models were endorsed by every science academy across the globe. And finally, the political world responded with such far reaching plans and methods that a new global currency, accounting system, regulatory force and surveillance, trading, brokering and banking….even creating a new form of bank for the new paper currency – itself entirely built on a concept relating to something as common as charcoal.
Such alchemy was probably not their initial aim, I am sure. How could they have foreseen how many supporters they would have and such willingness to save the planet from a disaster that, well, okay, it does come out in the centre of a probability curve, and it really could happen, according to our best models, but well, there are also some very basic but potentially possible within the 95% probability boundary conditions or factors, gain factors and feedbacks closer to unity, where the future would not be that scary…but surely better to act.
That’s probably where these paradigm shifters are at today. Maybe a bit surprised at the support – but according to some appearances, one rebel at least, rages that all of this support is not enough and to hell with the uncertainties….the danger is real and changing the system like this is worthwhile. So what if people have to curtail their freedom – don’t we do that all the time with fire regulations and crash insurance?
I am just not sure what paradigm these guys were attempting to shift.
It could have been simply to redeem the fortunes of predictive modelling. I was active in the period 1980-1990 when these GCMs were developed. I was concerned with pollution control – the science and its regulation, and from an environmentalist standpoint. So I was often called to scrutinise predictive models – usually they predicted that nothing much would happen when you discharged this or that toxin.
And they had all gone spectacularly wrong. I actually held up the world’s top marine disperal model (also coupled to the atmosphere) that predicted zero consequences for dumping toxic and nuclear material in the ocean….on the floor of a UN Convention, and we, a small group of paradigm shifters, tore it to pieces. They saw the whole of their dumping programme outlawed, their research labs closed and their funding dry up right across the globe. Similar failures occurred with sulphur dioxide emissions, acid rain damage, mercury dispersion and a host of heavy metals. Their ancestors’ models of CFCs in the atmosphere initially predicted no impact at all, and even when they had to correct them after such an horrendous error – they could not model the rate of change or make useful predictions (most recently, it would appear a substantial part of the ozone hole is a natural consequence of increased solar UV radiation).
Even the modelling of nuclear reactor accidents – which I developed some expertise at running, as well as analysing the parameters, had been shown to be useless after Chernobyl in 1986…prior to that, all accident consequence models assumed the reactor core could (perhaps would) not melt down.
The scary climate story certainly redeemed modelling (well it is only now beginning to crack – this new paradigm). Billions have been directed to thousands of labs and research groups, PhD students and professorships. Perhaps that was the rather risky, – considering their history, goal of the shifters in the first place.
I can’t see any other rebels or movers in the carpet-bagging department. The people I knew in Greenpeace – real warriors for the planet, however naive at times, willing to place their life on the line….they have mostly retired and been replaced by a professional lobbyist. Along with lawyers and PR people and a whole secretariat. They now work hard just to maintain the company and its offices. The new paradigm is just great for that, and they haven’t bothered to check the science. In fact, nowadays, they are quite close to the UN, helping to shape its agenda and so they follow the UN Panel’s advice. Now that is more of a paradigm reversal that most people will ever know!
So the revolution in computerised planetary awareness IS the paradigm shift….I hadn’t wanted to elevate it to such heights, but there it is! What started out as a mere spark of concern in the heart of a NASA modeller, became a revolutionary movement that captured world statesmen, of the standing even of an American Vice-President and nearly ‘most powerful man in the world’ and UK Prime Ministers. It is true, it is a phenomenally successful movement – with millions of school-kids all over the world, and teenagers, allotment keepers, top bankers and even glamorous film stars….all in favour of the new global currency and of course, very grateful to the upper echelons of science (and modelling, for those in-the-know), their protective institutions and of course, the UN.
Wow – we could be living through the biggest paradigm reversal event since, well, records began. Could that incredible edifice crumble? And how quickly? Now that the secret is out – and the parameters of the model that were perfectly legitimate and we really knew were there, and if you read the fine print of the UN Working Group reports and ignore the hype in the Summary for Policy Makers, which we, the rebels, did not write by the way…..these apparently lower probability parameters are now actually, as borne out by the recent lack of heat accumulation in the atmosphere and the oceans and evidence that the fiercely positive feedbacks we theorised are actually not fierce at all…..
Is that simple truth, if admitted (could it ever be admitted?), able to bring down the revolutionary committees and panel and planning departments? Actually that part of the revolution is seldom discussed – the way the bureaucracy has latched on to the carbon part of the paradigm shift…and then the commodity brokers and the bankers. Then come all the industrial biomass burners, wind turbine makers, solar voltaic engineers and businesses across the planet. What one UK Green MP recently called the ‘Carbon Army’ (she was a woman too, but I guess she likes men in uniform).
It is going to be a very interesting time from a social anthropologist’s perspective ( I dabbled in that to get some broader view on the shenanigans of scientists and their variance alliances with industrial strategy). Already the revolutionaries are using religious language to consolidate and defend themselves from…..others who want to shift the paradigm back again. They think if so great a paradigm in the first place that these retro-shifters are placed on a par with flat-earthers!
I am not going to go into ‘climategate’ and what it says about the mindset of the shifters – that would be personal and cloud the overall picture….unless, I mean, could they have been really shifty from the start – but that would then question their real motives and integrity, and I am happier not to do that.
That ‘greatness’ is actually part of the pardigm shift – that it is a great shift, has to be a great shift, in order to save the world itself. The shifters of a simple equation and box model have perhaps unwittingly (unless they belonged to some secret cult with almost clairvoyant powers!) sparked a truly massive paradigm shift in a sense of planetary awareness and the illusion of being able to measure and control things on a global level, – as well as caring, of course…it is a special kind of caring, that kind of control.
So – the flat-earthers tend not to argue about equations and uncertain constants, rather…they are mostly in reaction to the remedies proposed for the future disaster. They especially don’t like the idea of more taxes, more bureaucrats, more bank deposits far removed from scrutiny and in particular, elected scrutiny. Some just hate turbines in beautiful places. Not many actually really care about scientific truth – the parameters like gain factors.
…I am rambling through the blessings of the blogosphere…apologies…just can’t resist responding to soulmates, when all about me have so little interest in the truth!
@Shrodinger, “I get the impression that many of the folks who disagree with the science posted by Dr J Storrs Hall can only throw insults rather than put up credible scientific challemges.”
There was no science posted by Hall. He threw insults, then showed a line graph he’d put together from data found on the internet. Waving at this graph he declared
“Nowhere near a perfect match, but it’s pretty clear that these are all from the same planet.”
which nobody ever disputed, and
“Even Vostok shows the Younger Dryas”
which is wrong enough to be a test of what his readers know about science.
There is actually very little doubt that the ice-core record is a good climate proxy. There are differences in detail between Antarctic and Greenland ice-cores, particularly that the latter show Heinrich events and Dansgaard-Oeschger events quite strongly. These are North Atlantic events that show up only weakly in Antarctica. There is also a phase shift between Antarctia and Greenland, often known as “the bipolar seesaw”.
However the main climatic events, glaciations and interglacials and major stadials and interstadials show up in all the ice-cores at the same times and in the same proportions. The previous interglacial (MIS 5e) is always warmer than the present and followed by two cooler interstadials (MIS 5a and 5c), the next older interglacial (MIS 7) is always slightly colder than the present and multiple peaked and so on and so on. These are all features that can be checked by other data (ocean bottom drill cores, speleothems, loess profiles, cave sediments, pollen, fossils, ancient beaches, river terraces etc).
And yes, all these proxies agree that most of this interglacial was significantly warmer than the present. The warm peak was reached quite early and the temperature has on the whole been declining since then (this seems to be a general feature of interglacials). But the decline has not been even. There has been warmer rallies (like the MWP) two quite sharp cold dips 9600 and 8200 years ago, and a downward step change about 4200 years ago.
That the early and middle Holocene was markedly warmer than the present is nothing new. This has been known and universally accepted for a century ever since palynology was invented. It is as a matter of fact quite obvious if you are familiar with the fossil record and biogeography.
Well, if you look at _all_ the evidence, the multiple available cores, sediment evidence, etc., we appear to have 1-2C cooling over the last 5000-6000 years since the Holocene peak. That’s a decline averaging 0.033/century.
Now we’re up 0.75-0.8C in the last 100 years, 20X faster than the drop since the Holocene?
Hmmm. One of these things is not like the other…
Mike says:
March 1, 2011 at 9:33 am
Oh really? Those cores went through a hell of a lot more ice than Mann’s tree bores.
Laughable.
Mike says:
March 1, 2011 at 11:13 am
“… And two points simply do not cover the global …”
Dang it – I misplaced my equatorial ice cores. Probably under the refrigerator with those 100’s of ice cubes I kicked under there.
Mike you are cherry picking and splitting hairs:
Here: “J. Storrs (“Josh”) Hall, Ph.D., is President of the Foresight Institute and an independent scientist and author. Dr. Hall is a prolific writer on nanotechnology, artificial intelligence, machine ethics, and other social impacts of technology. He is actively sought out to speak about and be interviewed on diverse future technology-related topics, appearing for example in the movie “The Singularity is Near”. He has over 30 years research experience in academia and industry.”
Thus, he has a Ph.D and thus is a doctor in that sense. Two, when you continue to read the bio, you see he has a multitude of professional interests and applications he has explored.
What is, precisely, a climate scientist? A professional from some field of science who studies climate, but to invoke some sort of special exaltation to “climate scientists” does not seem appropriate. Did you read the peer reviewed papers showing how poorly the GCM’s performed hindcasts and projections? Several papers in peer review show the flaws.
Ba how is this for supporting science?:
http://books.google.com/books?id=CS8-uzm3cvUC&printsec=frontcover&dq=global+warming+hoax&hl=en&ei=_ZNtTb-CEdP0gAeX3YCYBA&sa=X&oi=book_result&ct=result&resnum=3&ved=0CEkQ6AEwAg#v=onepage&q&f=false
If Fred Singer’s foward and Larry Bell’s book are not enough, why don’t you check out some of Dr. Singer’s work and that of others in climate and meteological science?
Peter Taylor, when you say “…and when confronted with the real scientific uncertainties where choices of some variables (like converting a radiative forcing at the top of the atmosphere measured in watts, to a change in temperature at the surface measured in degrees C ) thought it best to embrace the newly invented precautionary priciple and go with the scarier values for that constant. And also lend consideration to some theoretically large positive feedbacks.”
You are buying into the subjective probability philosophy enamored by many at skepticalscience. The probability of a (say) 5c sensitivity to a doubling of CO2 is 100% or zero, take your pick. The scientific uncertainties you talk about are not measured as probabilities unless you count models with no local weather component that contain arbitrary randomization leading to invented probabilities. Science does not produce probabilistic estimates unless there are real world measurements to back up the probabilities, and in this case there are only inapplicable paleo measurements (from a much drier world, not the current world) and inapplicable modern measurements (i.e. weather, impossible to separate the results of any forcing like volcano cooling or CO2 warming)
The actual reason they like and use subjective probabilities is that it sounds like science and allows them to invoke the precautionary principle. But as I said, the actual probability of thermageddon based on a projection of the paleo record and models is 100% and some of the posters at skepticalscience have the guts to say so. The rest embrace subjective probability because it is better not to sound absolutist. Alternatively, the actual probability of thermageddon is zero based on the thermostat theory proposed here at various times and a much longer trail of paleo evidence. Again take your pick, but don’t fall into the fake probability trap.
KR, (1) GAT just dropped 0.2 degrees late last year. (2) the proxies are smoothed
As one who has spent a huge amount of time collating and translating paleoclimate data into useful form …
… I fully endorse Dr. Hall’s methodology and results here.
I have almost the same chart (at higher resolution).
http://img703.imageshack.us/img703/9484/lasticeageglant.png
If someone wants, I can give you any timeframe back to 635 Mya.
Mike says:
March 1, 2011 at 9:33 am
“You are entitled to your views but one or two ice cores do not provide enough information to reconstruct global climate.”
This is a classic case of the Strawman fallacy. Hall did not assert that he was doing a reconstruction of global climate. In fact, in the article above he denied that he was:
‘So, sure, a single ice core is not a global average temperature record; but it is quite a bit more than one thermometer. It’s just mud-slinging to claim that using it for a climate proxy is “misinformation”.’
The Strawman in the fallacy is Mike’s claim that Hall is using ice cores as a reconstruction of global climate.
Mike, you really should pay the money and take a complete logic course. The help that I can give you on the internet is available only after you have your foot in your mouth, as happens so often.
Climate scientists, so-called, are not scientists. They have not created one reasonably well-confirmed physical hypothesis about the effects of CO2 in Earth’s atmosphere.
It is true that they deploy the 19th century hypotheses about CO2 in the atmosphere. But they have added nothing to that. They have not one reasonably well-confirmed hypothesis about the “forcings” that they toy with endlessly in their computer models.
Jack Greer quotes Dr. Alley:
‘“So, using GISP2 data to argue against global warming is, well, stupid, or misguided, or misled, or something, but surely not scientifically sensible.’
Jack, just curious, can any amount of local data be used to argue against global warming. Let’s say I have some proxy record that covers eighty percent of Earth’s surface for a million years and it shows something like the data that Hall presents. Could something like that serve as evidence? I bet it could not. I bet you have ruled it out on principle. You will insist that we must use Warmista concepts, such as “global average temperature,” which cannot be given any empirical meaning whatsoever. I am right, aren’t I?
I think most people do not understand there is a phenomenon called “polar amplification'” whereby the polar regions change by twice as much as global temperatures. This shows up in every paleoclimate estimate I have ever looked at so it has to be considered as a factual point. Greenland will change by twice as much as the global temperatures (if one is talking about sea level).
Secondly, the altitude and proximity to the ocean is also important.
If one is on top of a 3 km or 4 km high glacier, the proxy data needs to take this into account (3 kms high proxies change by another 50% versus equatorial sea level) and almost none of the pro-AGW papers have made these adjustments.
If one is in the centre of the continents or if the data is sourced from an area in the centre of the continents, the proxies will change by less than the global temperature.
As one uses proxy data that goes further back in time, one has to detrend the proxies because they are subject to periodic incursions of water from earlier periods and the the change seems to be approximately linear over time. If you don’t adjust for this, one finds the proxies indicate the Earth was a snowball until about 100 Mya which it obviously wasn’t.
Overall, the do18 proxies need to be adjusted for latitude, altitude, time and proximity to the ocean. If you have not done this (and it is not a large change required), then your estimates will be off by a quite a bit. Pro-AGW researchers like Richard Alley, are perfectly willing to ignore these issues whenever it suits the pro-AGW position.
feet2thefire says:
“Yet perhaps the greatest scientist of the last 40 years, Freeman Dyson, is frowned upon as “just a physicist,” when he voices skeptical points.”
~ ~ ~
CC: Yea, he was a great physicist, but he also wanted to used nuclear bombs to dig mines and power rocket ships. Even a great physicist can become disconnected.
~ ~ ~ ~ ~ ~ ~
Crispin in Ulaanbaatar says: “priestly class of self-appointed alarmist oracles”
“Must be a slow news week if we have to stoop to mentioning RC and science in the same breath.”
~ ~ ~
CC: Why the need for this kind of constant name calling? Is this a brawl or an attempt to learn about our climate?
~ ~ ~ ~ ~ ~ ~
Smokey says: Excellent article. Michael Mann’s acolytes are the ones who don’t believe in climate change prior to the mid-1800′s.
~ ~ ~
CC: Come on, if you believe that than you’ve never looked at, or listened to, what they are presenting.
~ ~ ~ ~ ~ ~ ~
Oslo says: Skepticalscience is a fundamentalist propaganda site. . . fling links to Skepticalscience, presented as the ultimate “truth”
~ ~ ~
CC: Why this need to demonize?
You folks act like think you having nothing to learn from anyone else?
~ ~ ~ ~ ~ ~ ~
Ged Darkstorm says: Science is about data and data only, it cares not about titles or professions, only data.
~ ~ ~
CC: You forgot the part about having the education and knowledge to interpret the data.
~ ~ ~ ~ ~ ~ ~
J StorrsHall says: This is an interesting hypothesis…..cast a bit longer as a small cabal of otherwise underemployed and career limited physicists at NASA,
~ ~ ~
A small cabal that was joined by many thousands of scientists and scientific academies throughout the world… hmmm.
bubbagyro says: Modeling for persuasive presentations is handy for separation science, however. Separating a VC investor from his money, that is. ~ ~ ~
PR and emotionalism. . . . . goes a long way.
dana1981 says:
March 1, 2011 at 3:18 pm
Lucy:
“If you don’t like the temperature records of the ice cores, then why should you trust the ice core CO2 records?”
CO2 is well-mixed throughout the atmosphere. Rob Honeycutt’s criticism is not the use of ice core data as a temperature proxy, but its use as a global temperature proxy. Temperatures vary significantly around the globe, particularly near the poles. Atmospheric CO2 does not.
===
Good golly Miss Molly…
“CO2 is well-mixed throughout the atmosphere. ” <– not on planet Earth that I've ever seen. The mix lag NH to SH is 12-18 months.
The ics cores are even worse in reflecting such subtle regional changes. We can spend all year snorting the "peer reviewed Ink" but doesn't it ultimately come down to the lack of accurate data and the unwillingness to properly reflect their "hunch"?
I think Mike is concerned that Dr. Hall doesn’t have a certificate on his wall that reads…
Offishul Klimate Si-un-tist
[LOL!]
P.S. What degrees (if any) does Big Mike have? Are they in “Climate Science”? Maybe he can show them to us “engineers” so we can gasp in awe and admiration…
citizenschallenge says:
March 1, 2011 at 6:28 pm
Is that why your comment was loaded with ad homs and snark?
Theo Goodwin said March 1, 2011 at 6:08 pm:
“Jack, just curious, can any amount of local data be used to argue against global warming. Let’s say I have some proxy record that covers eighty percent of Earth’s surface for a million years and it shows something like the data that Hall presents. Could something like that serve as evidence? I bet it could not. I bet you have ruled it out on principle. You will insist that we must use Warmista concepts, such as “global average temperature,” which cannot be given any empirical meaning whatsoever. I am right, aren’t I?”
No, Theo, you are not right. Quality, calibrated proxies covering that percentage of the Earth would, in effect, establish a pretty convincing approximation of “global average temperature”. I’d bet Dr. Alley would agree. That’s not what was presented here today or last February … this in addition to a misleading assertions of phase matching, especially the Younger Dryas event.
@Peter taylor
Why should only Wall Street brokers snort coke and drive Lamborghinis?
What about dendrochronlogists?
citizenschallenge says:
Smokey says: ‘Excellent article. Michael Mann’s acolytes are the ones who don’t believe in climate change prior to the mid-1800′s.’
CC: “Come on, if you believe that than you’ve never looked at, or listened to, what they are presenting.”
Of course I have. Mann’s debunked Hokey Stick shows conclusively that there was little climate change prior to the industrial revolution. Just look at your hero’s anti-science. The shaft of the stick shows almost no temperature variation before the mid-1800’s. And you still believe him.
I’ve read extensively on Mann’s shenanigans in MBH98, MBH99 and Mann ’08. I think he is a conniving charlatan. The emails recorded in The Crutape Letters indict Mann and his clique. Or read A.W. Montford’s The Hockey Stick Illusion. It will open your eyes.
If you’re not interested in reading the skeptical arguments in books, then read Montford’s Caspar and the Jesus Paper, a short exposé of the widespread corruption in mainstream climate science, and the incestuous relationship between people like Caspar Amman and climate journals desperate to retain the rock stars of climatology. They have sold their souls.
The common theme running throughout the “Team” is their desperation to keep everyone in line, and attacking anyone who puts a skeptical thought into words. Their motive is keeping the Billion$ of dollars a year in tax money flowing into “climate science.” They lie for money and fame.
It is all based on the evidence-free fiction that CO2 is causing climate catastrophe. If they don’t keep fanning the flames of runaway global warming fear their funding will begin to dry up. They depend on people like you to repeat the canard that CO2=CAGW, when there is zero evidence of any global harm due to the rise in that essential minor trace gas.
You accuse skeptics of “demonizing” the purveyors of this fraud, when in fact it is charlatans like Mann and his ilk who demonize “carbon,” by which they mean harmless, beneficial CO2. Every prediction of runaway global warming and climate catastrophe has turned out to be false. And yet, you still believe.
@John, “Good golly Miss Molly…
“CO2 is well-mixed throughout the atmosphere. ” <– not on planet Earth that I've ever seen. The mix lag NH to SH is 12-18 months."
Mean Vostok temporal resolution is on the order of decades to centuries, not months. An 18-month lag between NH and SH CO2 has nothing to do with the 1,800 year offset between the Antarctic cooling event and the Younger Dryas. Dana's point is valid.
This concept of polar amplification don’t make sense with the south pole not having heated up. Have I missed something? The warming on the south pole is very low right? Hardly beats the error bars and we are supposed to have polar amplification and global warming, something is not right.
How do the AGW crowd explain this ?
@Smokey, “citizenschallenge says:
Smokey says: ‘Excellent article. Michael Mann’s acolytes are the ones who don’t believe in climate change prior to the mid-1800′s.’
CC: “Come on, if you believe that than you’ve never looked at, or listened to, what they are presenting.”
Of course I have.”
Of course you haven’t, I’m with citizenschallenge here. Find a quote where Mann or any scientist said there was no climate change before the mid-1800s.
Even though he didn’t provide the graph with the red hockey stick blade, Storrs Hall did say the following in the earlier WUWT post, which was criticized at Skeptical Science, when he looked at the Greenland ice core in question.
Well, whaddaya know — a hockey stick. In fact, the “blade” continues up in the 20th century at least another half a degree. But how long is the handle? How unprecedented is the current warming trend?
The ice core data stopped being valid 95 years ago. The implication of the above statement that Greenland’s temperature should go about 0.5C higher.
So the author of the Skeptical Science web page felt justified in adding the global temperature increase in the 20th century to the GISP2 graph, based on Hall’s statement.
Now 0.5C is the approximate average global temperature increase since that time. The actual temperature increase in Greenland over the past 95 years was actually 3 C , according to the following thermometer record:
http://www.appinsys.com/GlobalWarming/rs_Greenland.htm
So the actual 20th century temperature increase in Greenland is unusual with the 3C increase on top of the ice core record.
The Skeptical Science rebuttal was also true. They pointed out that in fact the global temperature reconstructions showed that the increase in global temperature was unusual.
Let’s see
Hide the decline removed a few years of proxy data and plotted instrumental readings instead.
This apparently makes all climate science fake
This posts jiggles dates, changes temperature scale uses data from 2 areas of the globe and manages to prove conclusively climate change is a fraud.
(no info as to the actual changes by the way!)
Truly skeptic logic!
Bill Illis says:
March 1, 2011 at 5:41 pm
If someone wants, I can give you any timeframe back to 635 Mya.
==============================================
Yes please Bill ,It would be interesting to see if there was a similar CO2 increase 65Mya.compared to now, as my research points to history repeating it’s self again.
Bad news – we are way past our ‘extinct by’ date
http://www.guardian.co.uk/science/2005/mar/13/research.science
We ARE in the SAME location as the end-Permian extinction…. AGAIN.
We ARE in the SAME spiral arm as the end-Permian extinction….. AGAIN
We are crossing the SAME thin magnetic disc of the Galactic Plane equator …..AGAIN
We ARE experiencing the SAME increase in Volcanic activity as the end-Permian extinction…. AGAIN
==================================================
We ARE experiencing the SAME increase in Co2 as the end-Permian extinction ….AGAIN
==================================================
We ARE experiencing the SAME increase in OCEAN temperature just before the end-Permian extinction …AGAIN
http://tinyurl.com/4kjw8fz
http://www.myspace.com/my/photos/photo/7971387/AllPhotos
Smokey says:
March 1, 2011 at 11:30 am
You do realize that graph you posted ends in 1855 right? The data literally ends in 1855 and the graph has just been manipulated to look like the red is the hockey stick when it isn’t. You lose all credibility when you post graphs that provide no evidence (or plausibility for comparison). Some people fall for it but I won’t. I think you should acknowledge now for the record that the graph you posted is not in support of your assertion.
You can’t post that without an attempt to compare the two. here are two attempts, neither are perfect but yours certainly is completely wrong.
http://www.skepticalscience.com/pics/GISP.gif
http://www.skepticalscience.com/pics/Gisp2Graphedited.png
BA says:
“Of course you haven’t, I’m with citizenschallenge here. Find a quote where Mann or any scientist said there was no climate change before the mid-1800s.”
Hey, mind-reader. So you know just exactly how much I’ve read up on the charlartan Michael Mann? You must be rich from your stock market ESP.
I don’t need a Mann quote, all I need to see is Mann’s debunked Hokey Stick chart.
Only a credulous fool would believe there was no climate change before the industrial revolution. From your comment, that’s what you believe.
Smokey says: You accuse skeptics of “demonizing” the purveyors of this fraud, when in fact it is charlatans like Mann and his ilk who demonize “carbon,” by which they mean harmless, beneficial CO2.
~ ~ ~ ~ ~ ~ ~
Yea, put your kid’s favorite pets into a room with 1% Carbon Dioxide & 21% oxygen and see what your kids think of that beautiful CO2 and you.
The devil is in the details.
~ ~ ~
ps. I would image you do know a lousy 1% of that life giving CO2 will kill you… right?
robert,
Here’s a clue: click.
Want more? OK:
click1 [not from “1855”]
click2
click3
click4
click5
I have lots more if you’re interested. Just ask.
Michael Mann’s true believers have absolutely no clue about natural climate variability. They believe the climate was static until the industrial revolution. As if. CAGW is their religion, believed entirely based on faith – because there is no empirical evidence supporting their faith-based climate alarmist belief system.
This “Best Science” site has no use for that kind of religious conviction. Present verifiable facts, or go back to Pseudo-Skeptical Science.
citizenschallenge says:
“Yea, put your kid’s favorite pets into a room with 1% Carbon Dioxide & 21% oxygen and see what your kids think of that beautiful CO2 and you.”
You make it way too easy; six inches of water can kill you too.
Get back to us when you get up to speed. I recommend three months of reading WUWT archives first. An hour a day, minimum.
dodge and weave
The message of this thread should distilled and placed on a tee shirt or coffee mug…..
Climate Change ?
always has, always will.
vukcevic says:
March 1, 2011 at 11:00 am
http://www.vukcevic.talktalk.net/gms.htm
vukcevic – what are the green, red, blue lines? the data looks very significant but I can’t find the key explaining what you are measuring.
Smokey says: Hey, mind-reader. So you know just exactly how much I’ve read up on the charlartan Michael Mann?
I don’t need a Mann quote, all I need to see is Mann’s debunked Hokey Stick chart.
~ ~ ~
How can you know if he is a charlatan if you haven’t investigated what he actually has to say?
How do you know that the folks who feed you that “debunked Hokey Stick” aren’t the charlatans if you are unwilling to familiarize yourself with the full spectrum of information?
~ ~ ~
At least I do the skeptics the courtesy of reading what they have to offer, but than I’m into thinking about the whole thing and not just proving my point-über-alles. Learning, after all, is the best part of science.
http://en.wikipedia.org/wiki/Carbon_dioxide
CO2 is toxic in higher concentrations: 1% (10,000 ppm) will make some people feel drowsy. Concentrations of 7% to 10% cause dizziness, headache, visual and hearing dysfunction, and unconsciousness within a few minutes to an hour.[7]
As of October 2010[update], carbon dioxide in the Earth’s atmosphere is at a concentration of 388 ppm by volume.[1] …Taking all this into account, the concentration of CO2 grew by about 2 ppm in 2009.
So, at the current rate of increase, in about 4806 years some of us might start to feel drowsy. ENGAGE WORRY MODE.
http://www.nap.edu/openbook.php?record_id=11170&page=47#p20012eca9960047001
Submarine crew are reported to be the major source of CO2 on board submarines (Crawl 2003). Data collected on nine nuclear-powered ballistic missile submarines indicate an average CO2 concentration of 3,500 ppm with a range of 0-10,600 ppm, and data collected on 10 nuclear-powered attack submarines indicate an average CO2 concentration of 4,100 ppm with a range of 300-11,300 ppm (Hagar 2003).
BA:
Find a quote where Mann or any scientist said there was no climate change before the mid-1800s.
Briefly, BA, “climate change” = “CO2=CAGW”. Right?
The current meaning of the term “climate change” is obviously the result of the specific and intended word game employed by the CO2=CAGW Climate Science Propaganda Operation to change the meaning of words and concepts as needed so as to create confusion and even to try to falsely establish fact, or most importantly somehow garner the support its manipulators need to accomplish their ulterior goals = various binges of looting and controlling or even Totalitarianism, partly via the confused meanings themselves which are really the product of an attempt to achieve thought control, from which all other control can follow.
So that, BA, at least as of right now, I’m afraid you lose if we apply the current useage of “climate change” as desired and established by Climate Science itself and as dutifully repeated by a lot of hapless and willing dupes .
Therefore, according to Mann, enc., voila, there was no “climate change” prior to the mid-1800’s.
But surely, BA you can’t want these sort of people to be running anything, much less your life, your country, or the whole world, can you?
Actually all this to-and-froing about the GISP record ending in 1855 is easily rectified since there is a weather station at Summit where the core was taken. The annual mean temperature there is -31 C (ref Journal of Glaciology 54:839 (2008)).
This means that the temperature has risen by about 1 degree since 1855, but is still colder than almost the entire Holocene.
f. berple says:
March 1, 2011 at 10:23 pm
vukcevic says: March 1, 2011 at 11:00 am
http://www.vukcevic.talktalk.net/gms.htm
vukcevic – what are the green, red, blue lines? the data looks very significant but I can’t find the key explaining what you are measuring.
The graph is from magnetometer in Tromso, Norway. There are number of those in the Arctic area. Magnetometer measures components of the Earth’s magnetic field:
– Z vertical component –green line
– H horizontal –blue line
Total field strength is the vector sum of these two, units in nano Tesla.
– D declination in degrees.
When geomagnetic storm hits, magnetic field changes fractionally.
You can find more from our resident scientist:
http://www.leif.org/research/suipr699.pdf page 12.
@James Sexton
“It seems, all Dr. Hall is asking for is to be afforded the same respect and treatment given to others. Is that really too much to ask? Do you think it likely he didn’t complain about WUWT because he was afforded fair treatment?”
No, I think it’s wrong-headed of Dr. Hall to expect to be treated as a serious climate researcher if his real expertise is with computer networks and nanotechnology.
My PhD research in an unrelated field would not make me qualified to argue that Dr. Hall’s concept of utility fog is utter balderdash – especially if all I knew about the subject boiled down to the equivalent of a single TED talk. However, Dr. Hall demands that he be afforded professional respect in an area where he is just another ignorant amateur.
citizenschallenge
“At least I do the skeptics the courtesy of reading what they have to offer, but than I’m into thinking about the whole thing and not just proving my point-über-alles. Learning, after all, is the best part of science.”
If you truly practiced science, then you would practice the art of skepticism. After another month of worldwide below normal temps (and many more to come), the catastrophic CO2 theory will be falsified. btw “than” should be “then”… and I also read what the denialists of natural climate change have to offer,but then I am into looking at the whole thing and not proving my point-über-alles. Whatever that means.
From citizenschallenge on March 1, 2011 at 10:25 pm:
How can one know that Communism doesn’t work if they haven’t read The Communist Manifesto?
How can one claim the political system of Germany during WWII was evil and wrong without reading Mein Kampf?
Just because what came from those works was garbage and failure, doesn’t necessarily mean what is in those works was wrong! How can you know that those who said those results were garbage and failure aren’t charlatans, when you haven’t studied those works yourself?!
(/mock)
citizenschallenge says (March 1, 2011 at 9:17 pm): “Yea, put your kid’s favorite pets into a room with 1% Carbon Dioxide & 21% oxygen and see what your kids think of that beautiful CO2 and you.”
Well, that would depend on the other 78% of the air in the room. If it’s fluorine, carbon monoxide, or any number of other substances, the pets are screwed. If it’s something relatively benign, like nitrogen, then as ferd berple pointed out above, the pets are probably fine. Unless the room is hyperbaric, because then they could suffer from nitrogen narcosis. Then there’s the temperature of the room…
Dang, this science stuff is complicated! 🙂
Help us to ban the Inconvenient Truth from schools. Zero background in any subject does not make you automatically wrong. Look at the Moon and not the finger. ;O)
The essential problem with Mann is that his flawed 98/99 work was embraced and front-paged by the IPCC when it should have been ignored. Surely Briffa and others knew that. As a result a good chunk of the hockey team was forced to prevaricate and stonewall for years as they gradually rectified Mann’s conclusion. Perhaps they believe that is how science is supposed to work but from my perspective and many other people who have studied this for years, it isn’t working. How many more pictures of bore holes starting in the LIA do they expect us to swallow?
BA says:
March 1, 2011 at 7:58 pm
“…Of course you haven’t, I’m with citizenschallenge here. Find a quote where Mann or any scientist said there was no climate change before the mid-1800s….”
Since we can’t find a quote from Mann et al. asserting there’s never been climate change in the past, I can assert they believe there’s been climate change in the past? Then the hockey stick graph is definitely a fabricated lie. Or climate change can occur without a change in global mean temperature. Which way would you have it?
In addition, can I also assert that they know climate change in the past was far larger than anything humans could do, since they made no statement that climate hadn’t happened in the past?
Oh how the warmists twist logic into all sorts of contortions to torture their meme out of thin air.
re: eadler
“Now 0.5C is the approximate average global temperature increase since that time. The actual temperature increase in Greenland over the past 95 years was actually 3 C , according to the following thermometer record:
http://www.appinsys.com/GlobalWarming/rs_Greenland.htm
So the actual 20th century temperature increase in Greenland is unusual with the 3C increase on top of the ice core record.”
I see your 3 degrees warming in 95 years and raise you 8 degrees in just forty. That’s just one of more than two dozen rapid warming episodes during the last glacial period known as Dansgaard-Oeschger events. Typically temperatures in Greenland rose by up to about 10-12 degrees in a few decades. D-O events were first detected in GISP2 but on re-examination were also found in the earlier ice core. Indications that these were indeed widespread climate fluctuations have been shown in many other paleo proxies. Note that the Antarctic ice cores show a much smaller cooling at the same time but whether the two poles really are connected in some kind of seesaw effect is still contested.
I really do recommend you look more closely at the Greenland ice core records and read up on Dansgaard-Oeschger events. Dr Alley is among many scientists who have published work on these abrupt climate changes. The papers on this are truly fascinating, especially if you read them in order of their publication date, as you will witness the gradual acceptance that these Dansgaard-Oeschger events are indeed a marker for widespread, likely hemispheric, if not global climate disruptions. What causes these events is hotly contested as well as the proposed cyclicity of 1470 years. I favour the suggestion that they are caused by atmospheric-oceanic mechanisms we do not yet fully understand.
Whatever causes them, whatever they might signify, at the very very least, one can conclude at a bare minimum, that these rapid warming events put paid to any claim that Greenland has experienced “unusual” or as often claimed unprecedented warming in the last 100 years.
re: eadler
“Now 0.5C is the approximate average global temperature increase since that time. The actual temperature increase in Greenland over the past 95 years was actually 3 C , according to the following thermometer record:
http://www.appinsys.com/GlobalWarming/rs_Greenland.htm
So the actual 20th century temperature increase in Greenland is unusual with the 3C increase on top of the ice core record.”
I see your 3°C warming in 95 years and raise you 8°C in forty. That’s just one of more than two dozen rapid warming episodes during the last glacial period known as Dansgaard-Oeschger events. Typically temperatures in Greenland rose by up to about 10-12°C in a few decades. D-O events were first detected in GISP2 but on re-examination were also found in the earlier ice core. Indications that these were indeed widespread climate fluctuations have been shown in many other paleo proxies. Note that the Antarctic ice cores show a much smaller cooling at the same time but whether the two poles really are connected in some kind of seesaw effect is still contested.
I really do recommend you look more closely at the Greenland ice core records and read up on Dansgaard-Oeschger events. Dr Alley is among many scientists who have published work on these abrupt climate changes. The papers on this are truly fascinating, especially if you read them in order of their publication date, as you will witness the gradual acceptance that these Dansgaard-Oeschger events are indeed a marker for widespread, likely hemispheric, if not global climate disruptions. What causes these events is hotly contested as well as the proposed cyclicity of 1470 years. I favour the suggestion that they are caused by atmospheric-oceanic mechanisms we do not yet fully understand.
Whatever causes them, whatever they might signify, at the very very least, one can conclude at a bare minimum, that these rapid warming events put paid to any claim that Greenland has experienced “unusual” or as often claimed unprecedented warming in the last 100 years.
@David, “Since we can’t find a quote from Mann et al. asserting there’s never been climate change in the past, I can assert they believe there’s been climate change in the past?”
Re the first, you can’t find a quote because they never said that.
Re the second, of course it’s true, they believe there has been past change and have written much about it.
“Then the hockey stick graph is definitely a fabricated lie.”
Here you jump off the board. That does not follow at all. Mann’s reconstruction and many others show climate change in the past. Newer reconstructions by different research teams show more agreement about past climate change than the older ones did. That’s one sign that they’re tending to get better as more data come available and improved methods are applied. When new data supercede the old, as Mann (2008) does Mann (1998), that does not mean the old data were a “fabricated lie.” It’s the normal progress of science.
“Or climate change can occur without a change in global mean temperature.”
Sure it could, but that would show up in contrasts among regional proxies, not (by definition) in a global composite. Climatologists including Mann have written a lot about that too. You’ve read none of it?
“Which way would you have it?”
None of your “if … then” formulations make sense to me. I don’t know why you think they do.
“In addition, can I also assert that they know climate change in the past was far larger than anything humans could do, since they made no statement that climate hadn’t happened in the past?”
You can assert anything, obviously.
“Oh how the warmists twist logic into all sorts of contortions to torture their meme out of thin air.”
That’s what your post did.
@JPeden, “Briefly, BA, “climate change” = “CO2=CAGW”. Right?”
Wrong.
“The current meaning of the term “climate change” is obviously the result of the specific and intended word game employed by the CO2=CAGW Climate Science Propaganda Operation to change the meaning of words and concepts as needed so as to create confusion and even to try to falsely establish fact, or most importantly somehow garner the support its manipulators need to accomplish their ulterior goals = various binges of looting and controlling or even Totalitarianism, partly via the confused meanings themselves which are really the product of an attempt to achieve thought control, from which all other control can follow. ”
Wow.
“So that, BA, at least as of right now, I’m afraid you lose if we apply the current useage of “climate change” as desired and established by Climate Science itself and as dutifully repeated by a lot of hapless and willing dupes.”
I know a lot of climate scientists and read what they actually write. Your description bears no connection to reality, but I can see that you’re certain it’s all true.
“Therefore, according to Mann, enc., voila, there was no “climate change” prior to the mid-1800′s.”
That “voila” only happened in your head. Mann writes much about old climate change. I recommend reading his 2008 or 2009 papers, just to learn what they actually say.
“But surely, BA you can’t want these sort of people to be running anything, much less your life, your country, or the whole world, can you?”
I’ve never met a scientist who wants to run my life, my country, or the whole world. Movie villains do that.
BA claims “That’s one sign that they’re tending to get better as more
data come available and improved methods are applied.”
Just one more example of why lying about Mann’s mistakes is not the right route. Until the team comes clean and explains the mistakes in a full academic paper, there is no reason to take anything they or you say seriously.
BA says:
“When new data supercede the old, as Mann (2008) does Mann (1998), that does not mean the old data were a ‘fabricated lie.’ It’s the normal progress of science.”
Michael Mann lies. Honesty is not in him.
MBH98/99 deliberately and mendaciously hid data that would have falsified the Hokey Stick [which has since been falsified]. Mann hid the data in an ftp file labeled “censored“. That is plainly dishonest. Had Mann used the ‘censored’ data the result would have been declining temperatures, as you can see. So he deliberately hid that data and cherry-picked only the data that showed fictitious warming.
In Mann ’08 he used the Tiljander proxy, which he had been informed, prior to publication, that it was corrupted from road work which had turned the sediments upside down.
Mann used the Tiljander proxy anyway, knowing it was false data. He used it because it gave him the hockey stick shape he wanted. Now Mann is backing and filling, trying to explain that the Tiljander proxy didn’t matter. If so, why did he use it anyway, when he knew it was corrupted?
Michael Mann is a serial liar, and it astonishes me that you are blind to that verifiable fact.
Maren says:
March 2, 2011 at 3:44 am
I really do recommend you look more closely at the Greenland ice core records and read up on Dansgaard-Oeschger events. Dr Alley is among many scientists who have published work on these abrupt climate changes. The papers on this are truly fascinating, especially if you read them in order of their publication date, as you will witness the gradual acceptance that these Dansgaard-Oeschger events are indeed a marker for widespread, likely hemispheric, if not global climate disruptions. What causes these events is hotly contested as well as the proposed cyclicity of 1470 years. I favour the suggestion that they are caused by atmospheric-oceanic mechanisms we do not yet fully understand.
Whatever causes them, whatever they might signify, at the very very least, one can conclude at a bare minimum, that these rapid warming events put paid to any claim that Greenland has experienced “unusual” or as often claimed unprecedented warming in the last 100 years.
The last D O event ocurred 11,000 years ago. This kind of event is unusual in human history as is the climate change we are experiencing today. There is no indication that I have read that the current warming is a D O event. Certainly the expert, Dr Alley doesn’t believe this. Here is what he says about your argument that the current change in climate is nothing unusual.
http://dotearth.blogs.nytimes.com/2010/02/08/richard-alley-on-old-ice-climate-and-co2/
Thirdly, demonstration that there have been large climate changes in the past without humans in no way demonstrates that humans are not now responsible. Many people have died naturally but murder still exists; it is up to the police to learn whether a given mortality was natural or not, and up to climate science to learn what is causing ongoing changes (and we have good confidence that most of what is happening to climatic global average surface temperature is being caused by humanity now). Similarly, demonstration that life, and humans, survived warmer temperatures in the past in no way shows that warmer temperatures in the future are good for us. If you don’t care about humans and other things with us here, making a big change in climate might be an interesting experiment. Evolution does respond to climate change and produce novel results. I just happen to have a personal bias (shared, I believe, by the majority of the six-plus billion people on the planet) that we should ask what is best for humanity, and pursue that. An opinion, surely, and not purely scientific, but that’s my bias.
The first recourse of a weak mind, “kill the messenger”. The second is little better, “burn the message without reading and considering what it says”. Willis recently wrote a piece about trashing the messenger and not considering his message. We live in a lopsided, idiotic, wicked time. Probably something to do with all the junk they add to food these days.
PS: Regarding the North Pole-South Pole time and temp difference, sounds like a natural.
Lucy Skywalker says: March 1, 2011 at 12:57 pm
…………..
a) with some difficulty
b) impossible
but thanks for the invite.
See update: http://www.vukcevic.talktalk.net/gms.htm
kadaka (KD Knoebel) says: reply to: citizenschallenge on March 1, 2011 at 10:25 pm:
“How can one know that Communism doesn’t work if they haven’t read The Communist Manifesto?
How can one claim the political system of Germany during WWII was evil and wrong without reading Mein Kampf?, etc”
~ ~ ~
Oh so this is all about politics and not about science !
~ ~ ~ ~ ~ ~ ~ ~ ~
Gary Hladik guess I shouldn’t have deleted including that 78% nitrogen. But my bigger screw up was using 1% instead of 5%. sorry… but my actual point being that trying to characterize CO2 as totally benign is just another rhetorical trick to keep us preoccupied with distractions.
~ ~ ~ ~ ~ ~ ~ ~ ~
http://www.inspectapedia.com/hazmat/CO2_Exposure_Limits.htm
In summary, OSHA, NIOSH, and ACGIH occupational exposure standards are 0.5% CO2 (5,000 ppm) averaged over a 40 hour week, 0.3% (3,000 ppm) average for a short-term (15 minute) exposure [we discuss and define “short term exposure limits” STEL below], and 4% (40,000 ppm) as the maximum instantaneous limit considered immediately dangerous to life and health. All three of these exposure limit conditions must be satisfied, always and together.
~ ~ ~
http://docs.google.com/ Toxic Chemical Fact Sheets: CO2
• 2,000 – 5,000 ppm – level associated with headaches, sleepiness, and
stagnant, stale, stuffy air. Poor concentration, loss of attention, increased heart
rate and slight nausea may also be present.
• >5,000 ppm – Exposure may lead to serious oxygen deprivation resulting in
permanent brain damage, coma and even death.
~ ~ ~ ~ ~ ~ ~ ~ ~
My actual point being that trying to characterize CO2 as totally benign is just another rhetorical trick to keep us preoccupied with distractions rather than serious examination of the situation at hand.
citizenschallenge says:
“…trying to characterize CO2 as totally benign is just another rhetorical trick to keep us preoccupied with distractions.”
Show us, with convincing empirical evidence, that CO2 has caused global harm. Because that is the claim of the alarmist crowd. If you can not show convincing evidence of global harm from CO2, then it is you who are using ‘rhetorical tricks.’
If I claim that beach sand is increasing, and that it is a hazard to vacationers, then the onus is on me to show convincingly that increased beach sand is causing harm.
Same with CO2. Where is your evidence?
Next, you are posting misinformation, whether deliberately or inadvertantly:
That is wrong. Here is some real world evidence:
My boy was a nuclear reactor technician on the USS Helena, a nuclear powered attack submarine, for six years. We discussed this issue several times. He told me that the crew could operate in up to 5,000 ppm CO2 for months at a time. There is no way the Navy would allow a CO2 concentration in a nuclear sub that caused “poor concentration” and “loss of attention.”
Here are some selected CO2 concentrations taken from a reliable source:
You are posting the misinformation of others. I’m happy to have the opportunity to set the record straight.
BA says:
March 1, 2011 at 7:42 pm
@John, “Good golly Miss Molly…
“CO2 is well-mixed throughout the atmosphere. ” <– not on planet Earth that I've ever seen. The mix lag NH to SH is 12-18 months."
Mean Vostok temporal resolution is on the order of decades to centuries, not months. An 18-month lag between NH and SH CO2 has nothing to do with the 1,800 year offset between the Antarctic cooling event and the Younger Dryas. Dana's point is valid.
=========
Thanks BA,
Mean Vostok temporal resolution is on the order of decades to centuries, not months.
Exactly, so why are they presenting charts and graphs implying some linear understanding of past events?
There isn’t any linear understanding, its simply missing data and circumstantial assumptions that connect the sample points or am I missing the “point”?
BA:
I’ve never met a scientist who wants to run my life, my country, or the whole world. Movie villains do that.
And:
When new data supercede the old, as Mann (2008) does Mann (1998), that does not mean the old data were a ‘fabricated lie.’ It’s the normal progress of science.
So, BA, you think you’ve proven via your mere denialistic postulate that only movie villians want to control people and/or the world? BA, please get serious. Even if you have no knowledge or memory of Hitler’s Nazi Socialism or the previous “Soviet Union’s” enlsaving Communism, both also having designs on ruling the World, have you not at least noticed what’s going on right now in North Africa and the Mideast? Not to mention Communism’s impressive “equality” of enslavement and abject poverty persistently existent, apparent, and well documented in North Korea?
Then you also think you’ve proven that Mann’s bizarre Hockeystick concoction was not “fabricated” in some important sense, just because it was possible, before having been proven to be so, that it was not fabricated, which to you entirely magically or wishfully proves that Mann’t Hockeystick “science” was even a wonderous achievement without which science couldn’t have progressed?
Attn., BA! The Hockeystick “science” and the CO2=CAGW Climate Science “climate change” Propaganda Operation which it serves, specifically avoid using the scientific method and its principles, and instead offer up only a littany of illogical, nonrational, and nonscientific-“fact” tactics avoiding reality – just like you did to serve your severe denial – but in its/their case in order to manipulate people so that they can be controlled and parasatized, instead of either helping them or at least furthering science’s and people’s understanding.
BA, wake up! They want to control and either loot or enslave you, too. And so far you seem to be a great fit for that! On the other hand, Climate Science, enc., does need people like you for it to “work”. So it appears you’ve got a choice to make, that is, unless you simply desperately need to be controlled, or that’s just your nature such that you couldn’t make it anyway without essentially being enslaved or told what to do for your whole life, and you instinctively know it as a congenital groupist, groupthink included.
But if you want to join up with Climate Science, enc., could you at least leave the rest of us safely out of your personal Utopia? After all, it does seem to already exist elsewhere!
Regarding the Greenland Ice Core data….I read what Dr Alley said in the NY Times, and he really skirts around the central issue: which is that the periodicity of recent warming periods on Greenland would point to another such period at about this time – roughly 1000 years after the last. He accepts that the natural causes of such warmings are not known – but there is plenty in the literature to suggest they may be linked to solar UV cycles. The solar cycles peaked at the end of the 20th century at the same time as the Greenland temperatures.
There is a lot of uncertainty in the carbon dioxide model – the relation of computed Radiative Forcing (at 10km altitude and measured in watts/sq metre) and actual temperatures at the surface is not known exactly – you can find factors ranging from 0.4 to 0.8 for conversion of 1 watt to degrees C. All honest climate scientists will admit this (though not all know about it!). Thus, if you have, say, an RF of 1.6 watts/sq m – (and the forcings are of this order), you get a range from o.64 to 1.28 C at the surface. It is difficult to know which factor applies because the oceans cause a time lag. The 0.4 factor corresponds to a temperature rise of 0.7 C over the 20th century for a net 1.6 watts forcing and this does not allow for the unknown solar contributions (via UV or cosmic rays on clouds or any other mechanism, nor for ocean cycles). That is to say – this factor of 0.4 is very likely still too high.
The expected Radiative Forcing by 2050 for all GHGs is of the order of 4 watts, and that would give a gross calculation 1.6 C (i.e. another 0.9 to go) ….and no scary climate story; if the IPCC higher factor operates, then you have 3.2 C….which as a global average, is definitely going to disrupt things. There is a lot of scientific discussion about this factor, but I think the evidence points to below 0.4 and it has been doing for some time, with the IPCC in denial, because they are on record as preferring 0.8.
That’s the basic science in a nutshell. On the one hand you have a lot of scientists with very little interest in proving the 0.8 hypothesis wrong…so they don’t. A few scientists pursue truth – even within the IPCC and have advocated the 0.4 figure (even within the IPCC!).
What is interesting about the GISP core is that there have been studies to correlate the changes in temperature with global CO2 over the last 10,000 years that found no correlation. The Vostok cores show correlation but with huge time-lags of about 1000 years – with changes in temperature preceding changes in CO2.
So – there is a major natural climate mechanism that is cyclic and so far has escaped explanation. The Holocene peaks correlate well to solar cycles – and much work is now looking at UV mechanisms, stratospheric heating and the movement of the Arctic vortex with impacts upon the jetstream – any significant long term shift would impact climate.
The GISP cores are remarkable in that the warming is VERY sudden. To my mind, too quick for many of the proposed mechanisms relating to ocean circulation. It looks to me like rapid shifts in winds – some are in as little as one year and recorded in dust level increases. The big swings in temperature (8 dgrees C) occur within decades and decay more slowly in a saw-tooth pattern.
If you look at the duration of each warming period – then for the core data I have seen (from 50,000 to 30,000 BP) you can see that averaging the periodicity obscures an important part of the pattern. There are 8-10 peaks (some are more distinct – the ealrier part of the cycle) in two distinct cycles and you could just about fit an 8:5:3:2:1 ratio to the duration…a Fibonacci series. This spiral mathematics points to an unusual climate mechanism – some would argue for stochastic resonance within the system; but I would look to the Sun, where spiral mathematics rules, at least in relation to the transfer of angular momentum.
Finally – the last 10,000 years of the Holocene does not show any D/O events as such, but there is a faint hint of the series from the Holocene Optimum onwards. The amplitude is less (2-3 degrees C), but the peaks are getting lower and the troughs deeper. We seem to be at the end of the series…so there will be a short trough, and then another major rise…or maybe not, if there is some kind of threshold or the Sun does something we cannot predict and it spirals on down.
The irony of all this is that you can make out a convincing scientific case for global cooling since 8000 BP (in cycles) – not good for global food production; and that what little effect CO2 has, will ameliorate (or hide) that decline. But whatever you do, don’t tell my friends in Greenpeace I said that!
My own sense of the GHG effect is that it is not really discernible from the ‘noise’ (natural variability/cycles), but looking at data across all disciplines (oceanography, radiation fluxes from satellite data, cloud cover etc.) there could be a 10-20% carbon dioxide effect to add to the peaks and take away from the troughs.
From a policy perspective (probably too late now to have any influence), that means halving the emissions by 2050 will deal with 5-10% of the driving force. And as a shameless plug…much of this is in my book…’Chill: a reassessment of global warming theory’! (2009)
Bill Illis says:
March 1, 2011 at 5:41 pm
“If someone wants, I can give you any timeframe back to 635 Mya.”
My interest in paleo data extends only to bone fide time-series with a constant sampling rate and some assurance that aliasing is not a problem. If you have a pair of such series other than GISP2 that goes back at least through the Holocene, I’d more than grateful for the plain-text data file.
eadler says:
http://dotearth.blogs.nytimes.com/2010/02/08/richard-alley-on-old-ice-climate-and-co2/
Richard Alley,
I just happen to have a personal bias (shared, I believe, by the majority of the six-plus billion people on the planet) that we should ask what is best for humanity, and pursue that.
Wonderful, Richard! But ipcc Climate Science, enc., did in fact exclude countries containing ~5 billion of the Earth’s 6.5+ billion people from having to follow its own alleged cure to its own alleged disease as comprised by the restrictive Kyoto Protocols. Therefore, eadlers and Alley’s of the world, it appears that ipcc Climate Science does not even believe its own CO2=CAGW “science”.
Even more, where the rubber meets the road, India and China have judged that the ipcc’s alleged cause of its alleged disease, fossil fuel burning in turn producing CO2, is instead the cure to their very real disease disaster, underdevelopment, by producing what they need for their people to progress and be cured of their current disease, electricity power.
It is clear that the ipcc Climate Science does not prove, and doesn’t even try to prove, that its alleged “cure” to its [still only] alleged “disease” is not in fact worse than its still only alleged disease, which it patently is; even as judged by the ipcc, enc.’s, own acts as above and likewise as per the judgment of China and India, as above, who have embarked upon a massive campaign to construct probably as many coal-fired electricity plants as they can.
eadlers of the World, you are so far behind the curve that it seems to be your intention to aggressively get as far behind the curve as possible. The ipcc CO2=CAGW Climate Science Propaganda Operation simply does not care about the wellbeing of the people of the World. Because what it in effect otherwise recommends in practice, dedevelopment or underdevelopment, is already established as a bona fide disease disaster.
If you don’t care about humans and other things with us here, making a big change in
climatepeople’s fossil fuel use might be aninterestingalready “been there, done that”experimentdisease disaster. Evolution does respond toclimate changethe superimposition of a Totalitarian caused disease andproduce novel resultsthat’s what it is doing right now in rejecting the ipcc, enc.’s, CO2=CAGW Climate Science Propaganda Operation’s retrogressive, veritable evolutionary throw-back Totalitarianism. [Alley, edited to make sense…]Analysis of quoted Dr. Alley section, provided by eadler on March 2, 2011 at 6:59 am:
There is a forest. Trees have been falling down due to natural reasons for millenia in this forest, and for no other reasons. One more falls over. That trees have been falling over due to natural reasons for millenia does not demonstrate that this last one did not fall down due to human intervention. But it does yield the requirement of conclusive evidence that this last one fell over due to actions of humans, instead of the natural reasons that have been the only reasons that trees have been falling in this forest for millenia, before it can properly be said that humans caused that last tree to fall.
Television and movies aside, it is doctors who determine whether a death was natural or not. Usually a physician treating a person makes that determination, sometimes a forensic pathologist does so in conjunction with an autopsy. Saying “it is up to the police” is rather silly, people die all the time without any sort of police investigation. Is Dr. Alley implying the police are shirking their duty? Moreover the general presumption is that a death is natural unless there is evidence that may indicate otherwise thus further investigation is warranted.
They have “good confidence” that what is happening to the “climatic global average surface temperature” is mostly humanity’s fault? Can you imagine how that would play out in a criminal court with the “beyond a reasonable doubt” standard? Besides, what is currently happening is cooling. How is humanity responsible for the cooling?
Generally speaking, this indicates the “guilty until proven innocent” mindset among (C)AGW proponents.
We have an entire planet with many areas having different normal temperature ranges. Why can’t we determine if life will improve if one area becomes as warm as another is currently?
Thus we note the proposals to combat “global warming” by various geo-engineering ideas designed to cool the planet.
Note also the assumption that not only do humans have the ability to make a big change in global climate, we are currently doing so.
Thus we face the mandate of evolution, adapt or die. I think we humans can adapt to climate change quite well, especially if things get warmer.
The majority of the six-plus billion people on this planet live in poverty, that which is caused and/or exacerbated by a lack of affordable energy, and will be greatly benefited by sources of cheap energy. What is best for humanity is cheap energy, available where it is needed. Predominantly that will involve an easily-transportable energy source, which contains carbon, either a solid form like coal or similar (coke, petroleum coke, charcoal), or a hydrocarbon that is liquid at normal ambient conditions without compression (diesel, gasoline, etc). This will be converted to beneficial forms of energy, like heat and electricity.
With the change from energy poverty to energy wealth, will come the growth of real wealth. A significant increase in real wealth will be necessary to afford adaption to climate change.
And adaptation is required. Peer-Reviewed Climate Science says that even with drastic reductions in CO2 emissions to levels before the Industrial Revolution, it’ll still take “at least” a millenia to reverse the climate change effect that has already taken hold (reference). Other Peer-Reviewed Climate Science predicts the same even if we shut down civilization and stop all our CO2 emissions immediately (reference).
Thus what is clearly best for humanity, is lots of cheap energy now, which of necessity will come overwhelmingly from carbon-based energy sources for about another century or so, and then dealing with whatever consequences shall come after we are able to afford whatever adaptation is required.
From citizenschallenge on March 2, 2011 at 10:40 am:
Yes! (C)AGW is all about politics, not about science!
You are finally getting it! There is hope for you yet!
☺
Smokey says:
It is interesting that someone calling someone else a serial liar would himself make such factually-challenged claims. In fact, in the supplemental materials to the very article that you are talking about see http://www.pnas.org/content/suppl/2008/09/02/0805721105.DCSupplemental/0805721105SI.pdf ), Mann noted the potential issues that had been raised about the Tiljander proxies (and some other data) and showed what the reconstruction would look like if these data were left out of them:
So, Mann did exactly the right thing in this situation: He did not start arbitrarily eliminating proxies that passed their automated criteria for determining if they correlate with temperature, but in the case where there were serious data quality issues he did re-run his procedures leaving those proxies out to see how much difference it makes to the results and presented this to the scientific community.
It leaves one wondering about the motivations and veracity of those who have made a big deal out of this more than those of Michael Mann!
Joel Shore,
My 5:15 post raised a couple of issues. Naturally as a Mann apologist you’re going to believe his incredible explanation. But the fact is that Mann was told before he published that the Tiljander proxy was NFG. He used it anyway – and he made no notation or footnote of the problems at the time. That is scientific misconduct.
But it is minor compared with Mann’s deliberately mendacious hiding of the “censored” file which, had he used the data, would have shown declining temperatures instead of rising temperatures. Go ahead, look at it.
Go, Cuccinelli!
Smokey,
No…What I am believing is my own eyes…what my eyes, your eyes, or anybody else’s eyes can read by clicking on the link that I provided to the supplemental materials at the PNAS website. What you are believing is a version of reality carefully constructed by those who agree with you.
As for the whole “censored” thing, as I understand it, this is just work relating to Mann’s 1999 paper here: http://www.ltrr.arizona.edu/webhome/aprilc/data/my%20stuff/MBH1999.pdf :
Usually, the best strategy for censoring something that you don’t want others to find out about does not involve talking about it in GRL (although a colleague of mine tells his students that he would advise the government to hide their top nuclear secrets in our laboratory manuals since it appears that these never actually get read by the students).
Again, the fact that so much has been made of this says a lot more about the crowd that you trust than about Michael Mann.
Joel Shore,
I’m not going to get into an endless debate with someone hopelessly afflicted with cognitive dissonance. So you get to have your last Michael Mann apologia.
Mann was completely uncooperative regarding the censored data. Where is the scientific method?? Answer: there is none with Mann. He is a devious charlatan pushing a self-serving agenda. Like any charlatan he hides out from scrutiny. Al Gore’s refusal to debate his position has nothing on Michael Mann, who only pontificates from the safety of his ivory tower. If he believed the horse manure he was shoveling he would argue it with all comers. Instead, he hides.
And this isn’t about nuclear secrets, as you allude; this is climate and weather data that Mann deliberately hid. Paid for by the taxpaying public.
I read your PNAS link. It is dated 2010. Mann’s paper, hand-waved through pal review, was published in 2008. His 2010 excuses were ginned up because Mann was caught passing off a corrupted proxy – after he was caught. Now, he improbably claims that he never really needed to use that proxy. If you believe that I’ve got a bridge I’d like to sell you. You can collect tolls from it forever. I promise.
Richard Alley:
Many people have died naturally but murder still exists; it is up to the police to learn whether a given mortality was natural or not,[GLo’ P] and up to climate science to learn what is causing ongoing changes (and we have good confidence that most of what is happening to climatic global average surface temperature is being caused by humanity now).
GLo’P = Great Leap of Pea, right into another world where “I say it, therefore, it is true”, far from the previous one where “murder” is always caused by humans, by definition, and as “unnatural” in that sense; but where hardly anyone denies that murder has existed for a long time, even “naturally”..
If Alley thinks that overtly “begging the question” jump even makes a valid analogy which proves his case, let’s be charitable and conceed that he must have grown up surrounded by Mexican Jumping Beans.
citizenschallenge says (March 2, 2011 at 10:40 am): ” but my actual point being that trying to characterize CO2 as totally benign is just another rhetorical trick to keep us preoccupied with distractions.”
Well, to my mind, when we’re discussing CO2 as a so-called “greenhouse gas”, bringing up its toxicity counts as a “distraction”, especially since it’s not toxic at atmospheric levels reachable by burning fossile fuels. Don’t get me wrong, I quite enjoy the topical excursions typical of WUWT comment threads, but anyone who doesn’t probably shouldn’t add to the problem.
JPeden says:
March 2, 2011 at 1:31 pm
eadler says:
http://dotearth.blogs.nytimes.com/2010/02/08/richard-alley-on-old-ice-climate-and-co2/
Richard Alley,
“I just happen to have a personal bias (shared, I believe, by the majority of the six-plus billion people on the planet) that we should ask what is best for humanity, and pursue that.”
Wonderful, Richard! But ipcc Climate Science, enc., did in fact exclude countries containing ~5 billion of the Earth’s 6.5+ billion people from having to follow its own alleged cure to its own alleged disease as comprised by the restrictive Kyoto Protocols. Therefore, eadlers and Alley’s of the world, it appears that ipcc Climate Science does not even believe its own CO2=CAGW “science”.
Rpeden,
Your rant regarding the IPCC is incorrect. The IPCC has recommended mitigation activities, but no countries are specifically excluded or included. You are talking about the Kyoto Protocol, which is a political agreement. Scientists had nothing to do with inclusion or exclusion of countries from any obligations under the protocol.
Even more, where the rubber meets the road, India and China have judged that the ipcc’s alleged cause of its alleged disease, fossil fuel burning in turn producing CO2, is instead the cure to their very real disease disaster, underdevelopment, by producing what they need for their people to progress and be cured of their current disease, electricity power.
This is clearly a trade off between tackling long term and short term problems. Short term wins out because the public doesn’t have the vision to see the long term. If the public doesn’t have the understanding and the foresight to buy into solving the long term problem, the politicians won’t do it.
In fact, the Chinese recognize the importance of clean energy technology, while they are building coal plants. They are in the forefront in the development of solar, wind and thorium nuclear reactors. The US is way behind the curve on all of these.
Smokey says:
March 2, 2011 at 11:24 am
citizenschallenge says:
“…trying to characterize CO2 as totally benign is just another rhetorical trick to keep us preoccupied with distractions.”
~ ~ ~
Show us, with convincing empirical evidence, that CO2 has caused global harm. Because that is the claim of the alarmist crowd. If you can not show convincing evidence of global harm from CO2, then it is you who are using ‘rhetorical tricks.’
~~~~~~~~~~~~~~~~~~~~~~~
Tragically It is impossible to show you and your friends that information ~ since you refuse to look at it in good-faith!
The evidence is there!
But it’s on the other side of that political line you folks seem to have drawn and refuse to look beyond.
kadaka (KD Knoebel) says:
March 2, 2011 at 2:11 pm
From citizenschallenge on March 2, 2011 at 10:40 am:
Oh so this is all about politics and not about science !
Yes! (C)AGW is all about politics, not about science!
You are finally getting it! There is hope for you yet!
☺
~~~~~~~~~~~~~~~~~~~~~~~~~~~~~~~~~~~~~~~~
Now it’ll be a really great day when you figure out which side has the science and which is a well oiled propaganda machine.
😉
kadaka (KD Knoebel) says:
March 2, 2011 at 1:34 pm
Analysis of quoted Dr. Alley section, provided by eadler on March 2, 2011 at 6:59 am:
“Thirdly, demonstration that there have been large climate changes in the past without humans in no way demonstrates that humans are not now responsible.”
There is a forest. Trees have been falling down due to natural reasons for millenia in this forest, and for no other reasons. One more falls over. That trees have been falling over due to natural reasons for millenia does not demonstrate that this last one did not fall down due to human intervention. But it does yield the requirement of conclusive evidence that this last one fell over due to actions of humans, instead of the natural reasons that have been the only reasons that trees have been falling in this forest for millenia, before it can properly be said that humans caused that last tree to fall.
The argument that past climate change being natural does not prove that current climate change is not due to humans is clearly logical and correct. The argument does not make a judgment about whether or not humans are responsible. In this investigation into the cause of death, the coroners have determined that humans are the culprit in the case of the current climate change. Based on 2 polls of active climate science researchers, 97% of them believe that the earth is warming and humans are responsible.
There are some people who don’t want to believe it, but the experts have spoken.
I’ve followed Dr Alley’s work for some time now. In the early days, before AGW attracted really enormous amounts of money, his rational was very scientific but in the last 10-15 years he has begun his shift to the dark side. What I find interesting is that he gets to the logic where “past climate change has been greater and more volatile than present without CO²” and then immediately shift to another logic which says “but that doesn’t mean mankind is not causing this latest warming”. It’s the same mantra that eminates from all the trolls here. If climate has change rapidly in the past, more rapidly than now and during periods of higher CO² then how in hell’s name can you attribute the recent warming (before 2000, 10 years ago) to man? This is plain stupid or fraudulent. You choose which.
Now it’ll be a really great day when you figure out which side has the science and which is a well oiled propaganda machine.
I suggest you read the financial reports of the oil majors more carefully. Look how much UEA received and the unis in USA.
Joel Shore, read Montford’s book, Hockey Stick Illusion, because it explains what is wrong with Mann’s early work, and what is wrong with science (coverup of errors, etc). If you have issues with specifics, that’s fine, but I would like to hear how you address the general problems noted in the book.
Citizens Challenge, you say “But it’s on the other side of that political line you folks seem to have drawn and refuse to look beyond.” Please try to understand why so many of us have wasted so much time on such a nonissue. It is not from political bias as you would dearly like to believe, but because we believe in science. We believe that science (e.g. statistics) is not a kudgel to provide propaganda points like the hockey stick. If such mistakes happen they should be quickly corrected, not defended in circles for years. Start with Mann’s data normalization: normalizing over the instrument interval rather than the whole record, followed by PCA, selects samples with the highest variance over the instrument interval (i.e. flattens the stick part of the hockey stick). Not hard at all to understand, not political, just an error. Not caught but rather celebrated in the IPCC report.
Years upon years of stonewalling and obfuscation follow. Yet you waltz in lately and say we are just being political. Well, you are wrong about that.
@Dr. J Storrs Hall
“Nowhere near a perfect match, but it’s pretty clear that these are all from the same planet. Even Vostok shows the Younger Dryas, which is generally believed to be a mostly northern-hemisphere event.”
@Rob R
“1. So when the Greenland and Antarctic temperature graphs are overlaid, one on the other, the position of the temperature peaks actually should be displaced by around 800 to 1500 years.
“2. It is becoming increasingly clear that the Younger Dryas is not represented in Antarctic Ice Cores. The cooling event one sees in the Vostok core dates from around 15,000 years ago. It is called the “Antarctic Cold Reversal (ACR)” and can also be found in climate records from New Zealand, Tasmania and Chile. This event predates the Younger Dryas by at least 1000 years. It is another manifestation of anticorrelation or at least “phase shift” between events at the two ends of the world.”
@BA
“There was no science posted by Hall. He threw insults, then showed a line graph he’d put together from data found on the internet. Waving at this graph he declared
“Nowhere near a perfect match, but it’s pretty clear that these are all from the same planet,”
which nobody ever disputed, and
“Even Vostok shows the Younger Dryas”
which is wrong enough to be a test of what his readers know about science.”
@Bill Illis
“As one who has spent a huge amount of time collating and translating paleoclimate data into useful form …
… I fully endorse Dr. Hall’s methodology and results here.
I have almost the same chart (at higher resolution).”
@Jack Greer
“… misleading assertions of phase matching, especially the Younger Dryas event.”
@BA
“Mean Vostok temporal resolution is on the order of decades to centuries, not months. An 18-month lag between NH and SH CO2 has nothing to do with the 1,800 year offset between the Antarctic cooling event and the Younger Dryas.”
@John from CA
“Exactly, so why are they presenting charts and graphs implying some linear understanding of past events?
There isn’t any linear understanding, its simply missing data and circumstantial assumptions that connect the sample points or am I missing the “point”?”
Well I sure am missing a point or something here!
Given the phase angle between the two sides of opinion, it doesn’t seem to be established with any degree of certainty whether or not the Younger Dryas is even represented in the Vostok core. So is it or isn’t it? And does the graph genuinely depict correlation or does it not?
It doesn’t look like a “manifestation of anticorrelation” to me, but what would I know!
eadler:
peden,
Your rant regarding the IPCC is incorrect. The IPCC has recommended mitigation activities, but no countries are specifically excluded or included. You are talking about the Kyoto Protocol, which is a political agreement. Scientists had nothing to do with inclusion or exclusion of countries from any obligations under the protocol.
Briefly, that’s a distinction without a difference. You probably don’t believe the alleged “science” yourself, as judged by your acts. If not, would that also be “political”? Does Al Gore act like he really believes the alleged CO2=CAGW “science”? Are y’all still in love with windmills? And the Stone Age?
Then you diss the Chinese and Indians as though they don’t really know what they’re doing, when their logic makes perfect sense given the facts, as repeatedly and continually demonstrated going forward and even as we speak.
eadler, if what you display here is truely your brain acting freely, in particular without recompense, your thinking has come to the end of its line, and you have proven that at best you have nothing to offer in terms of solutions to real problems concerning the wellbeing of Humanity.
Eadler – you say (or at least my email alert says you say – I can’t see it above) that the experts have spoken!
You could do with a history lesson on the UN’s record of expert judgement! I have been in and out of their panels and committees since about 1982 – though not as recent as some of my colleagues in climate policy (the science advisor to the drowning Pacific Island States and cowriter of the Kyoto Protocol endorsed my book by saying – ‘these questions need answering before we can accept the truth of global warming’) – and so perhaps you will be open to some historical experience:
* the UN panels on the risks of low-leve radiation ALL and to a man, held that there was a threshold beneath which there were no effects. This consensus was overturned eventually by the work of a single (woman) scientist – Dr Alice Stewart, and it took 15 years of dogged battle with the defenders of the orthodoxy, before, for example, X-raying pregnant women was banned;
* UN panels of experts oversaw the release of CFCs (and many other eco-toxic substances) despite warnings regarding the ozone layer;
* UN panels licensed the dumping of nuclear waste in the oceans until that decision was reversed by intense campaigning and public outcry (and they used dodgy GCM models to justify themselves).
I hate to think what the world would look like if individuals had not stood up and persevered against the authorities on environmental science.
And on this particular issue – Prof John Christy is a leading atmospheric physicist, compiler of one of the foremost satellite data sets, and a lead author with the IPCC – in other words, an expert! His estimation of the CO2 GHG contribution to ‘global warming’ is 25% (I came to 20% in my own review). Others within IPCC – who I think are less competent and in defense of old models think it is nearer 75%. There is NO consensus – just a well-chosen majority (chosen by governments) out-voting a minority – that is NOT my definition of a consensus! If Christy is right and you cut emissions of CO2 by half at enormous cost, you will deal with about 10% of the driving force of climate change. That is – no significant effect. If the world gets warmer, it will be just 10% warmer than it would be without us, and if it gets colder – which many students of natural cycles thing will happen int he next two decades, then CO2 will just take the edge of that cold.
Smokey says:
Where is it dated thus? It is the supplement connected to their paper. The URL has within it “2008/09/02/” which I assume is the date associated with that paper.
Smokey, have you noticed that in this whole debate, I link to the primary sources, i.e., the original papers by Mann, and all you ever link to is secondary sources who, to put it charitably, are not completely without their own biases.
From citizenschallenge on March 2, 2011 at 9:04 pm:
Did that years ago. To identify a well-oiled propaganda machine, just follow the money and see who gets the payoffs.
Governments get to tax “carbon emissions” and raise revenues while seizing additional regulatory power? Governments endorse (C)AGW!
“Nonprofits” have an issue suitable for fundraising, drawing in more money as they hype it up higher and higher? “Nonprofits” endorse (C)AGW!
Researchers want grant money and to get papers published in prominent journals? Researchers endorse (C)AGW!
Television networks and print media want to draw in viewers with their “Upcoming Important Disasters!” specials and features? Television networks and print media endorse (C)AGW!
Major companies have a “problem” that they can make major profits selling “solutions” for, with large quantities of government money available for the buying of their “solutions?” Major companies endorse (C)AGW!
Do you want to be ostracized professionally and be regularly attacked by a well-oiled propaganda machine? Do Not Endorse (C)AGW!
J. Shore,
smokey gave you a bad spanking and so did eric (sceptic) and all you did was talk about dates and sources. Do you honestly believe your sources are without any bias?
You didnt answer about stonewalling or manns hiding censored data either. I dont think your a real scientist, you just play one on the intertubes.
March 2, 2011 at 6:55 pm
Smokey says to Joel Shore: “I’m not going to get into an endless debate with someone hopelessly afflicted with cognitive dissonance. So you get to have your last Michael Mann apologia.”
~ ~ ~ ~ ~ ~ ~
Smokey,
you sound like an agenda driven politician more than anyone interested in learning about climate processes.
The thing about learning about climate science is that you actually have to read and think about what the other guy is saying. Something you sound incredibly hostile to.
And as much as you might try to deny it, the “establishment climatology community” has given every conceivable skeptical argument way more airing than the likes of you afford the “consensus science” –
eadler says:
March 2, 2011 at 6:59 am
The last D O event ocurred 11,000 years ago. This kind of event is unusual in human history as is the climate change we are experiencing today. There is no indication that I have read that the current warming is a D O event. Certainly the expert, Dr Alley doesn’t believe this.
Since other commenters have already criticised Dr Alley’s personal reasoning as expressed in the quote you provided, I’ll stick to the argument you make here.
Firstly, the ice core data suggests only that the last clearly discernible D-O event occurred during the current interglacial, 10 500 years ago.
A considerable number of researchers propose that such events have not ceased during the Holocene, but instead registered a much smaller temperature change in Greenland. Stefan Rahmstorff is one of them, he believes not only that D-O events are strongly cyclical – occuring every 1470 years – but that they continued during the last interglacial as well as the current one. (I mention him in particular as he can not be considered a skeptic on AGW.)
Secondly, notwithstanding steadily dropping temperatures since the end of the Holocene climatic optimum 5k years ago, the current interglacial does indeed seem stable on millenial timescales. On centennial and decadal timescales, however, there is significant evidence of climate disruptions in numerous proxies from many locations on the planet, although none of them seem to have been as drastic in their warming as the D-O events during the last glaciation. The Roman and the Medieval Warm period as well as the Little Ice Age are probably the best known of those fluctuations.
Thirdly, global average temperature is nothing more or less than an artificial product. By necessity we are limited to constructing historical global temperatures by combining numerous proxies. As seen in the literature, the debate is still ongoing which of the climate fluctuations suggested by the various proxies are sufficiently widespread to pronounce them global in nature. The state of knowledge in climate science today does not allow one to absolutely pronounce on historical global temperatures, which btw is rightly reflected in the papers themselves where scientists “suggest”, “propose”, ”assume”, and assign likelyhoods – not certainties – to their conclusions that are a far cry from pronouncements of unquestionable truths.
Lastly, returning to Greenland itself. According to the most recently completed Greenland Ice core project, NGRIP, it was 1 to 2 degrees warmer there during the MWP than today.
Thus, I would point out to you that the most recent warming in Greenland, and in the entire Northern Hemisphere, is unprecedented only if you limit your temperature review to less than a thousand years ago. Given that Greenland started warming more than 140 years ago, I suggest that at least part of the 3°C warming you mentioned has natural causes.
P.S. While Dr Alley is one of the most prominent scientists in the field, he is by no means the only expert and others are more cautious in their statements. The curator of NGRIP, Dr Jørgen Peder Steffensen, says the following at the end of the video another commenter linked to earlier in the thread:
“The problem is, that we – and I agree completely that we have had a global temperature increase in the 20th century. Yes. But an increase from what? Probably an increase from the lowest point we’ve had for the last 10 000 years. And this means that it will be very hard indeed to prove whether the increase of temperature in the 20th century was manmade or it’s a natural variation. That will be very hard because we made ourselves an extremely poor experiment – We started to observe metereology at the coldest spot in the last 10 000 years.” [This coldest point was reached 140 years ago]
http://climateclips.com/archives/132
RockyH says:
You are clearly a bit confused here. For example, Smokey talks about “Mann’s deliberately mendacious hiding of the ‘censored’ file which, had he used the data, would have shown declining temperatures instead of rising temperatures”. Then I show how Mann, in his 1999 GRL paper in fact said, “Positive calibration/variance
scores for the NH series cannot be obtained if this indicator is removed from the network of 12 …” In other words, he described the fact that this particular proxy is vital (amongst the datasets that go back for a full millenium) for getting rising temperatures over the period for which we have both instrumental and proxy data.
Where does the “bias” of my sources come in? My source is the actual Mann paper where he seems to talk about what Smokey claims he hid from his fellow scientists.
In other words, you seem to be saying, “Don’t trouble me with the facts…I have already decided that Mann is guilty of these things. So, if you bring facts, I’ll just repeat my mantra over again and hope that nobody notices.”
citizenschallenge says:
March 3, 2011 at 5:09 pm
And as much as you might try to deny it, the “establishment climatology community” has given every conceivable skeptical argument way more airing than the likes of you afford the “consensus science” –
Uh huh, so that’s why, for example, the “establishment climatology community’s” superior Collective Scientific Mind has so assiduously refused to release and has otherwise obstructed the release of its own “materials and methods” science, eh, leading to the necessity of the “skeptics” = real scientists, by the definition of science as given by the scientifc method, having to go to even the FOIA process in order to try to “afford” the CO2=CAGW Climate Science “science” an actual scientific review and hearing?
Your argument above is illogical since it is simply a postulate which also contradicts the facts. Its PNS “quality” wouldn’t be fit enough even for my 7 year old grandaughter, or even on a par with “Dora the Explorer’s” thinking, which starts to address the minds kids at about the age of 4 and up.
Being charitable, since you sound more like a groupthink cloned Parrot, are you by chance eadler’s twin? [My apologies to the real Parrots.]
citizenschallenge has not got a clue about how the scientific method works. Not a clue. Scientific skeptics have nothing to prove. I’m not agenda driven, because I have nothing to prove.
And RockyH says about Joel: “I dont think your a real scientist, you just play one on the intertubes.”
LOL! Too true. Here’s a Joel Shore quote that gives us some insight to his cognitive dissonance:
“The problems lie not with the models but with the observational data itself.”
Ri-i-i-i-i-ght. Observational data is wrong and computer models are right. So why hasn’t Joel made a killing in the market with his fantastic computer models?
And regarding my prior post showing that almost 97% of CO2 is natural, Joel wrote:
“If you don’t want to be taken seriously by any real scientist, I strongly suggest that you continue to repeat the 3% nonsense.”
Well, it’s nonsense to Joel, anyway. But he suffers from cognitive dissonance. Rational adults can just check the IPCC’s numbers.
Smokey says:
Since, unlike you two, I use my real name here, it is easy enough to check my scientific background. Hint: google scholar is your friend.
I don’t think you even quoted the whole sentence, let alone the context around it that provided the reasoning why the data was suspect in the particular case of which I was speaking. It is amusing how someone who has such high standards for the honesty of others seems to have such abysmally low standards for himself!
Let me give you a little hint here…See that number “absorption”; it matters too. Let me try to make this simple for you: If I proposed withdrawing $100 per day from your bank account and transferring to mine, you would probably object. However, using your logic, I can make it more palatable to you by making the following modification: We can set it up so that your bank also withdraws $10000 per day from your account to themselves and then immediately transfers that $10000 back the same day. Then you could not possibly have any significant objection to my withdrawing of a paltry $100 per day from your bank account. After all, it is only 1% of the withdrawals that are occurring from your account and hence it makes hardly any difference at all to your bank balance…It is completely negligible! Heck, if you still object, we can have the bank transfer back and forth $100,000 per day from your account and then the $100 withdrawal to my account will amount to 0.1%…even more negligible!
I stand by my statement: “If you don’t want to be taken seriously by any real scientist, I strongly suggest that you continue to repeat the 3% nonsense.” Please, go ahead, make it the centerpiece of your argument. The more you repeat it, the sillier you look to real scientists.
Joel Shore is twisting himself into a pretzel trying to explain that what he said isn’t really what he said. That’s OK. Cognitive dissonance is a viable excuse.
The central issue, as always, is this: does CO2 cause runaway global warming and climate catastrophe? Well, does it??
Answer: there is zero evidence that CO2 causes any global harm. Joel is flogging a dead horse, like the rest of his cohorts from climatology clown college. Mann, Schmidt, Amman, Trenberth, and the rest of the self-serving climate charlatans have all been repeatedly debunked. They are not credible. That’s why they all hide out from any honest debate. If they really beieved in their conjecture, they would stand up like men and defend it.
Instead, they take pot shots from the sidelines, then run and hide like whipped dogs into the safety of their Ivory Towers. None of them have the balls to face skeptics publicly, mano a mano. They are craven cowards, intent only on keeping their gravy train on the rails. And the truth is not in them.
March 3, 2011 at 7:16 pm Smokey says: “Ri-i-i-i-i-ght. Observational data is wrong and computer models are right. So why hasn’t Joel made a killing in the market with his fantastic computer models?”
~ ~ ~
CC: Smokey, it’s the cherry picking of observational data that is wrong!
You should give the full scope of data a good-faith effort, not just that sliver which suits your particular purposes… or one risks falling victim to Dunning-Kruger. {http://www.psychologytoday.com/blog/evolved-primate/201006/when-ignorance-begets-confidence-the-classic-dunning-kruger-effect}
~ ~ ~ ~ ~ ~ ~
Smokey says: “And regarding my prior post showing that almost 97% of CO2 is natural, Joel wrote:“If you don’t want to be taken seriously by any real scientist, I strongly suggest that you continue to repeat the 3% nonsense.”
Well, it’s nonsense to Joel, anyway. But he suffers from cognitive dissonance. Rational adults can just check the IPCC’s numbers.”
~ ~ ~
CC: NO. Smokey, where the nonsense comes in, is that you, et al., don’t make any attempt to acknowledge that this 97% of CO2 has, over eons, reached a dynamic natural equilibrium breathing in and out of our plant’s biosphere as the seasons progress.
The deal is that over the past decades humanity has managed to supercharge that ±315ppm background CO2 level to ±390ppm. 75ppm above normal natural background absorption processes!
Check out this carbon clock {http://www.dbcca.com/dbcca/EN/;jsessionid=103278DC7A96917252F16ABB70EE31BD} ~
society is injecting ± 1000 pounds of GHGs into our atmosphere every second.
GHGs that have no natural place to go and be of constructive use… except to warm the atmosphere and acidify the oceans, ok and also to help some specially adapted plants to grow better especially Kudzu, Poison Ivy and such vines, but not near enough to offset their other cascading effects.
Now that’s big, how do you deny it?
75ppm above normal natural background absorption processes!
Perhaps I should have said “historical background levels”… excuse me.
citizenchallenge brings up the thoroughly debunked canard that the oceans are “acidifying.” He’s so far behind the curve that it’s embarassing for him.
The central issue is this: does CO2 cause global harm? If so, identify the damage, and show convincingly that it is due specifically to carbon dioxide.
If evidence of measurable, quantifiable damage to the planet cannot be shown, the entire CO2=CAGW canard comes crashing down. Demonizing harmless “carbon” is simply a propaganda tactic designed to raise taxes and exert political control. Useful idiots are most useful to the propagandists when they repeat silly alarmist talking points without understanding the science or the scientific method.
citizenschallenge says:
March 3, 2011 at 11:09 pm
“GHGs that have no natural place to go and be of constructive use… except to warm the atmosphere and acidify the oceans, ok and also to help some specially adapted plants to grow better especially Kudzu, Poison Ivy and such vines, but not near enough to offset their other cascading effects.”
You’re not serious about the “constructive use” part are you? Let’s see if we burn natural gas CH4
CH4 + O2 –> CO2 + 2H2O
Now CO2 can be used by plants to make carbohydrates and H2O(a GHG) can be used by almost anything in the biosphere including the plants in carbohydrates. Did I mention carbohydrates. That’s food for you and me. So there are other “constructive” things CO2 and H2O can do.
yea, like hold in more heat in our atmosphere, which then opens the way for more atmospheric moisture and more heating, which then opens the way for altering hydrological cycles, which also effects things like droughts and mega storm fronts… flooding (yes global warming produces both.), for proxy data why not look at that wonderful thermometer, our planet’s cryosphere ~ http://arctic.atmos.uiuc.edu/cryosphere/
======================
Smokey “citizenchallenge brings up the thoroughly debunked canard that the oceans are “acidifying.” He’s so far behind the curve that it’s embarrassing for him.”
~ ~ ~
If it’s such a thoroughly debunked canard why does Science Daily presenting so many studies showing areas concern? {Or will you remind they are all part of the conspiracy?}
All the papers cited in your WUWT link are behind a paywall – but I will keep trying to find something on them. I am curious to see what they say.
~ ~ ~ ~ ~ ~ ~
New Ocean Acidification Study Shows Added Danger to Already Struggling Coral Reefs
ScienceDaily (Nov. 13, 2010) — Over the next century, recruitment of new corals could drop by 73 percent, as rising carbon dioxide levels turn the oceans more acidic, suggests a new study led by scientists at the University of Miami Rosenstiel School of Marine and Atmospheric Science. The research findings reveal a new danger to the already threatened Caribbean and Florida reef Elkhorn corals.
~ ~ ~
Acidification of Oceans May Contribute to Global Declines of Shellfish
ScienceDaily (Oct. 3, 2010) — The acidification of the Earth’s oceans due to rising levels of carbon dioxide (CO2) may be contributing to a global decline of clams, scallops and other shellfish by interfering with the development of shellfish larvae, according to two Stony Brook University scientists, whose findings are published online and in the current issue of Proceedings of the National Academy of Sciences (PNAS).
~ ~ ~
Rising Carbon Dioxide and ‘Acidified’ Waters Found in Puget Sound, Off Seattle US
ScienceDaily (July 19, 2010) — Scientists at the University of Washington Applied Physics Laboratory and School of Oceanography (UW)have discovered that the water chemistry in the Hood Canal and the Puget Sound main basin is becoming more “acidified,” or corrosive, as the ocean absorbs more carbon dioxide from the atmosphere. These changes could have considerable impacts on the region’s shellfish industry over the next several decades.
~ ~ ~
Leading Scientists Call for More Effort in Tackling Rising Ocean Acidity
ScienceDaily (May 19, 2010) — Ten years ago, ocean acidification was a phenomenon only known to small group of ocean scientists. The ‘Impacts of Ocean Acidification’ science policy briefing presented by the European Science Foundation on 20 May for European Maritime Day 2010 gives a comprehensive view of current research.
~ ~ ~
Carbon Dioxide Emissions Causing Ocean Acidification to Progress at Unprecedented Rate
ScienceDaily (Apr. 23, 2010) — The changing chemistry of the world’s oceans is a growing global problem, says the summary of a congressionally requested study by the National Research Council
~ ~ ~
Ecosystems Under Threat from Ocean Acidification
ScienceDaily (Mar. 31, 2010) — Acidification of the oceans as a result of increasing levels of atmospheric carbon dioxide could have significant effects on marine ecosystems, according to Michael Maguire presenting at the Society for General Microbiology’s spring meeting in Edinburgh.
~ ~ ~
U.S. Pacific Coast Waters Turning More Acidic
ScienceDaily (May 23, 2008) — An international team of scientists surveying the waters of the continental shelf off the West Coast of North America has discovered for the first time high levels of acidified ocean water within 20 miles of the shoreline, raising concern for marine ecosystems from Canada to Mexico.
~ ~ ~
And there is plenty more where this came from. What should a person make of all this data?
Well, Smokey I have read one of the reports, but don’t see anything to justify your statement: “thoroughly debunked canard that the oceans are “acidifying.””
http://www.sciencemag.org/content/322/5907/1466.2.fullComment on “Phytoplankton Calcification in a High-CO2 World”
@ Joel Shore:
You want people to look at this file?
http://www.pnas.org/content/suppl/2008/09/02/0805721105.DCSupplemental/0805721105SI.pdf
Page after page, all those reconstruction graphs, attacked with thick red or black crayon strokes to cover up what’s actually happening as they get closer to the present. The “instrumental record,” either CRU or HAD, and not always clearly labeled as to which. Some instances, they don’t even label the ham-handed concealment, as with Fig. S7b and S10. Yet even then, with the clarity of the electronic record and ability to zoom in clearly, you can still often see the ends of the proxy series peek out from under the thick covering, and notice how far out of line the instrumental records, with the sharp rise at the end, are in comparison to the other data. As is clear in many of the graphs, without said instrumental records they have nothing, we’ve been coming out of a cold period and still aren’t as warm as it’s previously been.
Then there’s Fig. 9, showing those 19 proxy records. Garbled mess that it is, it can still be seen that something’s off with the Tiljander series. Nearly flat for over 1200 years, with something causing them to get rather noisy at the end, except for the most non-flat looking one, xraydenseave, which has a 10^4 scaling factor according to the mushed-in note and otherwise shows nothing remarkable happening. Indeed, overwhelmingly the non-Tiljander series show that nothing remarkable is happening.
It’s been repeatedly shown here on WUWT and elsewhere how the homogenized pasteurized highly-processed “instrumental records” shouldn’t be trusted as they stand. In this document we see consistently how said records were used to cover up what the proxies were trying to say about more recent temperatures, laid right on top of the proxies wide and thick. Just looking at how they did it, one wonders “Are they trying to conceal something?” Then you can look closer at the electronic version, and see what it was.
And this is the “science” you endorse and defend? And you want people to see such obvious glaring attempts at deception?
citizenschallenge,
Pseudo-Science Daily is your Authority?? Well, no wonder you’re so confused.
Here is an article by Willis Eschenbach debunking the ocean acidification BS. It’s got some good graphs that totally deconstruct the claim that the oceans’ pH is rising. Read the comments, too. Get up to speed. Learn some accurate facts for a change.
kadaka:
What I showed that paper for was to demonstrate that Smokey apparently was not telling an accurate story about Mann’s use of the Tiljander data. (To be fair to Smokey, it may be more that others didn’t tell him the accurate story than that he actively tried to deceive us. Still, a real skeptic would not simply take a serious accusation of deception against a respected scientist without trying to verify its veracity.) Mann actually did exactly what any good scientist would do when faced with using some data that there is some dispute about: He showed what the results were like both with and without this data.
Now, you want to raise new issues with the paper, arguing about the use of the modern temperature series along with the proxy reconstruction. However, despite your attempts to impugn the modern instrumental temperature series (which noone has shown to have any significant problems despite the various hype here and other places), the fact is that it is well-verified: If you really think you can’t trust the instrumental record, you could replace with the UAH satellite record analysis by skeptics Roy Spencer and John Christy and you would get basically the same thing. Here is their data http://vortex.nsstc.uah.edu/data/msu/t2lt/uahncdc.lt and note that the trend since 1979 shows that Northern Hemisphere temperatures over land (which is what most of the figures in that paper refer to) in the lower troposphere have gone up by ~0.75 C over that time period!
The main issue with the proxy records is that the data tend not to be quite up-to-date and thus miss some of the recent temperature rise. And, if you want to see detailed comparisons between the proxy records and the instrumental data, Figure S4 (and Fig. 2 of the original paper) blows up the validation intervals so you can see in gory detail how the proxy and instrumental data compare over those times.
I am not trying to claim that these proxy-based reconstructions are the end-all and be-all. I happen to think they constitute one of the weakest arguments for AGW, given all the genuine issues and uncertainties associated with the proxies and also the fact that the whole connection these reconstructions give between the rise in CO2 and temperature is only circumstantial. I much prefer more direct attribution methods, as well as a fundamental understanding of the physics behind the relationship between CO2 and temperature, and past “empirical experiments” such as the ice age – interglacial oscillations.
Sorry Smokey, but we’ll have to write off “citizenschallenge” as another of the deluded. I looked at his blog.
Peter, and I assume that’s his name as it’s the one on the blog posts, posted the following in his first post, Why start this blog?, on August 2, 2008:
Having said that, he then chose (C)AGW, endorsed by the establishment, hyped by special interests and the media, supported by corporate interests wanting to sell their expensive “solutions,” beloved viewpoint of officialdom, whose deceptions and mis-truths are regularly torn apart on WUWT and elsewhere and exposed for they what they are, to champion.
Here we are, the skeptics, the voice in the wilderness, regularly fighting against the money-fueled political propaganda machine that is (C)AGW. There Peter is, having made his declaration, standing there as willing defender of the establishment.
It is sad.
From eadler on March 2, 2011 at 9:16 pm:
These must be two other polls than the one torn apart last year. As posted here on WUWT, copied from the Hockey Schtick:
Of the two questions from the poll that were featured, well, they deserved examination:
#1 is easy, “pre-1800’s” covers the Little Ice Age which ended around 1850, and temperatures have risen since that rather cold period.
For #2, CO2 isn’t mentioned, technically it refers to “changing” temperatures not specifically rising. And the wording is “significant contributing factor.” Your clumsy “murder” analogy doesn’t hold. This is more akin to citing high cholesterol and stress as “significant contributing factors” to a myocardial infarction. Actually, going by the question’s wording, agreeing is just specifying the percentage of “changing mean global temperatures” that can be attributed to human activities is significant, which is a far cry from what you’re trying to say. Only 10% can be considered significant, with 90% of the “changing mean global temperatures” being due to natural reasons.
You better cite those two other studies, that actually are polls of “active climate science researchers” as you have said, that actually show “97% of them believe that the earth is warming and humans are responsible” as you have stated. Because this one certainly did not.
Sorry, kadaka, but your historical revisionism won’t fly. Through the 1990s, corporate interests fought tooth-and-nail against the consensus on climate change. (See http://en.wikipedia.org/wiki/Global_Climate_Coalition ). It is true that many of those corporate interests (although certainly not all of them) have abandoned this stance…but this is only because they were smart enough to realize that the scientific case had become so strong that it was no longer in their best financial interests to deny it but instead to come to terms with the fact that because of this scientific knowledge we were inevitably moving toward a future of a carbon-constrained world.
Yes, today the skeptics are a voice in the wilderness (although not, alas, on Capitol Hill at the moment) but that really just reflects the fact that the scientific evidence continues to go against them and whatever science they do try to produce, even by the few with serious scientific publication records, continues to be found seriously wanting. (See, e.g., http://arthur.shumwaysmith.com/life/content/mathematical_analysis_of_roy_spencers_climate_model )
kadaka (KD Knoebel) says:March 4, 2011 at 8:44 pm”Sorry Smokey, but we’ll have to write off “citizenschallenge” as another of the deluded. I looked at his blog.”
~ ~ ~
So does this mean I get banned?
By the way, why you got a problem with those words I wrote?
Smokey says:March 4, 2011 at 7:13 pm
citizenschallenge,
Pseudo-Science Daily is your Authority?? Well, no wonder you’re so confused.
~ ~ ~
Now wait a minute,
what has Science Daily done to get on the s– list?
Care to offer any details?
I’ve often wondered what color the sky is on Joel Shore’s planet. I know he’s not an Earthling when he says stuff like, “…the scientific case had become so strong that it was no longer in their best financial interests to deny it but instead to come to terms with the fact that because of this scientific knowledge we were inevitably moving toward a future of a carbon-constrained world.”
“Carbon constrained”?? Joel is probably different, but we earthlings are made of carbon. And of course we are certainly not moving toward a CO2 constrained world [which is probably what Joel meant to say]. China alone is more than making up for any reduction here.
Finally, the “scientific case” that CO2 will lead to CAGW has been thoroughly debunked. Maybe not on Vogon IV, or wherever Joel is beaming in from. But on Earth the disconnect between harmless, beneficial CO2 is obvious.
One last thought
Isn’t science about discussing and examining all legitimate inquire?
if that’s the case,
Why does so much of these WUWT discussion threads revolve around so much ‘shouting down’ anything that “disagrees” with you?
You guys like insulting SkepticalScience, but read those open threads and discussions, at least they are about discussing opposing views, in a civil constructive manner, rather than shouting them down with rabid insults. (OK there is occasional ribbing but the damnation I keep hearing in other place)
cheers,
Peter
Peter, if I want to test my theories or challenge the warming theories, I go to skeptical science. While there I can pick up links to papers to read and understand so I can make better challenges. There is useful information here too, but politics is allowed and gets well past the annoying point to those who disagree with it. But generally the science is not being “shouted”.
Reading above, D’Aleo regretted his use “shout”. You and Joel are welcome of course to maintain whatever caricature of this site that you want so you can stay in your comfort zone. And Joel, you are welcome to maintain your belief that it was corporate interests that got people like myself interested in this in the 1990’s or Steve McIntyre in the early 2000’s. But it is not true, it is just your wishful thinking.
citizenschallenge says:
“So does this mean I get banned?”
WUWT doesn’t ban commentators for being scientifically illiterate, so you’re safe. [BTW, your Phytoplankton Calcification link has been completely debunked by the WUWT Dave Middleton article, with charts showing just the opposite of what is claimed in the article you posted.]
And if Skeptical Pseudo-Science is such a great blog, why don’t you just spend your time there, instead of trying to convince people here that a 97% push-poll is anything other than fabricated propaganda?
WUWT is a true scientific skeptics’ site. In fact, a skeptical position is required by the scientific method. Purveyors of a new hypothesis have the obligation to try and tear down their own hypothesis. Where have you ever seen that done by climate alarmists? Against all the evidence, they still try to push their agenda. That is not science, that is advocacy; anti-science. Pseudo-science. Science fiction.
John Cook flogs the alarmist agenda at his mendaciously named blog. There is nothing ‘skeptical’ about it. Cook is a climate alarmist advocate. He pushes it every day, despite the lack of any verifiable evidence that CO2 is harmful. But then Cook is a cartoonist, which is basically a propagandist profession, no?
Finally, you never answered my question about any evidence of global harm from CO2. You stated:
“Tragically It is impossible to show you and your friends that information ~ since you refuse to look at it in good-faith!
The evidence is there!”
I promise I’ll look at whatever evidence you can provide. Just make sure it’s evidence, and not computer model output. Only verifiable evidence showing convincingly that CO2 causes global harm, what the harm is, and the damage quantified in a testable manner. After all, that is the whole basis for the “carbon” scare. Prove to us that it’s not a baseless scare.
Eric (skeptic) says:
I have never made claims about how particular people have gotten interested in the subject. All that I said was that it was a complete misreading of history to think that corporate interests were generally supportive of the science of AGW.
I think that in most cases, most of the people here have a very strong “free market” ideology (i.e., on the conservative or libertarian end of the spectrum) and it is the policy solutions implied by the science that strongly disincline them to believe the science. There are, of course, a few exceptions (e.g., Alexander Cockburn, a columnist for the left-wing Nation magazine is an “AGW skeptic”) but I don’t think there are very many. (And in Cockburn’s case, he is far enough to the Left that the conspiracy theories involving intellectual authorities become in many ways indistinguishable from those on the right end of the spectrum.)
From citizenschallenge on March 5, 2011 at 7:34 am:
This site ain’t (Un)RealClimate. Banning is an exceptionally rare event, and not done for merely having an opposing view. For a one-word reason for the bannings I have seen, and they were few, I’d say impoliteness.
Nah, they’re good words. I’m just wondering why you don’t follow what you yourself wrote. To wit:
I can see what’s happening when I turn on the network news. If there is a mudslide or hurricane or flooding or drought somewhere in the world, it gets tied to global warming, and we get warned such are going to happen more frequently and severely. Despite the pro-(C)AGW crowd saying global warming is climate which deals with several decades and certainly not with individual events which are weather, the media does it anyway, with statements from pro-(C)AGW people saying it’s global warming. It’s sensationalism. And when was the last time you saw the media support a “substantive learning process” that involved an equivalent presentation of both sides? As far as the media is concerned when it comes to (C)AGW, the Socratic Method does not exist. “The science has spoken, the science is settled, only bible-thumping unscientific hicks don’t believe it.” That is the media presentation. And you don’t question that?
You can see the governments of the “developed world” gleefully anticipating the new revenue streams from taxing “carbon emissions.” You can see the governments of the “developing world” gleefully anticipating payments in recompensation for the “past, present, and future damages from global warming,” for mitigation and adaptation schemes, even for the assorted “carbon sequestration” schemes. Corporate interests like GE and various automakers are pushing assorted “solutions” to “combat global warming” that couldn’t stand on their own without government subsidies and mandates, from wind turbines to electric cars. But with that government intervention, which includes research money (paying them to develop what they’ll profit from), riding the global warming hype, they’re making good money.
Electric cars, likely charged from a coal-fired electric plant. Did you see the ads for those new GE “hybrid” water heaters? They’re heat pump systems. They can’t be tucked away in a closet, they need lots of open air to draw in heat. Sounds great in the summer, but what of the winter? Where is that “free heat” that’s “saving you money” coming from? You heat the air, the air is used to heat the water, with the added inefficiency of the heat pump system. This is better than using a plain electric water heater with a 100% electricity-to-heat efficiency, or a thrifty gas-fueled unit? And sure it costs more up front, but you get to feel good about “saving the planet” so it’s all worth it.
The greatest crisis facing humanity is poverty, caused and/or exacerbated by the lack of available affordable energy. Yet government and corporate leaders are not addressing this by developing and providing cheap energy. Instead I see them lining up for the never-ending money stream coming from the hyping of (C)AGW. Greed comes first.
That “steady flow” arising from the “fight against global warming” is regularly documented on WUWT and elsewhere.
You sell yourself as anti-establishment, then claim the most pro-establishment side of the issue. You don’t question the one-sidedness of the standard presentation. Here in the comments on WUWT, I can read the horror stories of forced indoctrination into professing (C)AGW. Parents talk of their kids in public schools, who aren’t allowed to question (C)AGW and must affirm whatever claims are presented or risk bad grades, who must participate in assorted “feel-good” “save the planet” projects. College students say likewise, questioning the (C)AGW orthodoxy is not allowed. Aren’t you wondering why debate has been so thoroughly squelched?
And of course, there are the Climategate revelations. Don’t you dare wave them off as “stolen emails” or whatever. Their authenticity is not doubted. An anti-establishment person as you claim to be would surely acknowledge the importance of such releases in breaking down bogus establishment claims, from wherever they come. In them we note the “Climate Team” finds their theories don’t match reality. Post-Climategate, one of the leading members of the team, Dr. Phil Jones of UEA-CRU, agreed in February 2010 in a BBC Q&A that there has been no statistically-significant warming from 1995 to the present.
Where and when in all the media hype about the global warming crisis and the urgently-needed action to combat it, with governments and politicians pushing their urgently-needed additional powers of regulation and additional taxation to fight the crisis, with corporate interests lining up to sell their urgently-needed “solutions” to the crisis and eager for the good PR of being seen as “part of the solution, not part of the problem,” with special-interest “nonprofits” ceaselessly demanding the urgently-needed governmental fixes to the crisis along with ever-more donations so they can champion the push to fight the crisis, did any of these parties with a vested interest in promoting (C)AGW get around to noting for the public that there had been a 15 year stretch without any statistically-significant global warming?
You wrote good words. You have not lived up to those words.
That is still sad.
kadaka says:
Here is the full quote from the article that you linked to:
In fact, the best-fit trend over the 15 year period is not much lower than the trend has been over the period from 1975 to 2009 (0.16 C per decade). It is just that the errorbars over a 15 year period are still large enough that one cannot reject a trend of 0 with 95% confidence. Likewise, one probably could not reject a slope of ~0.24 C per decade with 95% confidence either (assuming an approximately symmetric probability distribution). This is just a statement about measuring trends over what are still relatively short time periods. The fact that it is turned into such a big deal by “skeptics” shows only how unskeptical they are to believe what they want to believe.
This is also an illustration of why in a debate between honest scientists and less-than-honest propagandists, the propagandists can often pull public opinion to their side. Real science is messy and there are all sorts of issues to worry about, like statistical significance of trends over time periods that are just not sufficient to determine the trends to high accuracy. Propagandists take advantage of this.
It also explains why there can be such a gulf between what the scientific community thinks the science shows and what those who are inclined to believe otherwise think.
Smokey says: . . . Only verifiable evidence showing convincingly that CO2 causes global harm, what the harm is, and the damage quantified in a testable manner.
After all, that is the whole basis for the “carbon” scare. Prove to us that it’s not a baseless scare.
~ ~ ~ ~ ~ ~ ~
You know, I keep hearing variations on that mantra: there is no proof whatsoever that CO2 is happening,… CO2 is causing,… CO2 will harm, etc. etc.
To be honest I’m not sure what you are claiming or demanding.
So I wonder if we could start by focusing on definitions… are you claiming some of the following is nonsense?
~ ~ ~
#1) Carbon dioxide (CO2) consists of a single carbon atom and two hydrogen atoms bonded to it, one on each side. Because greenhouse gasses are comprised of 3 or more atoms, they are loosely bonded and have a certain freedom of movement and thus are affected by longwave radiation in the form of vibrations.
#2) The carbon dioxide molecule can absorb infrared radiation and the molecule will vibrate. As molecules return to a ground state the molecule will release radiation which will likely be picked up by another molecule.
#3) This keeps the outgoing longwave radiation (OLR) close to the earth instead of being radiated out into space.
#4) The increasing atmospheric CO2 (and other greenhouse gases) has increased the amount of infrared radiation absorbed and re-emitted by these molecules in the atmosphere. Warming our globe and evidenced by countless proxies, most dramatically Earth’s shrinking cryosphere.
kadaka (KD Knoebel) that was silly and mostly your politics and imagination running away with you.
I would just a soon try to focus on the science.
Smokey says: March 5, 2011 at 7:43 am “Finally, the “scientific case” that CO2 will lead to CAGW has been thoroughly debunked. Maybe not on Vogon IV, or wherever Joel is beaming in from. But on Earth the disconnect between harmless, beneficial CO2 is obvious.”
~ ~ ~
What in the world was that linked graph supposed to make clear?
Are you thinking that climatologists believe CO2 is the only influence?
Besides! . . . since when do US temp figures represent global temps {which incidentally include oceans and not just the top two, three hundred meters either.}
~ ~ ~
Referring back to my previous post, there’s a cool simple little site put together by the University Corporation for Atmospheric Research {or are they bad guys too?}
“The Greenhouse Effect” I’m curious do you dispute any of the assertions made on that website? If you could be specific that would great, thanks.
http://www.ucar.edu/learn/1_3_1.htm
~ ~ ~
PS. no one ever explained what was wrong with ScienceDaily?
CC, nice Freudian slip there (describing CH2 because you were thinking about the real GHG: H2O)
Joel claims “Real science is messy and there are all sorts of issues to worry about, like statistical significance of trends over time periods that are just not sufficient to determine the trends to high accuracy. Propagandists take advantage of this.”
Joel, propaganda is dispensed by both sides, weather is messy and the propagandists use that fact to claim, for example, that AGW means
lessmore snow.The sooner you come to grips with the fact that Mann98/99 is propaganda, the sooner we will take you seriously when you talk about his later work. Read Montford’s book, show what the mistakes are in the book, what conclusions are not mistaken, what science should do about it.
Eric: Others have already pointed out severe problems with Montford’s book. I don’t really see the purpose of wading even deeper into that abyss. Besides which, it is not clear what good it would do. I have already pointed out two serious errors in claims that Smokey was making about Mann; Nobody has really disputed what I have said about the facts…and yet it doesn’t stop the basic mantra, which seems to be pretty much independent of the facts.
By the way, I happen to agree with you to a certain extent on the more snow / less snow thing. It seems to me that the science involving regional trends in a warming world is sufficiently uncertain (at least in many aspects) that I don’t think one can say that more or less snow in one particular area is or is not a consequence of AGW with very high certainty, so citing it as evidence one way or the other seems premature at this point.
Eric (skeptic) says: March 5, 2011 at 6:33 pm “CC, nice Freudian slip there (describing CH2 because you were thinking about the real GHG: H2O)”
When was I talking about CH2?
(ps. can you describe the different atmospheric properties of CO2 compared to H2O?)
~ ~ ~ ~ ~ ~ ~
As for east coast snow storms considering that
Weather is nestled within the Climate
and
it has been documented that the jet stream has shifted northward…
more moisture off the Atlantic Ocean…
while the East Coast was freezing their butts off… the Arctic was experiencing a heat waves –
They were shedding all that cold air and sending it down there to mingle with our warm temperatures.
But remember we are talking about Global warming ~ East Coast snow storms don’t mean squat compared to the glaciers that continue to melt with increasing tempo.
~ ~ ~
Jan. 21, 2011 “This past melt season was exceptional, with melting in some areas stretching up to 50 days longer than average,” said Dr. Marco Tedesco, director of the Cryospheric Processes Laboratory at The City College of New York (CCNY — CUNY), who is leading a project studying variables that affect ice sheet melting. ~ ~ ~
As for the South Pole take a peek – http://ossfoundation.us/projects/environment/global-warming/antarctic-ice-melt
~ ~ ~ ~ ~ ~ ~
As for Pacific ocean regional cold spell, we got the La Nina helping that one along.
Stay tuned bet you a beer it’s going to get hotter, even along the East Coast.
Speaking of the Jet Stream check out this site I just came across, I’ll bet even you’ll like it.
California Regional Weather Server
ANIMATION: Archived Jet Stream Analyses
http://squall.sfsu.edu/scripts/nhemjet_archloop.html
Interactive, you can punch in your time selection and watch what the jet streams doing.
It’s even more broken up and dynamic than I thought. Lot of mixing going on.
CC: reread your March 5, 2011 at 3:03 pm Yes, what I learned from Jack Barrett. All air molecules have 3 translational modes that are the primary means storing energy since collisions dominate over intercepting LW by many orders of magnitude. Diatomic molecules like O2 add two rotations and one vibration (too weak to store much energy) for a theoretical 29.1 J per K per mole (the measured value is slightly higher). CO2 likewise has two rotations and 4 vibrations (relatively weak again) for 29.1 J per K per mole. H2O is the big daddy with three rotations and three weaker vibrations for 33.2 J per K per mole. That means H2O stores more heat than CO2. Then the question is how much outgoing LW is intercepted by the vibrational modes and it turns out that one angular vibration mode is enough for intercepting a wide range of photon wavelengths so CO2 and H2O are pretty much equal in that regard. Joel can correct any mistakes I have made that paragraph.
Joel, thanks for the confirmation on less/more snow. It’s not in the models (they show positive AO = less snow). It doesn’t show up in long term trends. Yet, when I talk to people who know absolutely nothing about climate or global warming, other than what they hear on TV, they will say things like “all this snow isn’t normal, we must be doing something to the climate” I conclude that is successful propaganda. It doesn’t bother me (as much as it should), but resolves me to keep up the battle for science.
Joel Shore is concerned about propaganda and significance over the quotes from Phil Jones – up until that admission, the BBC had been totally propaganderised to believe that global warming had accelerated. Then behind the scenes, their key people read my book ‘Chill: a reassessment of global warming theory’ – which you might do also if you truly believe in applying the rigours of science – i would be glad to have your criticisms too. I also briefed their chief interviewer over the phone before the interview.
So then you get less propaganda and more science – such as how much statistically significant warming has their been – and Jones proffered the none since 1995 date. I would have said 1998, but have less acess to the statistics than he.
As for trends – the real science shows that there was an even steeper warming trend from 1920-1940, especially in the northern hemisphere but also global. And another trend from 1945-1975 that was also global and cooling (and not, as the modellers thought for 30 years, due to human emissions of sulphur – but they have not publicised that new science). Thirty year trends can be very misleading.
There is nothing new in the late 20th century warming signal – not the rate nor the amplitude and indeed the centennial trend is a continuation of a longer term recovery from the trough of 200 years ago – and it would be equally foolish to expect this trend to continue, since there is a larger cycle at play.
This IS the science, Joel, that the propaganda machine of AGW does not want to admit to. And by the way – there is a quiet revolution going on in the calculations of CO2’s warming potential. Hitherto, the radiative forcing factor (RF) was calculated according to offline data codes largely within the private sector and spawned by NASA – it is a complex business and the paper trail of references eventually leads to some very grey literature. This is about to change. The writing on the wall says that the RFs have been way over-estimated. That means CO2 does not have the power the earlier modellers assumed – by the time it reaches 200 ppmv, its greenhouse work is all but done. That is why you find no evidence for either initiation or amplification of temperarure changes in the ice-cores. The effect of CO2 is not only too late (time lagged) but not enough to register statistically in the correlations. This was a mystery until now – and the simple answer is, CO2 has very little extra power to heat the atmosphere or surface at the levels that are relevant (from 200ppmv upwards).
Good science and statistical analysis will eventually show this and all of these models will be history. Climate change, however, will still be a major issue – which is why people like the sceptical Global Warming Foundation and others, do not embrace my work – because there are natural cycles and they could be heading downward – putting billions of lives at risk from extreme weather and food shortages. Mitigation remedies were always hopelessly misdirected – but adaptation strategies will require a lot of sound thinking and cooperation, maybe even some better modelling.
A couple of comments:
First, I am increasingly impressed with Peter Taylor’s posts. He gets it.
Next, Joel Shore, without actually saying it, admits that he hasn’t read A.W. Montford’s book – but then he goes on to criticize what it says. His mind is closed.
Finally, citizenschallenge says, “Because greenhouse gasses are comprised of 3 or more atoms, they are loosely bonded and have a certain freedom of movement and thus are affected by longwave radiation in the form of vibrations.”
AAARGH! Longwave radiation is not ‘vibrations,’ which are kinetic energy. And regarding the Arctic [OK, the ‘cryosphere’], that is a region. It is a natural regional effect. I asked for evidence of global damage due specifically to CO2. Still waiting.
Smokey, it’s true Joel hasn’t read the book, just Tamino’s and other reviews of it. Since that is the case, Joel should at least read McIntyre’s rebuttal of one of Tamino’s main critiques here: http://climateaudit.org/2010/07/27/taminos-trick-mann-bites-bulldog/ Obviously he should read the comments too, there is no defense of Mann’s poor methodology or Tamino’s prevarication, rather just appeals to scientific ideals that were discarded more than a decade ago by Mann and his defenders.
Smokey — seconded. Very informative and sane posts, indeed.
Thanks, Peter. Copied, linked, saved.
Peter Taylor:
A true skeptic (which apparently Smokey and Brian H are not) might ask for a little more evidence for these statements:
and
In fact, I have very little idea of how the 2nd statement could possibly be true. The approximately-logarithmic-dependence of radiative forcing on CO2 concentration follows from fairly general considerations (once you are in the concentration regime where the center of the dominant absorption line is basically saturated; the dependence on concentration is stronger before that). So, you don’t need to do detailed calculations to pull out that basic dependence. And, with a log dependence, its work is never done…The amount of RF going from 200 to 400 ppm is the same as that going from 100 to 200 ppm.
Furthermore, even Richard Lindzen and Roy Spencer accept the radiative forcing value for CO2, and considering some of the arguments those two have been willing to embrace when they support the conclusion that AGW is not important, it is saying something when you can find statements in the accepted science of AGW that even they don’t dispute!
I am a scientific skeptic, despite Joel Shore’s apparent telepathic ability to mind-read and see who is, and who isn’t a skeptic. If and when there is convincing evidence of runaway global warming [now mendaciously referred to as “climate change” – Orwell would be jealous], I will change my mind.
But so far there is zero credible evidence of runaway global warming. In fact, there is no evidence of AGW. It’s computer models all the way.
The planet has been warming, in fits and starts, since the LIA. Coincidentally, CO2 has risen at the same time. Occam’s Razor says eliminate the extraneous variables. So eliminate CO2 as a “cause,” and we’re left with the simplest, most elegant explanation: the world is warming from a cold episode.
Joel wouldn’t know the scientific method if it bit him on the a …nkle. None of the alarmist clique abides by the scientific method, for one simple reason: If they did, their CAGW scam would be publicly debunked in their peer review journals. So they ignore the scientific method. Simples.
But it’s not science.
Joel says: quoting me-
‘and not, as the modellers thought for 30 years, due to human emissions of sulphur – but they have not publicised that new science’
I can give you three good references from Science in 2005 that scuppered the IPCC modellers consensus that ‘global dimming’ was due to anthropogenic sulphur aerosols – they are all in my book, with a chapter on how important this issue remains:
Pinker R.T., B. Zhang and E.G. Dutton (2005) Do satellites detect trends in surface solar radiation? Science 308 p850-854
Wielicki B.A. et al., (2005) Changes in earth’s albedo measured by satellite Science 308 , 825
Wild M. et al., (2005) From dimming to brightening: decadal changes in solar radiation at the Earth’s surface Science 308, 847-850
If you read these works you will readily see that ‘global dimming’ was a localised mostly land-based phenomenon (perhaps 10% of the globe) – whereas the drop in global temperatures from 1945-1975 was evident across all oceans and both hemispheres including large unpolluted areas, and was a combination of cloud and aerosol forcings which shifted to ‘brightening’ around 1980 – well before the suplhur reduction protocols had made much effect in those limited zones.
This is entirely in line with ou understanding of ocean cycles such as the PDO.
I wish I could give you a reference from IPCC 9 chapters of Working Groups – but in the course of my research for the book, I came across a single sentence that admitted the previous understanding of the global trough from about 1945-1980 was wrongly ascribed to human agency. It was pretty-well buried. I have searched for it a few times in Chapter 2 on radiative forcing and Chapter 9 on attribution studies but never found it – those chapters do refere to Wild’s work, but obfuscate the implications. I don’t think anyone sufficiently informed would now claim the trough was due to anthropogenic sulphur, any more than the modellers would draw attention to the fact that they hindcast this trough as anthropogenic and validation that their models were reliable! It is a big issue.
I asked Gerry Meehle at NCAR this question – he was still, in Februrary 2010, under the impression the trough was accurately modelled (I guess different groups don’t have much time to talk to each other) and had ‘no idea what I was talking about’.
You can see, just as you would have had no idea – and I don’t expect you to until you read those three papers, that the models have made a huge error – so do many scientists in the field, because they don’t actually spend much time checking each others work, nor looking across disciplinary boundaries.
You then quote me on RFs:
‘ The writing on the wall says that the RFs have been way over-estimated. That means CO2 does not have the power the earlier modellers assumed – by the time it reaches 200 ppmv, its greenhouse work is all but done. ‘
The latter point is easily verified by visiting any site with MODTRANS output – the RF for carbon dioxide rushes up to 255 watts/square metre (at the tropopause) by the time concentrations reach 200ppmv (about where they are during the ice-ages). The next 100ppmv raises that by 2.5 watts. And the pre-industrial level of 280 to today at 385 raises it another watt. Doubling from pre-industrial to 560 ppmv gives a total of about 3.5 watts/square metre – or about 3% of the global average downward flux at the tropopause (the system is modelled by using conceptual equilibrium – which the system is never in – but that’s another issue!). A good scientific question is ‘what is the natural variability’….and what kind of statistical tests would identify such a signal….but again, another issue!
So – that is the RF calculation. How reliable is it? After all, it takes a massive computation to deal with all atmospheric layers up to the tropopause at 10km, all the different gases and their properties to absorb and reflect or re-emit radiation, and their interactions with each other – including water vapour and clouds and natural aerosols. Well, I tried hard to find good references to this original piece of science and the paper trail led to an USAF unit that sells the MODTRANS programme for $300 – and it seemed a lot of labs relied upon this. However, I have recently asked Keith Shine at Reading for guidance and he has just sent me a long list of references assuring me that this part of the calculation is both well understood and more readily available in the science literature – but I have yet to find time to read all that stuff.
Until a few days ago, i was quite ready to accept that RF was basic physics and not controversial, because there is enough uncertainty in how it is used to translate the watts/square metre at 10km downward flux into Temperature at the surface. Shine himself has a useful paper on this:
GEOPHYSICAL RESEARCH LETTERS, VOL. 30, NO. 20, 2047, doi:10.1029/2003GL018141, 2003
An alternative to radiative forcing for estimating the relative
importance of climate change mechanisms
Keith P. Shine, Jolene Cook, Eleanor J. Highwood, and Manoj M. Joshi
Department of Meteorology, The University of Reading, Reading, UK
In this paper he shows that the factor lambda in the equation
T = lambda. RF
can vary between 0.4 and 0.8 – the latter being the IPCC’s preferred value.
I think you can empirically find 0.4 from the global data rather than models – but again – long story!
So – if you apply 0.8 to 3.5………as at the IPCC, you get 2.8 C, and if you apply 0.4 you get 1.4 C and not such a scary climate story.
BUT I am no longer assured about the reliability of RF calculations. And I have WUWT to thank (at least I think it was, I don’t visit many blogs) for the extra head-banging, in drawing attention to the work of Hermann Harde
Helmut-Schmidt-Universität Hamburg, Germany (harde@hsu-hh.de)
and I give you this abstract in full, because if he is right (I have yet to get the paper and stretch my simple ecologist’s brain), then it is probably the most important climate science paper in recent years:
‘Based on the actual HITRAN’2008 database [1] detailed spectroscopic studies on the absorbance of the greenhouse gases water, carbon dioxide and methane in the atmosphere are presented. The objective of these investigations was to examine and to quantify with these newly available data the influence of these gases on our climate.
The line-by-line calculations for sun light from 0.1 – 8 m (short wavelength radiation) as well as those for the emitted earth radiation from 3 – 60 m (long wavelength radiation) show, that due to the strong overlap of the CO2 and CH4 spectra with the water vapour lines the influence of these gases is significantly reducing with increasing water vapour pressure, and that with increasing CO2-concentration well noticeable saturation effects are observed limiting substantially the impact of CO2 on the warm-up of the atmosphere.
For the water vapour, which in its concentration is considerably varying with the altitude above ground as well as with the climate zone, separate distributions for the tropes, the moderate zones and the polar regions are presented.
They are based on actual GPS-measurements of the water content in these zones [2] and are applied for calculating the absorbance in the respective regions. The vertical variation in humidity and temperature, in the partial gas pressures and the total pressure is considered for each zone separately by computing individual absorption spectra for up to 228 atmospheric layers from ground level up to 86 km height.
The propagation length of the sun light in these layers, which depends on the angle of incidence to the atmosphere and therefore on the geographic latitude, is included by considering the earth as a truncated icosahedron (bucky ball) consisting of 32 surfaces with well defined angles to the incoming radiation and assigning each of the areas to one of the three climate zones.
To identify the influence of the absorbing gases on the climate and particularly the effect of an increasing CO2- concentration on the warming of the earth, a two-layer climate model was developed, which describes the atmosphere and the ground as two layers acting simultaneously as absorbers and Planck radiators. Also heat transfer by convection between these layers and horizontally by winds or oceanic currents between the climate zones is considered.
At equilibrium each, the atmosphere as well as the ground, delivers as much power as it sucks up from the sun and the neighbouring layer or climate zone.With this model for each climate zone the temperature progression of the earth and the atmosphere is calculated as a function of the CO2-concentration and several other parameters like ozone and cloud absorption, short- and long-wavelength scattering at clouds as well as the reflection at the earth’s surface.
The simulations for the terrestrial and atmospheric warm-up show well attenuating and saturating progressions with increasing CO2-concentration, mainly caused by the strongly saturating absorption of the intensive CO2 bands and the interference with water lines. The climate sensitivity CS as a measure for the temperature increase found, when the actual CO2-concentration is doubled, assumesCS = 0.41°C for the tropical zone, CS = 0.40°C for the moderate zones and CS = 0.92°C for the polar zones. The weighted average over all regions as the global climate sensitivity is found to be CS = 0.45°C with an estimated uncertainty of 30%, which mostly results from the lack of more precise data for the convection between the ground and atmosphere as well as the atmospheric backscattering.
The values for the global climate sensitivity published by the IPCC [3] cover a range from 2.1°C – 4.4°C with an average value of 3.2°C, which is seven times larger than that predicted here.
1. L.S. Rothman et al., The HITRAN 2008 molecular spectroscopic database, J. Quant. Spectrosc. Radiat. Transfer 110, 533–572 (2009)
2. S. Vey: Bestimmung und Analyse des atmosphärischen Wasserdampfgehaltes aus globalen GPSBeobachtungen einer Dekade mit besonderem Blick auf die Antarktis, Technische Universität Dresden, Diss., 2007
3. D.A. Randall et al., Climate Models and Their Evaluation. In: Climate Change 2007: The Physical Science Basis. Contribution of Working Group I to the Fourth Assessment Report of the Intergovernmental Panel on Climate Change [S. Solomon et al. (eds.)]. Cambridge University Press, Cambridge, United Kingdom and New York, NY, USA.
You will note that he gives the value in T degrees C…for the doubling, as 0.45. This is actually quite close to Lindzen’s figures, I believe, though he would come via a different route.
The fact that neither Lindzen nor Spencer have questioned either MODTRANS or HIGHTRANS does not mean a lot – I imagine it is a big task to check it all line-for-line and when there is so much more uncertainty in the translation of Lambda, why bother?
When I do read the paper, it may well be that the main issue IS the translation to T at the surface and not the RF at the tropopause – but they are part and parcel of the RF approach and it is shot through with uncertainty. This is supposedly the ‘settled’ and very basic science of AGW. There is actually very little wrong with the science itself – you will find plenty of acknowledgment of uncertainties like these, as well as publications which downplay them – such as the Summary Reports of the IPCC Working Group.
PS:
forgot to include the reference to Harde:
Geophysical Research Abstracts
Vol. 13, EGU2011-4505-1, 2011
EGU General Assembly 2011
© Author(s) 2011
How much CO2 really contributes to global warming? Spectroscopic
studies and modelling of the influence of H2O, CO2 and CH4 on our
climate
Smokey says:
It is not a matter of mind reading; it is just a matter of reading what you write.
Your statements are completely meaningless. A young earth creationist can say, “If and when there is convincing evidence that the Earth is more than 6000 years old, I will change my mind.” And, like you, he would then proceed to pronounce himself unconvinced by the evidence, set himself up as judge-and jury, and completely ignore the fact that just about every major scientific body on the planet disagrees with him.
I will state the truth clearly: You will never be convinced of AGW, no-how, no-way, and anybody who believes otherwise is naive in the extreme. Because you are not operating on the basis of letting the evidence lead you. You are operating on the basis of desperately cobbling together whatever evidence (however poor) you can find to convince yourself of what you are ideologically set on believing.
Your statement is vacuous and utterly devoid of meaning and is really just a way to pretend to be open-minded when you are anything but.
Well, I suppose it is the egalitarian nature of the internet that allows someone who has no scientific credentials that one can ascertain whatsoever to pronounce himself the arbiter of the scientific method, and who and who does not understand it, proclaiming how some of the world’s top scientists (as well as some middling scientists like myself) do not understand it as well as he does. I must say, your modesty becomes you!
Thank you Joel for taking the time to post that and previous posts.
It would be nice if your words were given some good faith serious consideration.
commieBob March 7, 2011 at 6:42 am says: “The warmistas claims are based on proving: “1 – Modern warming is unprecedented
2 – We are approaching a tipping point caused by positive feedback
3 – The climate is non-linear and crossing the tipping point will cause a sudden and irreversible warming by about six degrees.”
~ ~ ~ ~ ~ ~ ~
First off, can you define “Warmistas” I don’t understand what you mean?
~ ~ ~ ~ ~ ~ ~
Seems to me you got some straw men there. Shouldn’t the first order of business be getting a clearer picture of what is going on within our atmosphere… and how that relates to weather patterns, etc. which over the long term is categorized as climate?
Your above three points mischaracterize the basic understanding we must achieve.
I would suggest the following list of questions are more appropriate:
1 – Does CO2 (along with other GHGs) influence our atmosphere? 1a – Is there physical evidence to suggest CO2 has thermo properties… have those properties been quantified?
1b – Is there evidence that atmospheric CO2 (& GHG) levels are increasing due to human activity?
1c – Is there evidence to suggest real-time effects of CO2’s atmospheric thermo properties is being witnessed on the planet?
2 – Beyond that: Are our oceans drivers of warming/cooling or do they merely circulate warmth according to the atmosphere’s thermo condition and their interface?
3 – Is the sun, {or Earth’s orbital variations}, acting in a manner that is meaningfully increasing or decreasing current insolation (incoming sun’s energy)?
4 – Which temperature reconstructions can we trust?
5 – Where is the IPCC claiming tipping points, or imminent catastrophe?
Joes Shore says:
“It is not a matter of mind reading; it is just a matter of reading what you write.”
Because your mind is closed, you do not comprehend what I write. I don’t need to ‘cobble together’ any evidence, for I am a scientific skeptic. Climate alarmists like Joel who push the debunked CO2=CAGW conjecture are the ones with the onus of producing evidence: Their failure rate so far = 100%. There is no evidence of planetary damage due to CO2. None. The conjecture is being falsified by the ultimate authority: planet Earth.
“I will state the truth clearly…”
Joel has a corner on the truth! In fact, it’s still just a lot of chin music, with zero evidence of any global harm from CO2 being presented. Oh, and hey, I like Joel’s new sycophant. An entourage of one!☺
Peter Taylor –
Thanks for the references and commentary. I have to admit that I remain pretty skeptical though. For one thing, I don’t really see where those Science papers that you referenced lead to the conclusions that you seem to have drawn from them. The conclusions certainly don’t seem to be in the papers themselves, nor are they, as you note in the IPCC review of those papers or in the minds of people knowledgeable in the field like Meehl. You think it has to do with people not looking across disciplinary boundaries and such, but there are also more parsimonious explanations, such as the conclusions that you have reached not being warranted.
As for the RF issue, it sounds like you are putting all your eggs into the basket of that Hermann Harde paper. An argument that relies on one very new paper that we have only seen the abstract to and which claims the previous work is all wrong should be treated with a great degree of caution and skepticism even if it appeared in an outstanding peer-reviewed journal by a respected author in the field. In this case, you have a submitted paper to a conference that I do not believe is peer-reviewed at all by somebody who is apparently pretty much unknown in the field making these strong claims. That is a pretty dangerous basket to put your eggs in!
Time will tell…but I will be willing to make a friendly bet that in a few years time, Harde’s paper won’t be held in much higher esteem than that of Gerlich and Tscheuschner.
P.S. – This is somewhat beside the point. But, I am confused by your statement:
That 255 W/m^2 number sounds awful high to me given that the total absorbed solar radiation is only 240 W/m^2…and the total amount of back-radiation (from the higher amount emitted by the earth’s surface) is still only ~333 W/m^2, of which the majority would presumably be due to water vapor and clouds. What am I missing here?
Joel Shore, thanks for your comments – I appreciate you following up the papers in Science.
Ny reading of them and what the authors say very clearly is that ‘global dimming’ ended around 1980 and the brightening was not confined to the polluted northern hemisphere – moreover the atmosphere cleared well before the sulphur pollution controls rook effect (I was heavily involved in the acid rain campaigns in Europe at the time and the protocols that would restrict emissions did not kick in until the late 1980s – moreover, global sulphur emissions levelled off, with those in the West counterbalanced by those in the East). In any case, all such emissions are very low level compared to the stratospheric injections from volcanoes that are required to depress global temperatures. The brightening was observed even in Samoa.
I will eventually hunt down the IPCC para that confirmed this in 2007 (if you want to send me an email, I will send it to you when I find it! (peter.taylor(at)ethos-uk.com ).
Regarding the RFs. It is something I am currently reviewing and a subject i did not tackle in the research for ‘Chill’ – I assumed it was basic physics. You are quite right, I may be laying too much emphasis on Harde’s work, but my main point is that there is significant (to me) discord in the scientific literature on what is supposed to be basic science. On reflection, Harde seems less to be challenging the RF values as computed in watts/square metre at the tropopause (a convention for defining the equilibrium point and inputs of forcing into models) – he may do, I will wait to see the paper – but clearly does challenge the factor that translates this value to a change in temperature at the surface. Given the complexity of this area – clouds and aerosols, and IPCC’s own admission of very poorly constrained science for the models, there is ample scope for disagreement and uncertainty. As I noted, IPCC in 2007 preferred a factor of 0.8 (this would be applied, for example to the eventual doubling of the RF by 2050 or thereabouts of 3.5 watts/square metre). There are already sufficient doubts – summarised by Shine (GEOPHYSICAL RESEARCH LETTERS, VOL. 30, NO. 20, 2047, doi:10.1029/2003GL018141, 2003) who prefers a factor of 0.44. I do not know what the error margins are for the original RF at the tropopause calculations – but I am still reading the literature (please note, I am an ecologist by training – and thus have a non-specialist knowledge across several disciplines and this takes time!).
It appears that Modtrans – which was a private sector product, had been replaced with Hitrans, which has an international team from reputable institutions at work on it and is continually revised and scrutinised – this is what Harde worked with. There is, I assume, less uncertainty here than in the lambda factor noted above. Keith Shine has been kind enough with his to point me to the literature. I should add that he is a leading authority in the field and part of IPCC working groups on these issues.
I will check to see if I have understood things correctly on the values I quoted – my understanding is that at the tropopause the incoming short wave radiation from the Sun amounts to an average across the globe, taking account of the incident angle, of about 340 watts/square metre (it is about 1365 at the equator). That radiation is balanced by outgoing long wave radiation. (If I understand it, some or all models use the altitudinal point where the atmospheric temperature is -19 C, the temperature that fits the outgoing radiation profile, as the ‘equilibrium’ point for the calculations).
That 340 watts figure is then primarily reduced by cloud – by about 25%, in terms of the net flux of radiation to the surface – which gives you a gross figure of 255 watts. What I do note is that a small percentage shift in cloud cover can equal the whole of the accummulated carbon dioxide forcing – and we know cloud cover does vary of decadal time scales and is the main candidate for warming and cooling cycles in ocean basins. The whole of the MWP/LIA variability may be down to clouds (irrespective of the mechanism – and you don’t have to invoke Svensmark’s effects, though they probably do contribute).
I can’t account for the high modtrans figure – I have only seen one graph of the log relationship expressed in watts and it was not fully referenced – finding one is like looking for hens’ teeth – so if anyone else has access (to modern Hightrans equivalent) – please contibute your knowledge! But every graph I have seen of the computed translation to temperatures at the surface, shows that CO2 concentrations have a very large effect in the first 50 ppmv and very small effects beyond 200 ppmv – and the upper slopes of that graph will be subject to uncertainty….between 200 and 500 ppmv they are almost linear.
Calculating the ‘sensitivity’ is not straightforward – there are empirical ways looking at ice-cores, but the CO2 profiles do not match the temperature profiles in timing – with very large movements of temperature upwards before any CO2 upward trend, and drops when CO2 remains high, and even rises in T while CO2 is falling. I have seen estimates in the literature of 7ppmv per degree….which would place 100% of the warming from 180 to 280 ppmv as caused by CO2 and its assumed feedbacks – I don’t think the data supports this.
My overall impression – is that sensitivity to CO2 is much lower than IPCC models assume – even lower than Shine’s figure would suggest. Harde’s work looks to bring it down further…with a factor lying perhaps between 0.1 and 0.2 for lambda and hence about 0.5 C for the doubling. If the ‘truth’ lies somewhere between Harde and Shine, at say, o.3 then we are looking at only 1 C change by 2050 (assuming economic structures maintain growth of material consumption despite diminishing cheap energy supplies).
My main point has always been – the peer-reviewed literature is the best source of knowing how reliable the models are – you cannot rely upon the IPCC who long ago made a prior commitment to higher values – it is too hard for them to backtrack and say the problem might not exist!