In our previous post, we highlighted the BoM weather station on Willis Island, and wondered what would happen to it and to the staff who worked there.
Fortunately the staff has been evacuated prior to Yasi hitting the island. They apparently left everything running on automatic, including the radar. The data from the weather station tells the story of the approach and the hit.
Temperature and dewpoint converge as the air and the sea become one.
 The humidity pegs the meter.
 Rainfall soared.
 Barometric pressure dropped like a rock.
 And the wind peaked, the equipment failed, and the station went silent.
 The last radar image from the Willis Island BoM radar showed a massive eye.

You can watch the story the data tells at other weather stations in Queensland, just click on the map below to use the interactive BoM website.

BOM) recorded wind speeds of 185km/h on Willis Island before Cyclone Yasi took out the weather station on the island.
http://news.ninemsn.com.au/national/yasi/8205472/cyclone-smashes-weather-station
Wow that is awesome information Anthony. Thankyou
We’ve been closely monitoring this cyclone. My son, Matt, who is working /backpacking through Australia is staying in Tully, which is about 50 Km south of Innisfail and 16 km in-land.
Tully appears to be dead center in the projected path of this monster.
Matt is holed up in a bar called “Rafter Pub” with about 120 others. They have sandbagged the building and boarded up all the windows, as well as moved all the mattresses into the pub from the hostel rooms.
Judging from the wind and pressure data above, they have a very rough night ahead of them.
Thanks for that fantastic series of plots Anthony! Says it all.
I’m looking how T barely moved but DP merged. From a meteorological point of view have you ever seen that captured on tape before? That just might occur as tornadoes initially form too.
I certainly don’t wish to downplay the severity of this storm nor the impact is will have on our Queenslanders. From the radar image it appears that rainfall is only moderate rather than extreme. Rainfall on Willis Island was 60mm prior to the drop out, not huge for such a big storm. I wonder whether the cyclone is being overplayed to ensure that people don’t take risks and that damage is prepared for. Seems that the wind will be the problem rather than the rain.
Thanks for the great post Anthony, it really gives one an idea of the power of nature! Say just because we don’t post doesn’t mean that the silent majority isn’t watching. Keep up the good work!
Fascinating! Thank you for pulling all of this together.
~Chris
The linked clickable map is for the graphs.
http://www.bom.gov.au/qld/qld-observations-map.shtml
That clickable map is for the observations – more stations are presented, particularly reef-based stations.
Cheers
Very interesting data there. That pressure drop is stunning. That really tells the story of the power associated with a storm like that.
I grew up in Tornado Alley and have experience with that, but this is an entirely different beast.
Greatly appreciated, Anthony. Instantaneous scientific observation is amazing and it’s obvious that natural variability is behind this nasty weather.
Note that the wind direction shifted 180 degrees a couple of hours before the anemometer failed. Suggests that it already was damaged – probably lost it’s wind vane… It may be that the readings are suspect from about 6am.
“Lawrie Ayres says:
February 1, 2011 at 10:10 pm”
I agree with your sentiments however, the Australian media are stroking this one for all they can. Tracy, 1974, 50km wide (NT). Larry, 2006, 100km wide (Qld). Yasi, 2011, expected to be 500km wide (Qld).
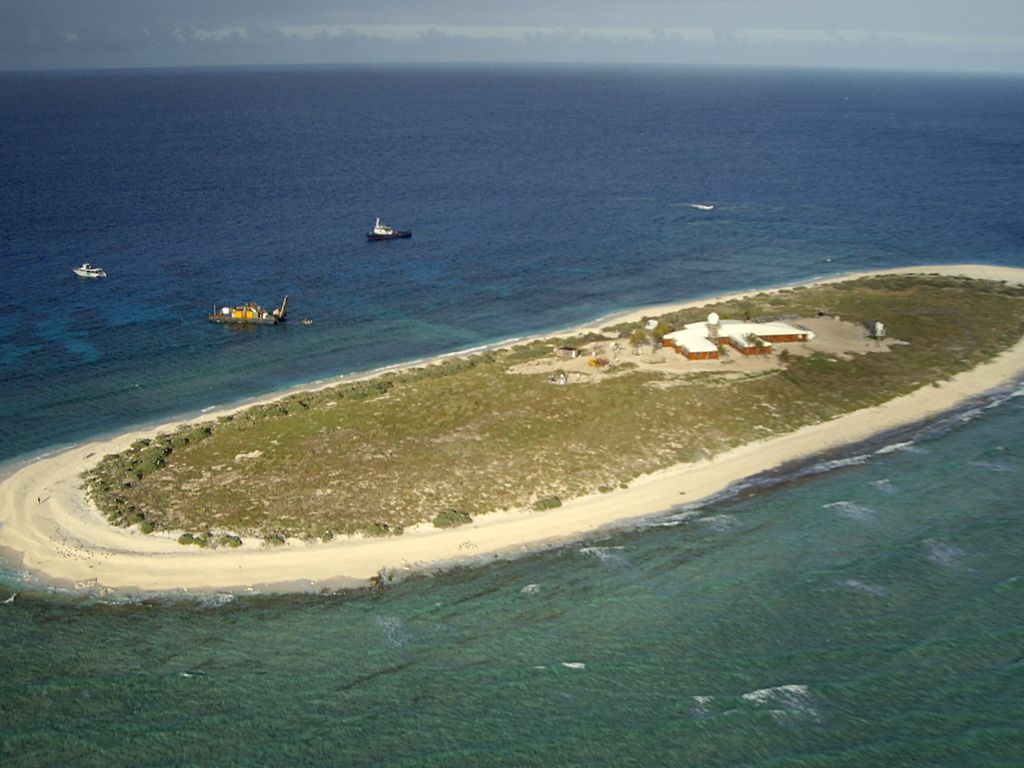
The data suggests it may have survived the wind only to be overcome by the storm surge.
Here’s a history of Australia’s deadliest & most destructive cyclones
http://www.reuters.com/article/2011/02/02/us-australia-cyclone-history-idUSTRE71113C20110202
Hey Patrick – funny thing is the international media seem to be ignoring it
“twawki says:
February 1, 2011 at 11:03 pm”
I think, possibly, the MSM in other countries are watching what went on in Tunisia recently, what is going on now in Egypt and what appears to be spreading to Morocco, Jordan and Yemen with more concern.
But at least people and authorities seem to be proactive with this storm. We’ll know for sure in about 6 hours.
I read a story on the Willis Island station once. It described the “cabin fever” the staff suffer there. Exacerbated by the fact that their drinking water (rainwater from the roof) all tastes of guano. Yuck!
It has been graded up to a category 5 cyclone, winds exceeding 300km/h. The radius estimate is 400kms. Barometric pressure is 942. There was a bigger one over a hundred years ago where the barometric pressure fell to 914. It sent surges over 40 feet high and over half a kilometre inland.
Of course the green dingbats are howling to gaia that this is all about climate change and it justifies a multibillion dollar carbon tax. A stacked committee with the terms of reference to produce a tax is in action. Skeptics were banned from the committee. Our fool of a Fabian Prime Minister is already urging part time workers and the disabled to work harder because she knows the carbon tax will destroy our economy.
Even the simplest school child knows this is about the La Nina pattern.
Jeff C says:
February 1, 2011 at 9:58 pm
Judging by the fact they’re in a pub, have moved the mattresses to where the alcohol is (no doubt to protect the bottles) they’ll have one ‘ellova night.
Some will probably not even remember the cyclone by the time they wake up. lol
But seriously, good luck to your son and the people with him.
Yep I agree wind speeds at many locations eg Flinders Reef are nothing like predicted. Maybe the core is small and intense with stronger winds?
Awsome, Thanks.
The more I look at TC Yasi, the more I think it’s gunna be a bit of a fizzer. As big as it looks on the radar images, I don’t think it’s as severe as it’s made out to be. Lets hope so.
Cyclone Yasi is obviously caused by global warming just like the record breaking storm surge of 1899.
/sarc
————–
————–
@Jeff C:
This map: http://chiefio.files.wordpress.com/2011/02/idq65001.gif
that I picked up from the A.BOM looks like a direct hit on the pub is likely. May that “inland” bit be enough for a significant weaking of the winds….
There’s a link to the BOM site where I picked up that map in this posting:
http://chiefio.wordpress.com/2011/02/02/austrailia-braces/
where you can get a more recent version as time passes.
Best of luck to you and yours…
“Baa Humbug says:
February 1, 2011 at 11:30 pm”
Priorities priorities.
When Cyclone Tracy hit Darwin at Christmas 1974, it was night time and many people had started Christmas festivities in the way that Top End people know. There is still a theory that relaxed (drunk) people can survive falls better than tense, alert people. I was at Head Office in Sydney, but we had more than 80 staff and family people in Darwin. Some has been blown from the first level to the ground when the home was taken off at floor level, which was commonly on stilts.
This being the Top End, there was deep sympathy for those who were hurt or who perished. There was also a string of incredible stories from those who were there. (It’s a place of adversity and diversity). Like the imprint of a refrigerator in the side of the high steel tank that was Darwin’s immediate water supply. Like the hippie couple who had tried LSD for the first time and were heard walking through the ruins at first light muttering “Wow! What a trip. I’m off this for Life.”
In hindsight, the death toll was low because of a simple piece of architecture. It was common for the home laundry, often beneath the house on stilts, to be built from concrete brick. This was the safe refuge for many families. Despite this being widely known, I have never seen a proposal to build similar cheap boxes in cyclone prone areas elsewhere. By tomorrow, I hope that not many Queensland people are missing for the lack of a brick laundry.
wayne says:
February 1, 2011 at 10:05 pm
“I’m looking how T barely moved but DP merged.”
You may notice also 100% humidity during that time. Very cool data.
The BOM are pretty good at monitoring – as anyone who has been watching this cyclone can attest. They have good public access to satellite maps and all the rest, updated every 10 minutes or so.
If only they continued to focus on this essential work (what expensive and redundant management consultants would call their core mission) and got out of ideologically driven futurology, the world would be a better place. It also seems to indicate, as posters in other WUWT threads have suggested, that like the UK Met Office, there are 2 camps in the organisation. There are the ‘sexy’ futurologists, and the serious science and technical people who work hard to provide this essential service to the best of their ability.
Given our small population and massive area, I dips my lid to the real workers in the BOM who have made it possible for everyone to see what is happening so clearly and easily. Of course, they are piggybacking on the work of others in terms of satellite monitoring etc. Still, anyone in the world with internet access can follow exactly what is occurring – no data fudging possible there. And, touch wood, the sites are managing the increased traffic just fine.
What a contrast to the voodoo and spin of the futurologists, who are no doubt on the fast track for promotion in the BOM!
My money is on the storm surge having taken out the weather station, a close up view of the island shows it is only a few meters above sea level.
Thanks, Anthony, wonderful how technology gives us new windows on our world.
It’s amazing to think as I sit here in a small village in scotland, I can see the latest radar from the other side of the world almost live!
Compare that to the time when I lived in Australia in the 1960s. We literally had to wait 4 hours for a telephone line to come free to make a telephone call back to England – one which had to be booked something like a month in advance.
It’s the sheer simplicity of reporting on disasters the other side of the world which is why the news is now full of natural disasters!
This is why everyone thinks the world has more natural disasters … the public and media are being bombarded to overload with this and that natural disaster and they cannot help thinking the number and severity has gone up … but the scientific facts speak otherwise!
Eyeballing the temp data for willis island since 1921 (using the BOM monthly charts) it sure doesn’t look like its been warming up there for the last 90 years.
I was curious because the island would have little in the way of UHI signature, assuming the paths and hardscape is clear of the recording devices.
Looks like Innisfail is going to be where it lands.
http://www.bom.gov.au/products/IDR192.loop.shtml#skip
Jack rants
————-
Even the simplest school child knows this is about the La Nina pattern.
————-
Probably not true. But then again it was just an insult, not that anyone cares.
However if it was La Nina we would have a cyclone of similar magnitude every time we have a La Nina. And we don’t.
Why don’t you just count it as a random event possibly made worse by La Nina and possibly made worse by CO2. A lot more honest.
Have you noticed the sea surface temperatures off the coast of Queensland?
Lawrie Ayres, it could be that the rain gauge broke.
Baa Humbug:
I have to agree with you. I’ve looked at all wind speeds in the area to 8pm when the BOM says coastal areas between C Flattery and Sarina are experiencing damaging winds with gusts up to 90km/hr:
Townsville had a gust at 98kmh at 8pm, Hamilton Island 109kmh (117 at 4pm and 5pm), Lucinda gusting over 100kmh since 3.30pm, highest 120 at 6.30pm, and obviously between Innisfail and Cardwell would be similar. but none others within cooee. Cairns at 8.00 48kmh!
Willis Island would have gone higher than 185 as the pressure kept going down, but highest gust recorded anywhere else was 167 at Flinders Reef at 2pm, 141 at Holmes Reef at 7pm. Next highest was 120 at 6.30 at Lucinda. So I will keep checking the figures for the next 12 hours or so but the wind speeds are nothing like what has been claimed, certainly nothing approaching 290kmh. Thank goodness for that! Time will tell, let’s hope it fades away to nothing.
Bruce left Willis.
(Couldn’t resist)
One of the TV media stations has almost continuous coverage of this coming event.
The host of the program interviewed a weather disaster expert earlier on this evening Australian Eastern time.
The host kept talking this current event up – e.g.
Stating that is the largest cyclone for 100 years. Nope, said expert citing other past events.
Host tried again : largest in living memory? Not really said expert citing other past events.
Host: this will cause the most damage? Nope, said expert.
Don’t think that expert will b e invited back again.
Thnaks Antony, good reports.
Jeff C says: February 1, 2011 at 9:58 pm
If you can ring/text your son. Then ask him to organise a group of 10. Chat/text their names, family and contact details. Then switch off mobiles (or maintain recharging) and use 1 contact a day to contact one family member and relay messages to other 9.
Likely if direct hit network will go or be slack, power could be off for a week (worst scenario).
Worst is the CLOGGING of the networks as everyone texts or tries to ring.
Baa Humbug says: February 1, 2011 at 11:30 pm
Yes, the pub and empty bottles are a good idea- can fill with clean water. And the mattreses are also handy.
People here have been saying that it is reported worse than it is.
I still reckon a direct hit south of Cairns and people not nestled down could be in for some trouble. Better to be safe, cheery and with friends.
Jeff C and Baa Humbug
But if the beer pumps are electric and they lose mains power?
Thanks Anthony, great post!
This is one of those events where Twitter actually becomes extremely useful for realtime news updates:
http://search.twitter.com/search?q=%23tcyasi
And ABC News 24 (Australia) has unblocked its realtime TV stream for global viewing:
http://www.abc.net.au/news/abcnews24/
I notice that Australia’s “Warmistbureaupolitik” the ABC simply cannot help themselves. http://www.abc.net.au/news/stories/2011/02/01/3127091.htm
Once again (like the Queensland floods and Victorian fires (early ’09)) they make some vague loose ‘couldbe- maybe’ references to how AGW might be responsible. They also fabricate a “fact” about a 100% increase in C4 and C5 cyclones globally, however this is irrefutably incorrect.
(See: http://www.coaps.fsu.edu/~maue/tropical/)
“Since 1979…Global TCs of Hurricane Force + show no upward trend in frequency.”
It would appear that Yasi is Katrina’s big brother.
Patrick Davis says:
February 1, 2011 at 10:47 pm
“Lawrie Ayres says:
February 1, 2011 at 10:10 pm”
I agree with your sentiments however, the Australian media are stroking this one for all they can.
By Bonnie Malkin, Sydney 7:30AM GMT 02 Feb 2011
After intensifying overnight, the storm is travelling at 20mph and measures 360 miles wide. The same strength as Hurricane Katrina, the storm is expected to be the biggest and most deadly cyclone to hit Australia in history.
http://www.telegraph.co.uk/news/worldnews/australiaandthepacific/australia/8297904/Cyclone-Yasi-La-Nina-and-record-ocean-temperatures-behind-storm.html
By Bonnie Malkin, Sydney 10:30AM GMT 02 Feb 2011
Alan Sharp, national manager, tropical cyclone warning services, of the Australian Bureau of Meteorology, said the cyclone was the worst Australia had seen for more than a century.
“Yasi is not enormously unusual but it is at the top-end of the scale as far size goes as well as intensity,” he said.
The country’s most deadly cyclone to date hit in March 1899 cyclone, striking a pearling fleet on Cape York Peninsula and killing more than 300 people.
A major global study in 2010, based on complex computer modelling, found that tropical cyclones will become stronger, with the intensity increasing between 2 and 11 percent by 2100.
http://www.telegraph.co.uk/news/worldnews/australiaandthepacific/australia/8297904/Cyclone-Yasi-La-Nina-and-record-ocean-temperatures-behind-storm.html
The worst most deadly cyclone to hit Australia was Cyclone Tracy, which devastated the Northern Territory capital of Darwin in 1974, killing 71 people.
http://www.telegraph.co.uk/news/worldnews/australiaandthepacific/australia/8297597/Cyclone-Yasi-factfile.html
Here is a list of the most deadly cyclones in history:
1. Bhola Cyclone 1970
In November 1970, 500,000 people were killed when the Bhola Cyclone hit what is now Bangladesh.
2. Indian Cyclone 1839
In 1839 a powerful cyclone struck India, killing 300,000 people.
3. The Calcutta Cyclone 1733
There are few records about this cyclone, but the weather system is known to have killed 300,000 people and destroyed 20,000 ships when it hit Calcutta in 1737.
4. The 1975 Super Typhoon Nina 1975
The Super” Typhoon Nina was one of the largest recorded typhoons in history and the second most deadly hurricanes in the Pacific.
5. The Great Backerganj Cyclone 1876
In 1876 this cyclone formed over the Bay of Bengal. Its maximum wind speed recorded was at over 136mph and the largest storm surge was 45ft. The cyclone killed around 200,000 people and the property damage was massive. The storm also caused famine and epidemic.
6. Cyclone Nargis 2008
In May 2008 Cyclone Nargis hit Burma, packing winds of up to 133mph.
As it slowly travelled over the country, 1.5 million people were affected. The Labutta Township alone was reported to have 80,000 dead, with about 10,000 more deaths in Bogale. An estimated total of 146,000 people died.
7. The Bangladesh Cyclone 1991
On the night of April 29, 1991, the southern part of Bangladesh, Chittagong, was hit my a powerful Cyclone., with wind speeds of up to 160 mph. At least 138,000 people died in the storm,
9. The Swatow Typhoon 1922
The Swatow Typhoon in 1922 was first spotted July 27 near the Caroline Islands in the Pacific Ocean. The typhoon moved slowly north as it intensified. In August the typhoon hit the Chinese city of Swatow with the winds blowing at 100mph. The water levels as the storm hit were 12ft above normal and left the land saturated with water many days after. Nearly 50,000 people were taken as the storm swept over Swatow.
10. Calcutta Cyclone 5th October 1864
On October 5 1864, a powerful cyclone hit near Calcutta, India, killing around 60,000 people. Over 100 brick homes and tens of thousands of tiled and straw huts were leveled. Most ships in the harbor (172 out of 195) were either damaged or destroyed.
http://www.telegraph.co.uk/news/worldnews/australiaandthepacific/australia/8297595/Cyclone-Yasi-worst-cyclones-in-history.html
2 hrs to landfall.
The mayor of Innisfail – where the cyclone will make first landfall – was just interviewed.
A few hours ago the police and emergency response did a house to house with mandatory orders to evacuate. Around 100 people failed to comply – they are on their own.
Now emergency calls are being received from some of those people. They are in desperate situation. There is nothing emergency services can do. Very bad.
Landfall still two hours away.
Hold on to your hats! we will be told by the BBC that this is Anthroprogenic Global Warming
Thanks to Zorro:-
Cyclone Ingrid, 2005: a category 5 cyclone, it swirled across three states and territories — Queensland, the Northern Territory and Western Australia. It was small in size but very intense. No reports of serious injury or death.
Apparently, according to BBC lunchtime News (BBC1) today (02.02.11), Australia has “rarely, if ever” faced a storm of such magnitide! Plus the recent Queensland floods were the “worst ever”. S0 1974 was a walk in the park as were the two in 1918? I would happy for someone to confirm or deny those BBC statements of fact. I expect they are being a little picky to sensationalise it, & it’s always easy to get a bystander to burst into tears for the camera.
This data points to a mediocer storm, hurricane-wise. 60 mm = 2.36 inches, 185 km/hr = 115 mile/hr.
Perhaps this equipment gave out way before the storm hit since it was supposed to be a cat 5 storm (> 250 km/hr = 155.4 miles/hr ).
For a look at where the Eye is right now, check out either of these two Rain Radar loops:
256 km Cairns Radar Loop
256 km Townsville Radar Loop
Those of you living south of the path should watch out. Even if the eye passage isn’t all that close, the forward speed of the storm adds to the wind speed on that side.
Baa Humbug says:
February 1, 2011 at 11:42 pm
The more I look at TC Yasi, the more I think it’s gunna be a bit of a fizzer. As big as it looks on the radar images, I don’t think it’s as severe as it’s made out to be. Lets hope so.
—————————————————————
As part of WUWT’s continuing education program about different versions of English, I should explain that a ‘fizzer’ in Australia is a firework that, instead of going ‘bang’, goes ‘phizzz’.
However, it does seem that the catastrophic effects of Yani won’t be quite as bad as predicted.
I am not sure how useful discussions about individual events are to overall discussions about climate. As Anthony, and we, all know, people are passionately concerned about weather (including this latest Queensland cyclone).
I have got half a dozen tabs open showing different dimensions of the approaching Yani. It is fascinating. But, I do not imagine that it has anything to do with forecasting.
Lazy Know-It-All says:
“Have you noticed the sea surface temperatures off the coast of Queensland?”
You mean where those mild yellow and blue colors are?
http://www.osdpd.noaa.gov/data/sst/anomaly/2011/anomp.1.31.2011.gif
Dear Anthony/Mr Moderator
The Guardian have already started:-
“So we can’t just continue to mop-up without thinking about how fossil fuel emissions are changing our climate.”
http://www.guardian.co.uk/environment/damian-carrington-blog/2011/feb/02/cyclone-yasi-australia-climate?commentpage=last#end-of-comments
I found this on Wiki and is in respect of a Cat 5 storm in 1899
http://en.wikipedia.org/wiki/Cyclone_Mahina
Mike Haseler says 2:06 am: “This is why everyone thinks the world has more natural disasters … the public and media are being bombarded to overload with this and that natural disaster ”
And that is why amateur climate science – like environmentalism generally – is “the science of solipsism.”
“Everything I see in my immediate vicinity and experience is the way the world is, everywhere!”
It’s just one reason why so many urbanite yuppies living in dirty cities believe the entire planet is filthy and polluted, just like their own cesspool.
Checked the location map, stats and satellite map just before bed last night and was absolutely horrified for those folks and they’ve so much on their plates already. The pressure drop on the chart above…is what your stomach does as the thing keeps getting closer and just doesn’t calm down any. (Went through Bertha and Fran in ’96 and thought that rendered me a veteran. The night Ivan came ashore, I was reconsidering my attitude…)
The real-time weather data seems relatively moderate. The eye is onshore now so landfall has happened. Both wind and rain north of the eye are apparently very moderate. Cairns Aero has recorded maximum 85 kph gusts and 15 mm rain. Winds and rain are stronger on the south side, with Townsville recording 120 kph gusts and 75 mm rain. Lucinda which was apparently right in the eyewall recorded 185 kph gusts but only 25 mm rain. It would seem that Yasi made landfall as weak category 3 on the Saffir-Simpson scale.
Weather data here:
http://www.bom.gov.au/qld/qld-observations-map.shtml
It would seem that Yasi made landfall as weak category 3 on the Saffir-Simpson scale.
“Whew!” if that holds up.
Great satellite picture here:
http://earthobservatory.nasa.gov/IOTD/view.php?id=49066
While checking out the wind speed for Lucinda (close to where Yasi has fallen), I noticed the temps seem a bit screwy:
http://www.bom.gov.au/products/IDQ60801/IDQ60801.94295.shtml
Created by the high wind?
“johanna says:
February 2, 2011 at 6:11 am”
I’ve been watching this on Channel 7 and ABC News 24 and the reporters are there, webcams and all, just wating to be “the first to record”! Channel 10 “will be the first to record, and broadcast, the aftermath”…all the webcam images, well the worst ones I could see, were like a normal windy westerly night storm in the Wairarapa in New Zealand.
Almost everyone who is interviewed are “terrified”. I wonder if that is due to media hype?
It certainly is sad for the locals however, as I said before about living in flood plains, if you live in a “disaster” prone zone, expect a disater at some point in time.
The island looks flat, so the storm surge probably swept completely across it! I am glad they got the people off before it hit.
Dave N says:
February 2, 2011 at 8:00 am
Yeah, that 63.5C sure looks in need of some homogenisation!
Winds suddenly dropped to near-zero at 0900 2 Feb.
Either the eye crossed the station, or the anemometer got destroyed.
This is great data which tells a very dramatic story. I think I will use this in my earth science class this week – we just started talking about barometric pressure.
Thanks!
Jason
It is 6 am, Feb 3. Yasi is downgraded to Category 3. Little solid report during the night, and it’s been mostly positive. The sky is lighting up on the eastern seaboard. The scale of destrcution shall be known soon.
I can’t help wondering if it ever was more than a category 3, though a geographically big one. There has been a lot of talk about 250+ kph winds, but I can’t remember seeing any actual measurements over c. 100 knots. It seems odd that a Cat 5 would drop to a Cat 3 so quickly while over one of the worlds’ warmest ocean areas.
As things stand now it seems likely that the Townsville area was worst hit while Cairns is unlikely to have suffered significant damage.
Ken Stewart says:
February 2, 2011 at 3:22 am
Baa Humbug:
“I have to agree with you. I’ve looked at all wind speeds in the area to 8pm when the BOM says coastal areas between C Flattery and Sarina are experiencing damaging winds with gusts up to 90km/hr:
Townsville had a gust at 98kmh at 8pm, Hamilton Island 109kmh (117 at 4pm and 5pm), Lucinda gusting over 100kmh since 3.30pm, highest 120 at 6.30pm, and obviously between Innisfail and Cardwell would be similar. but none others within cooee. Cairns at 8.00 48kmh!
Willis Island would have gone higher than 185 as the pressure kept going down, but highest gust recorded anywhere else was 167 at Flinders Reef at 2pm, 141 at Holmes Reef at 7pm. Next highest was 120 at 6.30 at Lucinda. So I will keep checking the figures for the next 12 hours or so but the wind speeds are nothing like what has been claimed, certainly nothing approaching 290kmh. Thank goodness for that! Time will tell, let’s hope it fades away to nothing.”
It helps to have a little understanding of the structure of cyclones.
Extremely destructive winds occur within the inner eyewall of the cyclone which in most cases is only 10-20km across. Outside of this the wind speed drops very quickly. The measuring station at Flinders Reef was 65km from the eye of the TC Yasi so was at least 40km from the inner eyewall which is why the maximum gust recorded was only 167kmh.
By comparison, given the movement speed of 30kmh and Yasi entering the inner eyewall at Willis Island at about 8am, it would have been about 65km from the eye at around 6.30am at which point it was registering wind gusts at 130kmh.
No BOM measuring station other than Willis Island was in the eye of this cyclone and Willis Island measuring station was put out of action just as it was entering the inner eyewall. The closest mainland station to record measurements was at Lucinda and clearly from its measurements it was in the northern part of the eyewall and measured a maximum gust at 185kmh. As the storm was moving at about 30km at landfall this would translate to maximum windgusts in the 250-260kmh range on the south side of the eye at landfall on the southern side at the very least. There was simply no measuring station in place to measure those speeds though.
It is worth noting that Townsville 150km south of the crossing point experienced maximum wind gusts in excess of 130kmh which gives you an indication of the true strength of the storm.
So at landfall it seems Yasi was very close to the strength of BOM forecasts but fortunately crossed in a lightly populated area. I think when film crews get into those areas they will find devastation.
“”””” johanna says:
February 2, 2011 at 6:11 am
Baa Humbug says:
February 1, 2011 at 11:42 pm
The more I look at TC Yasi, the more I think it’s gunna be a bit of a fizzer. As big as it looks on the radar images, I don’t think it’s as severe as it’s made out to be. Lets hope so.
—————————————————————
As part of WUWT’s continuing education program about different versions of English, I should explain that a ‘fizzer’ in Australia is a firework that, instead of going ‘bang’, goes ‘phizzz’.
However, it does seem that the catastrophic effects of Yani won’t be quite as bad as predicted. “””””
So in ‘strine, just what the blazes is a ‘yani’; most other places, he’s some sort of ersatz musician/singer/noise maker.
And forgive me for asking; but are you one of those cool/hot Bondi Sheilas ? Enquiring minds, want to know ?
“”””” John M says:
February 2, 2011 at 6:14 am
Lazy Know-It-All says:
“Have you noticed the sea surface temperatures off the coast of Queensland?”
You mean where those mild yellow and blue colors are?
http://www.osdpd.noaa.gov/data/sst/anomaly/2011/anomp.1.31.2011.gif “””””
So a couple of questions come to mind, looking at some of these pictures/maps.
How far off shore is the Great Barrier Reef (mainly) , and what sort of water depths are there off that North Queensland coast ? I know that Cairns, is a mecca for really big Black Marlin enthusiasts; and I have always presumed; what the hell, assumed that they are fishing waters outboard of the GB Reef; but I dunno if that’s so.
I’m thinking if the reef’s waters are quite shallow, even if maybe warmer as a result, that the energy available to a
Hurricane^-1 might be somewhat attenuated compared to a deep ocean situation.
So maybe Dr Roy can get us some up to date, lookum down pictures (Temperature wise) of the Yasi trail of the SSTs off Q.
Maybe the BG Reef is a natural Cyclone attenuator, although the eye is apaprently all ashore now.
Nother question; what is the inland terrain of that part of Australia ? I always thought that 90% of Australia was less than 10 feet above sea level. In any case, I’m wondering if the inland terrain, has any special properties as regards shutting down monster storms ? If there’s nothing in the way to drive the weather to higher altitudes, I would think things would just blow right on out the other side; that’s been my thinking as to why Aussieland doesn’t get much rain.
I guess I need to hit the topo maps.
Hey Aussies–Why did y’all put a weather station on a little ole island like that? —Judy in Troup, TX
Morning radio news papers here in Oz report measured wind velocities up to 290 km/h. That’s cat 5 even on the international scale.
Mission Beach is well known for its flightless cassowaries (think of an ostrich with a bad temper). It may be some poor birds got a taste of what flight is like overnight.
“”””” Bruce says:
February 2, 2011 at 2:09 pm
Morning radio news papers here in Oz report measured wind velocities up to 290 km/h. That’s cat 5 even on the international scale.
Mission Beach is well known for its flightless cassowaries (think of an ostrich with a bad temper). It may be some poor birds got a taste of what flight is like overnight. “””””
Maybe those grouch birds are like the Penguins; they just don’t know that you have to flap a little bit harder, to get airborne.
Any way, what’s the difference between the Flightless Cassowaries of Mission Beach, and the regular flying kind; and are they a bit like the Emu, and taste like chicken ?
At around 4:00 AM PST this morning, our local T&V news reports from Australia (actually on a Communist Red China TV News Station), said that peak winds of 300 kph had been measured on the south eye wall area.
So any idea where exactly the eye went through; specially that south wall. I guess my Aussie buddy, who’s built like a Cape Buffalo (ex-cop) lives off the Gold Coast; some place called Bribie Island.
Willis Island is a perfect place to monitor TC’s from. Its a brick bunker and the location of the Radar there makes a huge difference to our knowledge of the actual strength and particularly the position of the eye of the approaching TC’s . It also has great fishing I’m told.
The eye crossed over Mission Beach where my uncle lives. He reports it was much stronger than TC Larry .The eye took about an hour to pass, with the transition to huge winds from opposite direction only taking a minute r so. The second half was worse than the first and it took about 8 hours to pass. The trees are all stripped of leaves and many are down. Most power poles are standing, his house and many in the town took the full brunt of the wind with reported strengths close to 300Km/h. But the concrete filled walls , stood up well. There are many houses without roofs.
Tidal Surge was only a couple of meters which missed the high tide. No reports of fatalities as of yet. Thanks for your concern , thoughts and prayers.
With all the talk from warmists about the “unusual weather” somehow explaining global warming I was wondering if anybody had done any analysis of weather stations to the unusuality (not sure if this is a word) of it?
I know that when a weather station is first opened it sets at least 365 new highs, 365 new lows, 365 new high lows and 365 new low highs (talk about unprecedented and maybe even 366 new alltimes if it opens on a leap year) but has anyone analyzed how many of these records are broken over say the next 100 years. I know the second year would minimally set or tie 712 of these records but how do they break down after that?
Every year since I was born it seems that at least two or three records are broken here in Edmonton, Canada (more cold than warm lately) and I was born in 54. There seems to be a distinct lack of acknowledgement that there have been unprecedented this and that since the beginning of humans measuring this and that. I would hope that by showing that you have 150 countries * 365 days * 4 chances per day that statistically it would be very “unusual” if there weren’t any records set.
I remember the day when my grade eight math teacher decided we were to be taught about permutations and combinations which really means probabilities. He bet the class of 40 students that even though there were 365 days in a year and only 40 students in the class that at least two of us would share the same birth date. Of course we took the bet but lost miserably as three pairs shared the same birth date. We thought he had cheated us (even though we didn’t have to pay) but soon learned that the math says that it is much more likely than not that he would win this bet. I feel like some of the warmists/alarmists need to learn this lesson and a study of record breaking probabilities just might stifle them a bit.
George E. Smith says:
February 2, 2011 at 2:30 pm
George – When I was living in N Queensland there was a story of a guy who stopped his car in front of a male cassowary, since it was standing in the middle of the road to Mission Beach (which is a nice beachside villiage right next to the rainforest). It kicked his car’s radiator in, pretty much destroying it, then wandered off into the bush. The locals are quite cautious around them especially in breeding season.
Meanwhile the news suggests few people have lost their lives, but Tully has been flattened.
[Mission Beach is well known for its flightless cassowaries (think of an ostrich with a bad temper).]
Better than that, think of a tall colourful bony-headed mean-clawed dinosaur with feathers !
Put “Cassowary” into google images or youtube and see what I mean.
Dunno if I’d want to encounter one while out walking … their middle toe looks like it could gut you in an instant.
regarDS
Cassowary – think of an Ostrich or Emu. Then imagine one that would be adapted for life in tropicalal rainforest rather than open plains. So Ostrich/Emu = lean and speedy; built to run. Cassowary = heavily built and sturdy.
I don’t know about bad-tempered – I think that might be just anthropomorphism – but they do get defensive and territorial. And will kick the crap out of a person!
Jeff C says:
February 1, 2011 at 9:58 pm
Hey Jeff, how’d your son Matt get on?
George E Smith
Yeah get on to a topography map. You’ll find that far north of the East Coast of Oz the Great Dividing Range gets very close to the coast.
But as World standard ranges go, ours are a bunch of big hills.
Yes TC Yasi caused a fair whack of damage to Tully and Mission Beach that were right in the eye, but the rest of Yasi did buggerall compared to the dire prognostications.
No deaths no injuries thus far. In the great scheme of things, Yasi was all talk and no action. [Typical woman 😉 ]
David W says: /No BOM measuring station other than Willis Island was in the eye of this cyclone and Willis Island measuring station was put out of action just as it was entering the inner eyewall. The closest mainland station to record measurements was at Lucinda and clearly from its measurements it was in the northern part of the eyewall and measured a maximum gust at 185kmh. As the storm was moving at about 30km at landfall this would translate to maximum windgusts in the 250-260kmh range on the south side of the eye at landfall on the southern side at the very least. There was simply no measuring station in place to measure those speeds though.
It is worth noting that Townsville 150km south of the crossing point experienced maximum wind gusts in excess of 130kmh which gives you an indication of the true strength of the storm.
So at landfall it seems Yasi was very close to the strength of BOM forecasts but fortunately crossed in a lightly populated area. I think when film crews get into those areas they will find devastation./
Ingham is a large town 25 km SW of Lucinda, so by your calculations should have been close to the south side of the eyewall and experiencing 250-260kph winds. But this news report says “Ingham locals say they are surprised Yasi did not cause more damage and the town appears to have been spared the worst.” http://www.abc.net.au/news/stories/2011/02/03/3128844.htm
And Townsville is only 100km south of Lucinda as the crow flies.
My point is: BOM was predicting much greater wind speeds than this for a much greater distance.
George E. Smith says:
“I always thought that 90% of Australia was less than 10 feet above sea level. ”
That is a common misconception. Actually Australia is a rather high continent, but most of it is rather flat and there are no really high mountain chains, rather like Africa as a matter of fact (though without major volcanoes).
Bruce says:
February 2, 2011 at 2:09 pm
Morning radio news papers here in Oz report measured wind velocities up to 290 km/h. That’s cat 5 even on the international scale.
Show me a measurement. Your link says:
Yasi made landfall at Mission Beach about midnight, about 100km north of Ingham, as a category five storm, packing winds of up to 290km/h.
It doesn’t say measured; you have assumed ‘measured at 290km/h’ from a statement of ‘up to 290km/h’.
WUWT?
Billy Liar at 5:06 am:
“It doesn’t say measured; you have assumed ‘measured at 290km/h’ from a statement of ‘up to 290km/h’. WUWT?”
I was watching both ABC (Aussie TV) on live Internet streaming, as well as the live meteorology reports from your national bureau (BOP?) yesterday, until long after the eye had passed through Tully.
I do not recall any wind reading exceeding 130kph being shown, although I admittedly may have missed something. I did not see any landfall report at any time – even as the eye of the storm made landfall – coming even close to 290kph. Not even half that.
Here in the States and elsewhere I’ve sometimes been in winds far exceeding 170kph (100 mph) for example on Mt. Washington, NH and also near active tornadoes, so I can assert that 130kph (80mph) is not very impressive at all for an alleged Cat 5 cyclone.
George E. Smith says:
February 2, 2011 at 1:48 pm
“”””” johanna says:
February 2, 2011 at 6:11 am
Baa Humbug says:
February 1, 2011 at 11:42 pm
The more I look at TC Yasi, the more I think it’s gunna be a bit of a fizzer. As big as it looks on the radar images, I don’t think it’s as severe as it’s made out to be. Lets hope so.
—————————————————————
As part of WUWT’s continuing education program about different versions of English, I should explain that a ‘fizzer’ in Australia is a firework that, instead of going ‘bang’, goes ‘phizzz’.
However, it does seem that the catastrophic effects of Yani won’t be quite as bad as predicted. “””””
So in ‘strine, just what the blazes is a ‘yani’; most other places, he’s some sort of ersatz musician/singer/noise maker.
And forgive me for asking; but are you one of those cool/hot Bondi Sheilas ? Enquiring minds, want to know ?
———————————————————————-
George, Yasi was not named by Australia – we just go with the name that is given by the relevant authority where the cyclone originates. In this case, I’m pretty sure it was named by the Regional Specialized Meteorological Center in Nadi, Fiji (the name appears on their list). No idea if it means anything, but I suspect it’s just a Fijian name.
As for Q.2, you are very kind to suggest it. That’s all you’re getting, though!
With regard to cyclone damage, it looks as though a combination of good luck (missing the high tide, crossing a lightly populated area at peak) and good management (preparation and retreating to safe buildings) averted what could have been a catastrophe. Lots of property damage, but no loss of life according to reports so far.
“”””” johanna says:
February 3, 2011 at 8:34 am
George E. Smith says:
February 2, 2011 at 1:48 pm
“”””” johanna says:
February 2, 2011 at 6:11 am
Baa Humbug says:
February 1, 2011 at 11:42 pm “””””
Well I was just Yanking your chain (pun intended) there Johanna, I’m sure “Yani” was just a typo on your part; but since there evidentlyis some music hombre of that name or similar, I just couldn’t bring myself to leave it alone. Well our Hurrinames are also chosen by committe; and we don’t get a say either; I’d use Chinese names; they only seem to have four letters.
So On Q2 I’ll go with the vision.
I saw some T&V footage of the blokes filling sand bags out there somewhere in the north Q, probably Sheilas too, and everybody was just pitching in; which is really the down under style isn’t it.
Glad for the lack of fatalities; it says a lot for the locals and their authorities, that the people were evidently well prepared to deal with it seriously.
Probably totally pissed off about the earlier flooding, if the truth was known; but I’m glad y’alls came through it, and hopefully injuries were minimal too.
Every time we have a biggie coming ashore over here; there are always some “folks” who insist on having a party; or sitting it out; and they never give a thought for the risks that first responders may have to take, to rescue their worthless hides, when Mother Gaia, rolls them.
When Mt St Helens blew in 1980 I believe, there was this silly old coot named Harry Truman; unrelated to the past President; and he wasn’t going to leave his bungalo at the foot of the mountain (on the Lake shore). I think he’s now buried under 600 feet of solidified volcanic ash concrete. Gaia knows no bounds when she is pissed. Harry, obviously never heard of Herculaneum, or Pompeii .
Well my Musk Ox Mate just sent out a picture of a couple of good sized trophy Barramundi getting along on Hiway 1 just south of Cairns.
I don’t remember if you buggers drive on the wrong side of the Hiway or not so I can’t tell if these chaps were going against traffic or not, in any case they were about to cross the yellow Centre line, so one way of another they were out enjoying the new habitat. Lotta smaller morsel critters getting along too, and I suspect that the Barras were probably giving them a bit of a hurry up.
Hope they all made it back to some better road conditions than Hiway 1.
Wouldn’t mind being down there with you blokes to help with the clean up; but somebody’s gotta work to pay for our Bankrupt Social Security scam.
Re the etymology and source of ‘Yasi’, here we go:
http://www.theaustralian.com.au/in-depth/cyclone-yasi/fragrant-tree-link-to-mighty-tempests-name/story-fn7rj0ye-1225999801465
It’s Fijian for sandalwood. Apparently there are no Fijian names starting with Y.
I suppose that naming cyclones is one of the (few) perks of being a meterologist!
Reply to Ken Stewart on 2nd. Feb.@10.12pm
Ken , you assumptions seem to be correct to me, and i’m on the beachfront about 50 kms south of Lucinda. Regarding the wind in Ingham, you may like to look at the Cardwell Range shape which would have protected Ingham to a reasonable degree given the location at which Yasi came onto the mainland and the wind directions.
Reply to David W on 2Feb @1.33pm
As a category 5 cyclone has not been reported to have crossed the Queensland coast since 1918 and neither of us were alive then, I question the assumption of the BoM about wind speeds ,storm surge levels, and the category 5. While I have great respect for the BoM and the fine work that they do to keep us safe, maybe this time the community should be told actual readings in all areas recorded to justify the 290+ kms claim.. I lost the roof of my house in Townsville in cyclone althea in 1971, so I know the pain that some people are experiencing at present in Tully and surrounding areas. I must tell you my reason for this interest. The Queensland Housing Commission was responsible for me losing most of my roof, as I had bought a house constructed by that authority only a few years prior to that event, and their men had taken shortcuts with the ridgecapping procedures. The insurance company loss assessor involved said it was fauly workmanship. and immediately rejected my claim. It took years to resolve, and cost me dearly. We deserve better information on cyclones in this day and age. I now live 50 kms south of Lucinda , close to the beach.
Baa Humbug says: February 2, 2011 at 9:54 pm
‘No deaths no injuries thus far. In the great scheme of things, Yasi was all talk and no action. [Typical woman 😉 ]’
Oh oh, Baaa Humbug (and thinking of the Shih Tzu in front of the hair dryer) that WAS a bad move.
You’re cruising for a mulesing and wether status.
No Pass, straight to Saudi, videoed by PETA for you my freind.
Ain’t most of the posters here chaps?
Maybe the women just stand back without comment, continue raising kids and getting the washing off the line for you fellas to wear (most of us know what wind speed and the need to take in underwear) and hope to heck that they don’t have a builder and husband that OKs off the roofs (with the local inspectors) we have seen lifted off in the aerial shots of Tully and Cardwell. And NOT a husband that is dumb enough to moor their open sea-going vessel on a beachfront in front of their villa, unless he’s got insurance.
Though will be a tidy boat building economy instead of agriculture and tourism in the wake of all this.
Hope you noted that Qld State did not have insurance for public assets, unlike all the other states of Australia it seems.
http://www.theaustralian.com.au/in-depth/cyclone-yasi/states-insurance-omission-binds-pm/story-fn7rj0ye-1225999803236
And that Qld Premier’s husband (Greg Withers , CEO of Dept Climate Change or such) had a grant in September 2010 to study a ‘novel research project’.
http://www.theaustralian.com.au/national-affairs/flood-strategy-under-scrutiny-as-clean-up-begins/story-fn59niix-1225983929652
And yes, Jeff. How did your son fair? We all hope OK.
Cat 5 my a$$! 140kmph = 87mph. Whoop-di-doo. That is a Cat 1 hurricane with minimal damage.
woodNfish says: February 4, 2011 at 9:12 am
That is a Cat 1 hurricane with minimal damage.
Just browsing around for updates on Cyclone Yasi… the MSM seem to have gone very quiet after all the very scarey hype… so either its bad or not as bad as expected.
http://www.3news.co.nz/Closer-look-at-the-aftermath-of-Cyclone-Yasi/tabid/367/articleID/197021/Default.aspx
http://www.3news.co.nz/Yasi-brings-destruction-death-to-QLD/tabid/313/articleID/197166/Default.aspx
http://www.3news.co.nz/Reality-sinks-in-for-Yasi-hit-Queenslanders/tabid/367/articleID/197162/Default.aspx
Cyclone Yasi Aftermath – Ingham
[youtube=http://www.youtube.com/watch?v=EyKYjYO1pa8&w=480&h=390]
We went for a drive around Ingham after Cyclone Yasi was fully passed, and took a video. A lot of cleanup had happened already (many of the roads were semi-cleared by the time we got out with the camera).
Fortunately, most houses survived with only minor damage and the flooding wasn’t too bad. The water was turned back on yesterday (February 5) and we had power turned back on today (6th).
We’ve spent the last few days at different properties just helping people clean up… many, many trees felled, and the farther north you get, the worse it is.
For more on the cyclone including a live blog I wrote during the cyclone, check out my website: http://www.aaronm.ca
To all of you who commented on the run up to Yasi – just be glad you were not here. There is massive damage. Much much stronger winds than Larry. Very much scarier! Very many places still without power and not likely to have same for ages.
In many of the rainfall radar maps, there was a distinct gap between the southern rainfall and the northern rainfall all Wednesday in the Tully district. Where that gap was, was were Yasi came through. Wonder if if there are other radar images of previous cyclones and if they show similar “gaps” where they ultimately crossed?