UPDATE: Live The last radar image from Willis Island added below. The last radar image is truly striking.
Also, see below for the differences between the Australia hurricane scale and the familiar Saffir-Simpson scale used in the USA. They are not equal.
From Australia’s BoM, time to “get outta Dodge” as they say:

Simon at Australian Climate Madness notes this for rebuttal of the inevitable “Yasi caused by global warming” links that will be pushed on the blogs and by the press:
Tropical cyclone Mahina hit on 4 March 1899. It was a Category 5 cyclone, the most powerful of the tropical cyclone severity categories. In addition, Mahina was perhaps one of the most intense cyclones ever observed in the Southern Hemisphere and almost certainly the most intense cyclone ever observed off the East Coast of Australia in living memory. Mahina was named by Government Meteorologist for Queensland Clement Wragge, a pioneer of naming such storms.
Here’s what BoM has to say on their tracking page:
The forecast path shown above is the Bureau’s best estimate of the cyclone’s future movement and intensity. There is always some uncertainty associated with tropical cyclone forecasting and the grey zone indicates the range of likely tracks of the cyclone centre.
Due to the uncertainty in the future movement, the indicated winds will almost certainly extend to regions outside the rings on this map. The extent of the warning and watch zones reflects this.
This product is designed for land-based communities; mariners should read the coastal waters and high seas warnings.
Remarks:
SEVERE TC YASI IS A LARGE AND VERY POWERFUL TROPICAL CYCLONE AND POSES AN EXTREMELY SERIOUS THREAT TO LIFE AND PROPERTY WITHIN THE WARNING AREA, ESPECIALLY BETWEEN CAIRNS AND TOWNSVILLE.
THIS IMPACT IS LIKELY TO BE MORE LIFE THREATENING THAN ANY EXPERIENCED DURING RECENT GENERATIONS.
TC Yasi, CATEGORY 5, will continue to move in a west-southwesterly direction during the day. The cyclone is expected to cross the coast in the Innisfail area at about midnight.
Coastal residents within the warning area, and particularly between Cairns and Ayr are specifically warned of an EXTREMELY DANGEROUS SEA LEVEL RISE [i.e. storm tide] as the cyclone approaches, crosses the coast and moves inland. The sea is likely to steadily rise up to a level which will be VERY DANGEROUSLY above the normal tide, with EXTREMELY DAMAGING WAVES, STRONG CURRENTS and FLOODING of low-lying areas extending some way inland. People living in areas likely to be affected by this flooding should take measures to protect their property as much as possible, and be prepared to follow instructions regarding evacuation of the area if advised to do so by authorities.
DAMAGING WINDS with gusts to 90 km/hr that are currently developing on coastal islands, are forecast to develop about the coast by late morning and about the tropical interior overnight.
Between Cape Tribulation and Ingham these winds will become DESTRUCTIVE with gusts in excess of 125km/hr during the afternoon and early evening and VERY DESTRUCTIVE with gusts up to 300 km/hr between Cairns and Ingham during the evening as the cyclone approaches and crosses the coast. These VERY DESTRUCTIVE winds can also occur on the seaward side of hills to the north of the cyclone and are also forecast to reach the Atherton Tablelands.
Winds are forecast to ease about the east coast during Thursday morning as the cyclone moves inland.
FLOODING RAINS will develop from Cooktown to Sarina during the afternoon and then extend inland overnight.
People between Cape Melville and Sarina, extending inland to Croydon and Richmond should complete preparations quickly and be prepared to shelter in a safe place.
– Boats and outside property should be secured.
– For cyclone preparedness and safety advice, visit Queensland’s Disaster Management Services website (www.disaster.qld.gov.au)
– For emergency assistance call the Queensland State Emergency Service (SES) on 132 500 (for assistance with storm damage, rising flood water, fallen trees on buildings or roof damage).
People about the remaining tropical interior east of Camooweal and north of Winton should consider what action they will need to take if the cyclone threat increases.
– Information is available from your local government
– For cyclone preparedness and safety advice, visit Queensland’s Disaster Management Services website (www.disaster.qld.gov.au)
– For emergency assistance call the Queensland State Emergency Service (SES) on 132 500 (for assistance with storm damage, rising flood water, fallen trees on buildings or roof damage).
Name: Severe Tropical Cyclone Yasi
Details:
| Time (EST) | Intensity Category | Latitude
(decimal deg.) |
Longitude
(decimal deg.) |
Estimated Position
Accuracy (km) |
|
|---|---|---|---|---|---|
| 0hr | 7 am February 2 | 5 | 16.1S | 150.9E | 20 |
| +6hr | 1 pm February 2 | 5 | 16.7S | 149.1E | 45 |
| +12hr | 7 pm February 2 | 5 | 17.2S | 147.5E | 75 |
| +18hr | 1 am February 3 | 4 | 17.8S | 145.8E | 100 |
| +24hr | 7 am February 3 | 2 | 18.5S | 144.1E | 130 |
| +36hr | 7 pm February 3 | 1 | 19.8S | 141.1E | 190 |
| +48hr | 7 am February 4 | tropical low | 20.9S | 138.4E | 250 |
The next Forecast Track Map will be issued by 11:00 am EST Wednesday
===============================================================
UPDATE:
Commenter sHx writes:
AS of this moment Yasi is right on top of Willis Island. http://en.wikipedia.org/wiki/Willis_Island
Apparently the island has a meteorological post. It even has radar! http://www.bom.gov.au/products/IDR412.loop.shtml

It must be frightening to be that radar operator looking at this, knowing when that eyewall hits you are going to be subject to Cat5 winds and you have a 30meter tall radar tower right next to you, and there’s really no shelter elsewhere on the island and no place to go. I wonder how long we’ll continue to get a signal from the Willis Island’s radar?
UPDATE2: Just about the time I pressed “update” the radar went out, the radar station is offline. The last image from the station is above. We hope for the best for the BoM employees there. The storm surge must be ferocious. Hopefully BoM evacuated them and they left the radar on “auto”. Given the size and composition of the island versus the size of the hurricane, Willis Island may very well be erased by this storm.
===============================================================
Good luck to our friends in Queensland, especially Dr. Bob Carter and Nigel, who helped during my tour in Townsville last year.
===============================================================
UPDATE 3: Hurricane expert Dr. Ryan Maue brings to our attention the differences in tropical cyclone scales. The Saffir-Simpson scale used maximum sustained one-minute winds while the Australian Region scale uses ten-minute averaged sustained winds. The convention to convert is (10-minute)*1.14 = 1-minute sustained (units are knots). This image combined from Wikipedia’s article.

The JTWC advisory intensity at 00Z Feb 2 of 125 knots is a strong Category 4 on the Saffir-Simpson scale. The Australian Bureau of Meteorology reports central pressure of 930 hPa, and backs out Category 5 winds from that. Also, feel free to call Yasi a “willy-willy“.
Why do these big storms always seem to hit at midnight, the worst.
I’m praying for them all……
OMG! Be save!
Time to boogy Mates, this is not one to arm wrassle with.
Not much we can do to help you all at this time, but we’ll keep our fingers crossed anyway. I think my Aussie Mate Harro is right in the middle of that smash zone too; so get your A*** out of there buddy, and take the lovely lady with you.
GES
Yes Good Luck to everyone in the areas to be affected
Someone sent me this link yesterday the Hayden Walker Long range weather site at the link below
there are some amazing further links there. The page linked to is the end page, and to get back to his home page, just scroll back through the links at each page that say previous.
The practice of naming Cyclones was in fact started by a predecessor of Walker’s, Clem Wragge, who started this long range weather forecasting and that is at the second link, also from Hayden Walker’s site.
Link to Hayden Walker Page: http://www.worldweather.com.au/Meteor.htm
Link to History: http://www.worldweather.com.au/History.htm
(thanks to TonyfromOz)
Actually, if you check it right now, it looks like the radar loop has stopped. This happened within the last hour, putting it between my reminder and Anthony’s update.
And right now, there is only this message:
Radar service is currently unavailable due to:
Sorry outage information is currently unavailable.
Courier Mail in Brisbane has regular update. http://www.couriermail.com.au/news/north-queensland-braces-for-cyclone-anthony-as-cyclone-yasi-brews-behind-it/story-e6freon6-1225997552623
They reported at 10.04 AEST that the weather station may have been destroyed.
god help them all
Category 5 on the Australian Cyclone Scale, not the familiar Saffir Simpson we use in the Atlantic…
The current intensity is 130 knots (1-minute sustained), and is not forecast to increase. Yasi will likely entrain some dryer continental air prior to landfall and be at 110-120 knots, or a moderate Category 4.
REPLY: Well I learned something today. I thought the Saffir Simpson scale was universally used. I’ll have to make a note now. Thanks -Anthony
According to reports the weather station on Willis Island has stopped reporting.
New reports are estimating expected wind gusts of up to 320Kilometres per hour (200 mph)
Have a look through this graphic PDF
Cyclone PDF
Note the table in the top left hand corner – destructive power of winds in KHM.
380KMH winds and above + total destruction
Unfortunately, this will be a wet to remember. Hope all my old mates are well stocked with XXXX and Bundaberg rum.
This cyclone is much FURTHER south then the earlier Cat 5 mentioned here. The 1899 Mahina cyclone also hit a mainly unpopulated Cape York. It went southwest over Cape York Peninsula, emerging over the Gulf of Carpentaria before doubling back and dissipating on 10 March.
Further noting about Mahina it was nearly two months later. The BOM computer modelling along with the CSIRO predicted these cyclones in their modelling. A shift of a 2 degrees latitude in a modelled global WARMING world also predicted the rainfalls QLD has been experiencing.
Here it is word for word PREDICTED in climate models and QLD Government Climate Statement!
Extreme rainfall is defined as the amount of rain falling in the top one per cent of rainfall days. Projections based on 15 climate models and a medium emissions (A1B) scenario indicated that Cape York can expect up to a four per cent increase
in extreme rainfall across all seasons, and that western Queensland and the Gulf Region can expect up to a four per cent increase in summer and autumn (CSIRO & BoM 2007).
Climate change is also likely to affect extreme rainfall in south-east Queensland (Abbs et al. 2007). Projections indicate an increase in two-hour, 24-hour and 72-hour extreme rainfall events for large areas of south-east Queensland, especially
in the McPherson and Great Dividing ranges, west of Brisbane and the Gold Coast. For example, Abbs et al. (2007) found that under the A2 emissions scenario, extreme rainfall intensity averaged over the Gold Coast sub-region is projected to increase
by 48 per cent for a two-hour event, 16 per cent for a 24-hour event and 14 per cent for a 72-hour event by 2070. Therefore despite a projected decrease in rainfall across most of Queensland, the projected increase in rainfall intensity could result in more
flooding events.
http://www.climatechange.qld.gov.au/pdf/climate-change-in-queensland-2010.pdf
It is of course fine to be a climate skeptic – but if may I am in QLD right now. It’s enough to knock the skeptic out of anyone.
Climate Change skeptical extinction may be expected by 2020.
Willis Island is supposed to provide an update every 10 minutes I believe. The transmissions have apparently now ceased. Looking at the pic Anthony provided, I’m not surprised.
The storm surge would put it under water wouldn’t it ?
regarDS
Laid back aussies or the worst weather forecast ever?
http://www.australianexplorer.com/weather/innisfail.htm
“Windy later”
Good luck you guys.
Anthony,
The amount of water damage will depend on the exact time that this cyclone affects the coastline. Last I heard was that it would cross around Innisfail (83 kms south of Cairns) at about midnight.
If it accelerates slightly this would put it at the same time at quite a high tide (estimated at 2.38m at 2053 hrs for Cairns) which would be the worst case scenario.
300kmh gusts = 161 knots or 186 mph Ouch!
All of the modern houses are built to cyclone wind standards in FNQ (Far North Queensland) but coastal flooding will be a major issue. Also flying debris such as cars , trees and sharp sheet metal commonly used on roofs can damage structures that could take the wind fine without such structural damage.
The massive Burdekin dam and many others are already overflowing and the rainfall from Yasi is going to be extreme. Expect significant flooding in river systems downstream of all the full dams. My home town of Mt Isa is at the tail end – 800km (497 miles) from the coast and this will still be a category 1 cyclone when it gets there!
If it goes up into the gulf of Carpentaria it could reform…….
According to this page, the weather station on Willis Island last reported CALM conditions with wind at 0 kmh. 🙂
http://www.bom.gov.au/products/IDQ60801/IDQ60801.94299.shtml
BTW, Anthony, I can’t guarantee you this, but rest assured any living personnel on the island would have been evacuated by now.
Ross, better get prepared. The bad weather you are talking about is going to happen with or without global warming. It may come more frequently with global warming. It may also be higher intensity although high intensity is also an historical fact. So be prepared!
Ross Brisbane says:
February 1, 2011 at 3:45 pm
Piers Corbyn predicted extreme weather for eastern Oz during the period 29th Jan to 2nd Feb and he didn’t include AGW or CO2 in his calculations.
I’ve been telling friends and family of a climate shift accompanied by extreme weather for many months now. Nothing to do with CO2.
What’s happening and been happening in this part of the world is nothing new, just the 35.8yr cycle cycling away as expected. The warm waters around the eastern coast of Oz are a product of La Nina pushing warm waters in a westerly direction against the Oz and PNG coasts.
Why don’t you visit the WUWT Enso page and do a little reading before falling in line with the AGW meme. These extreme weather events would have happened with or without the extra bit of CO2.
For comparison of the scale of this Cyclone with US hurricanes scales see bottom of the page
http://www.bom.gov.au/cyclone/about/intensity.shtml
The 4 BoM employees on Willis Island were evacuated before the cyclone hit,
according to the very informative post be Les Francis.
Seems the only rational move when a storm that size washes over the site.
The rainfall from this system will be a serious blow to the area, which is already suffering from record flooding.
Co-incidentally we had a tropical cyclone heading directly for Perth less than a week ago. And in fact the remains of cyclone came directly over downtown Perth. However, the cyclone had rapidly decayed and all we got was 12 hours of drizzle with light winds.
A BoM spokeperson was on TV afterwards telling us how we had ‘dodged a bullet’. No mention of the fact their forecast of 100KPH winds was completely wrong.
Note, no implication the QLD cyclone will be a similar bust.
Nonsense, these predictions were made by models. Until the error bars get narrower I suggest we ignore them
The Courier Mail reported a few hours ago the staff were evacuated:
9.30am Wind gusts are reaching 140km/h at Willis Island off the coast of Queensland. The tiny island is in the direct path of the cyclone and is home to a Bureau of Meteorology weather station. Three bureau staff have been evacuated.
Ryan Maue says:
February 1, 2011 at 3:37 pm
Category 5 on the Australian Cyclone Scale, not the familiar Saffir Simpson we use in the Atlantic…
The current intensity is 130 knots (1-minute sustained), and is not forecast to increase. Yasi will likely entrain some dryer continental air prior to landfall and be at 110-120 knots, or a moderate Category 4.
========================================================
1 knot = 1.852 km/hr
130 knots = 241 km/hr
Hey Ross of Brisbane,
“It is of course fine to be a climate skeptic – but if may I am in QLD right now. It’s enough to knock the skeptic out of anyone.
Climate Change skeptical extinction may be expected by 2020.”
Ross a lot of readers here might not realise that although you are in Qld if you are in Brisbane then you are a long way away from this storm. I lived in Cairns for 2 years and Trop Cyclones hovered around the coast about 4 per season. Only one touched land just south of Cairns in my time. Mate, it is a weather event not Global Warming or Climate Change. It will be massive, there will be destruction and there could well be deaths. It may also not be the last one for the season which runs for a few more months yet.
The nicest, most civilized people always seem to live in the cruelest, most inhospitable climate. G’day. No worries. I’ll pray for you.
Ross Brisbane says:
February 1, 2011 at 3:45 pm
Climate Change skeptical extinction may be expected by 2020.
========
So I took a look at the linked artile and it presents a document that’s little more than IPCC and UNFCC meme.
The BOM isn’t the best at forecasting seasonal patterns let alone patterns that are decades away.
See:
Could the Australian BOM get it more wrong?
http://joannenova.com.au/2010/12/could-the-australian-bom-get-it-more-wrong/
“On August 24 the Australian BOM had pretty much no idea that any unusual wetness was headed their way. Toss a coin, 50:50, yes or no. Spring 2010 was going to be “average”, except in SW Western Australia where they claimed “a wetter than normal spring is favoured.”
What follows were 100 year floods, or at least above average rain to nearly every part of the nation bar the part that was supposed to be getting more rainfall. In the chart below, all shades of “blue” got above average rainfall. The dark blue? That’s the highest rainfall on record.”
BOM Forecasting Skill
from the same article:
Warwick Hughes linked to this unusually candid report of BOM seasonal rain forecasts (Vizard 2005).
“The results indicate that the forecasting system had low skill.”
They go on to explain just how low:
“Brier Skill Score and the receiver operating characteristic values were uniformly close to the no skill value.”
I don’t think I’ll be tendering my Skeptics badge, any time soon, based on Australia Climate Predictions.
Ross Brisbane:
“Further noting about Mahina it was nearly two months later”
Since when is March 4th (when Mahina hit), two months later than Feb 2nd?
The latitude shift is bunk, since cyclones have hit lower latitudes many times before, eg Wanda and Zoe.
Having said that, I sincerely hope you’re safe up there (I’m in Adelaide).
Ross Brisbane says:
February 1, 2011 at 3:45 pm
It is of course fine to be a climate skeptic – but if may I am in QLD right now. It’s enough to knock the skeptic out of anyone.
Climate Change skeptical extinction may be expected by 2020.
================================================
Ross, serious question
If no one had ever invented global warming/climate change….
….what would you call this?
At 1000 hrs Australian Eastern Daylight Saving Time on 2 Feb the Premier of Queensland and the 2 IC Police gave a press conference that essentially much that has been said above. The intensity is now 5 on the Australian scale. The eye is 35 km in diameter and the system is tracking slightly south of west at 35 km per hour. It was predicted to be the most severe storm to make landfall in Australia in living memory. Landfall is expected 2200 hrs AEST.
Storm surge depend on local geography and time of tides; high figues of 4 m are quoted, with 2 m expected generally. Some estimates are as high as 6 m.
The entire Cairns Hospital was evacuated to Brisbane last night, over 100 patients who were too ill for discharge.
There must be a high probability of multiple deaths. There will also be a wringing of hands over climate change. As a preamble, see
http://blogs.news.com.au/heraldsun/andrewbolt/index.php/heraldsun/comments/who_will_be_the_first_to_blame_global_warming/
Not a happy situation.
This may seem like a dumb question but as Queensland is already flooded/moisture laden is the crossing of the cyclone from ocean to land likely to be less of an impact because of the buildup of moisture on the land. In other words how does the effect of a flooded landscape affect the cyclone degenerating as opposed to a parch/dry/drought landscape?
http://www.bom.gov.au/products/national_radar_sat.loop.shtml
Willis Island is at
S 16 17 13. E 149 57 50
on Google Earth. There are a few photos.
The reef is to the northeast, but I think the winds will be coming in from the west, so they won’t help soften the impact.
I moved to SW Florida July 4th 2004. Six weeks later we had Charley, made landfall near the island of Cayo Costa, Florida as a 150 mph (240 km/h) Category 4 hurricane with a pressure of 941 mbar (hPa; 27.49 inHg) at approximately 3:45 p.m. EDT on the 13th of August. An hour later, the hurricane struck Punta Gorda as a 145 mph (230 km/h) storm. However, the eye had shrunk before landfall, limiting the most powerful winds to an area within 6 nautical miles (11 km) of the center.3:45 p.m. EDT , 15 miles north of Cape Coral where I live.
I took my mother and I to my brothers house in Fort Lauderdale across Alligator Ally the day before it was scheduled to make landfall. I went back the day after to begin repairs but my mother could not return for a week due to power outages. You do not want to mess with anything greater then a cat3, just get out. I was glad to see the sun going into a sustained solar minimum. I’ve bee going naked on my hurricane insurance the past 2 years.
Ross Brisbane, if there are enough predictions you can always find some that turn out to be true. Although I’ll note you are just assuming these forecasts are correct without checking.
FYI, I checked the BoM’s cyclone forecast for the current season
http://www.bom.gov.au/climate/ahead/tc.shtml
And see their forecast was for,
The largest increase in tropical cyclone numbers is expected to occur in the Western region, where 11-12 tropical cyclones are forecast (4-5 more than the average value of 7 tropical cyclones).
Then checked cyclone activity to date this season and found there have been just 3 Western Region cyclones.
http://www.bom.gov.au/cyclone/history/index.shtml
So while the cyclone season has still got a few weeks to go, clearly the BoM’s forecast was far off the mark and we (I live in WA) will have a below average cyclone season. As we have had for the last 7 or 8 years (from memory).
Run from the water, hide from the wind. If some authority figure tells you to evacuate, do it. If you won’t, he’ll ask for names of your next of kin. He won’t be joking.
Australian Greens Senator Christine Milne already jumped on the Yasi-caused-by-climate-change bandwagon:
http://www.abc.net.au/news/stories/2011/02/01/3127184.htm?section=justin
Some people are simply an embarrassment to the species.
Re Willis Island: I was under the impression there were 5 people on the island, and 3 have been evacuated, with 2 remaining. Could be wrong.
All safe and prepared here (near Sarina- on southern edge of gale force winds, so not in any danger), but ready to clear out if it heads south. Best wishes everybody.
“Monster cyclone knocks out weather radar
By Kim Lyell
Category five Cyclone Yasi has knocked out the weather bureau’s radar system on Willis Island, about 450 kilometres east of Cairns in far north Queensland.
The weather bureau’s radar and wind speed measurements on the island failed just before 9am (AEST).
The bureau says the maximum wind speed recorded before the equipment went down was 185 kilometres an hour.
Three weather observers and a technician left the island yesterday.”
http://www.abc.net.au/news/stories/2011/02/02/3127757.htm?section=justin
Poor old Innisfail — it copped a shellacking off Cyclone Larry in 2006, and has slowly been rebuilding over the past 5 years, and it looks as if it’s going to get flattened again.
I was in Cairns when Larry hit, i.e. about 100kms away, and that’s as close I ever want to come to one of these frightening weather events.
Praying that everyone stays safe.
If I’m not mistaken, there aren’t many roads in that part of Australia. Good luck getting out.
John Silver says:
February 1, 2011 at 4:41 pm
http://www.bom.gov.au/products/national_radar_sat.loop.shtml
======
Rain bands hitting Townsville and just off shore in Cairns:
http://www.bom.gov.au/products/IDR213.loop.shtml
http://www.bom.gov.au/products/IDR193.loop.shtml
Rain bands in Bowen and Mackay:
128 km Bowen Radar Loop
http://www.bom.gov.au/products/IDR243.loop.shtml
128 km Mackay Radar Loop
http://www.bom.gov.au/products/IDR223.loop.shtml
It looks like Yasi will dump a lot of rain in the Lake Eyre catchment and we may see the highest recorded level in Eyre (1974) exceeded.
Although to give you an idea of how much water that will require.
The highest recorded level in Lake Eyre was in 1974 but it would take the average flow of Australia’s largest river, the Murray to maintain that level. The Danube River would fill Lake Eyre to the 1974 level in forty-five days; the Mississippi in twenty-two days, and the Amazon in three days.
Hi Ross from Brisbane this is Carrie from Qld. You are new here. Good on ya mate. If you keep coming back and reading the many scientific articles here, plus visit all the blogs linked and listed, you might change your mind. That is of course, if you have a true scientific curiosity and if you are not a person who is benefitting financially via your job or business from the global warming agenda, and/or are not a member of the church of green.
twawki says:
February 1, 2011 at 4:40 pm
This may seem like a dumb question but as Queensland is already flooded/moisture laden is the crossing of the cyclone from ocean to land likely to be less of an impact because of the buildup of moisture on the land. In other words how does the effect of a flooded landscape affect the cyclone degenerating as opposed to a parch/dry/drought landscape?
=========================================
I’ve forgotten the name, but one recent hurricane in Florida strengthened in the middle of the state.
It crossed south Florida from west to north east, and strengthened when it got over the water in the Everglades, in the middle of the state.
Brisbane Times
Too late to leave: drivers told to stay put
Tony Moore
February 2, 2011 – 11:32AM
http://www.brisbanetimes.com.au/environment/weather/too-late-to-leave-drivers-told-to-stay-put-20110202-1ad2f.html
“Police have urged “frantic” motorists trying to escape Cairns that it is too late to try and outrun Cyclone Yasi.
“Heading south on the highway to outrun the cyclone, it is probably too late for that now,” Regional Traffic Co-ordinator Inspector Robert Waters said.
“Basically if you haven’t already left Cairns, if you haven’t worked out a specific destination within a reasonable driving distance, you have probably left it too late and we suggest you go to the shelters that are advertised by the councils.”
By good fortune I took a copy of the Willis island data to PDF just before is went down.
This appears to show the eye of the cyclone, amazing. If it is valid.
Quickly thrown up this page with a link to the PDF.
http://daedalearth.wordpress.com/
Philip Bradley
I am not a BOM “basher” by this cherry picking. Neither am I a CSIRO basher. Where’s that leave you? I do not expect you to think as I do. I do you expect you to be a true sceptic of climate change, keep an open mind to all flows of information and not shut out what you find maybe an unacceptable reach of your understanding.
I do not like cherry picking – read the ENTIRETY of QLD Climate Change Report – it is not only factual, but gives EXTRAORDINARY insight into what climate and type of climate changes QLD will transition into within a global warming context over the next decade.
It also clearly instructs one to better plan their housing location, be selective about the type of house, (an insurance evaluative position, policy and protection) and other named events that QLD will absolutely transition into over the next coming decade.
The key to all this all is not government and political issue but you and me – the daily citizen being able plan with known parameters of foresight rather then hindsight.
The State Government gave an excellent report – it is worthy of anyone reading it for their own well being, to protect their families and plan a better lifestyle with harmful catastrophic event minimisation.
Stay safe in Australia … but other places too.
Apparently the US is in for a blast from the weather. It was 30 below in Alberta yesterday. There is a huge jet stream mvoing south to Texas right now and affected flights in Texas today. Tonight and tomorrow it will be worse. On the west side of the jet stream it is warm – it was plus 4 C at my farm and 100 km east in Red Deer it was 21 below C today.
The jet stream goes straight south to Texas and then turns north picking up moisture from the Gulf to mix with cold air. Our local weather forecast said there could be 30 cm of snow from a bit east of the Rocky Mountains all the way to Chicago, from Texas to the Canadian border, with 15 to 20 cm on the east coast and tornadoes in the south east. A nasty big weather system covering most of the eastern US and Canada.
The northern jet stream has really been doing its meandering thing this year.
Good luck to all of you in unsettled weather. Stay off the roads.
A ham operator friend in the south pacific helping with civil defense said one cyclone he helped out had greater than 230 km/hr winds (142 mph) – because that was when the anemometer blew away!
His rule of thumb to keep metal sheeting on was to use 7 bolts per square meter!
It was recommended for those who decided to stay for Katrina, they should use a permanent black marker to write on their torso their name and ID number so the cleanup crews can identify the body. Turned out to be good advice.
As I commented on Jo Nova’s site:
You have my prayers, for all they are worth. (hope much). Only God and good luck, can save us from natural variation. Well that and a little common sense. I’m in the middle of the Snowmageddon, here by Chicago, and the MSM may be worse than the storm. Why do they always seem to send idiots out to stand in the midst of the sort-of storm. Law of Averages would suggest a person, occasionally, would appear. Hope we all make it through.
Jim
Thanks Latitude 🙂 so water on land does have an effect – particularly warm water as it starts to mimic the same forces over the ocean.
Second question if cyclones/hurricanes take heat out of the ocean (with Yasi I would assume this would be a significant amount of heat) then how does that affect the current La Nina where the warm waters are pushed west to Australia – does the cyclone strengthen it or weaken La Nina and the flow of warm water?
In recent days SOI figures going up again.
Hey Phillip B yeah Lake Eyre already has a bit of water in it. Any more water in the Lake Eyre catchment will further fill it. As the land is already soggy then runoff we be increased. With Lake Eyre moving to being at least part full year after year then how does that affect our climate in the eastern states? Are we on a decadel (PDO) cycle of increasingly wet feedbacks (which would be further increased with Svensmarks theory) of increased cloudiness due to a quiet sun?
Lake Eyre satellite
http://www.lakeeyreyc.com/Status/latest.html
Lake Eyre basin is 1/6th the area of Australia – this rain band from the cyclone will need to get inland to affect it which is what the weather services are predicting.
http://www.lakeeyrebasin.org.au/
http://www.weatherzone.com.au/synoptic.jsp?d=3
Ross Brisbane,
The Queensland Climate Change report key findings,
increased flooding, erosion and damage in
coastal areas due to increased numbers of severe
tropical cyclones and sea level rise
cyclones occurring further south
reduced rainfall across most of Queensland
longer dryer period
difficulty in supplying water to meet urban and
agricultural demand due to decreasing rainfall
and runoff
As far as recent events are concerned, all of these predictions are wrong. Note, the first prediction is that due to increased numbers of severe cyclones. And this year has had a below average number of cyclones across Australia, severe and otherwise, and sea levels actually fell in 2010.
It’s interesting that a Global Warming believer can read this report and see its predictions coming true, when a neutral observer, such as myself, sees predictions that are hopelessly wrong based on recent events.
“… and there’s really no shelter elsewhere on the island and no place to go…”
Ryan, one must hope they designed a safe bunker for this kind of event.
+++
Ross from Brisbane: ” … it is not only factual, but gives EXTRAORDINARY insight into what climate and type of climate changes QLD will transition into within a global warming context over the next decade.”
Before buying into equaling climate change and global warming, you should first understand the mechanisms of atmospheric circulation. May I suggest you acquaint yourself with this paper first:
Leroux, Marcel (1993). The Mobile Polar High: a new concept explaining present mechanisms of meridional air-mass and energy exchanges and global propagation of palaeoclimatic changes. Global and Planetary Change 7, 69-93.
http://ddata.over-blog.com/xxxyyy/2/32/25/79/Leroux-Global-and-Planetary-Change-1993.pdf
Read and understand that the meteorological changes that we see since the 1970s are in fact debunking the global warming theory and indeed shows there is climate change but in a very different way. And please do not come back with HadCRUt or GISS stuff since we all know this is manipulated crap.
Fortunately, the four BOM staff were evacuated form Willis Island yesterday.
Fingers crossed for the best possible outcome.
Ross Brisbane says:
February 1, 2011 at 3:45 pm
Climate Change skeptical extinction may be expected by 2020.
Please don’t confuse ‘climate change skepticism’ with ‘anthropogenic climate change skepticism.
The climate has been changing, for better or worse for life on earth, for many thousands of years; the argument relates to the size and scale on Man’s effect on climate.
If you are going to post here, please be careful with the terms you use as generalisations add nothing to the discussion.
I am, thankfully, in Adelaide and trust that all in the path of this cyclone remain safe and well.
I’m in Brisbane, the recent floods got almost to our door eight hours before the flood max then mysteriously rose only another 200 mm or so, leaving us dry. My son left Cairns Base Hospital – on the bay, likely to be flooded, evacuated yesterday – to move to Royal Brisbane in the short space between our floods and their cyclone. Good timing.
The general drift of commentary I’ve seen here is (a) it’s impossible to say whether or not AGW/climate change is a factor in the current weather and (b) we’ve had regular cyclones throughout recorded history.
Some commenters/researchers are noting the effects of El Nino and La Nina climate cycles that affect weather in Eastern Australia, as well as the impact of the Pacific Decadal Oscillation, and defining 20-30 years cycles of high/lower cyclonic activity. It would appear that such patterns are not obviously related to any global warming. cf Mark Lawson, AFR, 21/1/11.
The current cyclone is expected to cause much greater damage than Cat 4 Larry five years ago, partly because of its greater intensity and spread and partly because it will hit towns with larger populations – 160,000 in Townsville – on flood plains which are already saturated and exposed to sea surges which might be up to 4 metres.
Aynsley Kellow says:
“Fortunately, the four BOM staff were evacuated form Willis Island yesterday.
Fingers crossed for the best possible outcome.”
LOL! You sly fellow.☺
I am seeing the absolute disgust at the global warming crowd with the current winter storm. I will not give you the link to the Huffington Post article on the storm, but the comment section, with comments like, “I have to shovel that damn global warming out of my driveway again, and the warmers hearing that comment from their neighbors again and again”, are getting a bit hostile. While we here at WUWT are expected to temper our rage, I fear the normal people will not temper their rage as much as we do. My radar is up for some major hostility on the issue.
Apparently the island has a meteorological post.
I think that should read “Apparently the island had a meteorological post.”
It was just reported in the Queensland premiers update that all the equipment has stopped sending data, it looks like it was wiped-out. Fortunately the 4 employees had already been evacuated.
That’s strange. Weather dot com doesn’t seem to have anything dire in the forecast for Townsville. http://www.weather.com/weather/tenday/ASXX0117
Sorry Smokey, but your humour escapes me.
To quote Manuel in Fawlty Towers, ‘Que?’
Hope all are settled in and properly prepared for this storm. At this point the die is cast for all those in the direct impact area.
I had the rather interesting experience of riding out a super typhoon in 1971 on board ship near Guam MI. It certainly got my attention. These storms occur naturally and do not need any “global warming” to form periodically.
Super Typhoon Amy (Etang) Duration April 29 – May 7 1971
Intensity 280 km/h (175 mph) (1-min), 895 hPa (mbar)
Larry
Now 295 kmph. Tracey 1974 Darwin blew the anemometer off at 280 kmph. My husband was in Darwin in Tracey – he cant watch what is happening. His helicopter was one of only two aircraft unscathed at Darwin Airport out of about 100. He says much of the damage in Darwin was the mini (as in small in size, not ferocity) cyclones within the system. A house gone, the one next to it unscathed.
In case you think that cyclones are predictable, here is a 2007 spaghetti map from the Australian Bureau of Meteorology showing the tracks of past cyclones:
http://i260.photobucket.com/albums/ii14/sherro_2008/CyclonesBOM.jpg
Next, here is a National Geographic Map reproduced with permission, for the more severe cyclones 1974-2006.
http://i260.photobucket.com/albums/ii14/sherro_2008/CYCLONESNATGEOG.jpg
The present concern, Yasi, is approximately on the same path as Larry (2006) on this second map.
The 3 features that engage me are –
(a) The cyclones often track well out to sea, then do a 90 degree left turn and head for the coast; and
(b) the systems often cross the coastline at right angles, on a large scale of resolution; and
(c) there are many cyclones whose paths are shown to continue over dry desert land for 2000 km or more, especially in West Australia. How?
BTW, Ross Brisbane who blogged above, the recent, severe Brisbane floods were not particularly related to the statement “Projections indicate an increase in two-hour, 24-hour and 72-hour extreme rainfall events for large areas of south-east Queensland, especially in the McPherson and Great Dividing ranges, west of Brisbane and the Gold Coast.” The Toowomba floods were possibly attributable to such a statement (only further time will validate or invalidate the forecasts); but there is a sharp mountainous divide between Toowoomba and Brisbane. The rainfall from the quote heads generally west. The flooding of Brisbane was largely flowing east from rain within the fairly small Brisbane basin, which is perhaps too small to model on a National basis. FWIW, the Toowoomba catchment is quie tiny as well. Maybe the problem in Toowoomba was enlarged by people building structures like the rail yards in old watercourses.
Back to Cyclone Yasi, the town of Innisfail in its path is usually wet. Average Dec-Feb (summer) rainfall is 450 mm or 17 inches, Mar-May (autumn) is 480 mm or 19 inches. It might help that the town is engineered to take high rainfall, to some extent.
Not as good as John Silver’s but here are a couple more.
MTSAT visible (stationary): http://www.goes.noaa.gov/FULLDISK/MTVS.JPG
MTSAT infrared (stationary): http://www.goes.noaa.gov/FULLDISK/MTIR.JPG
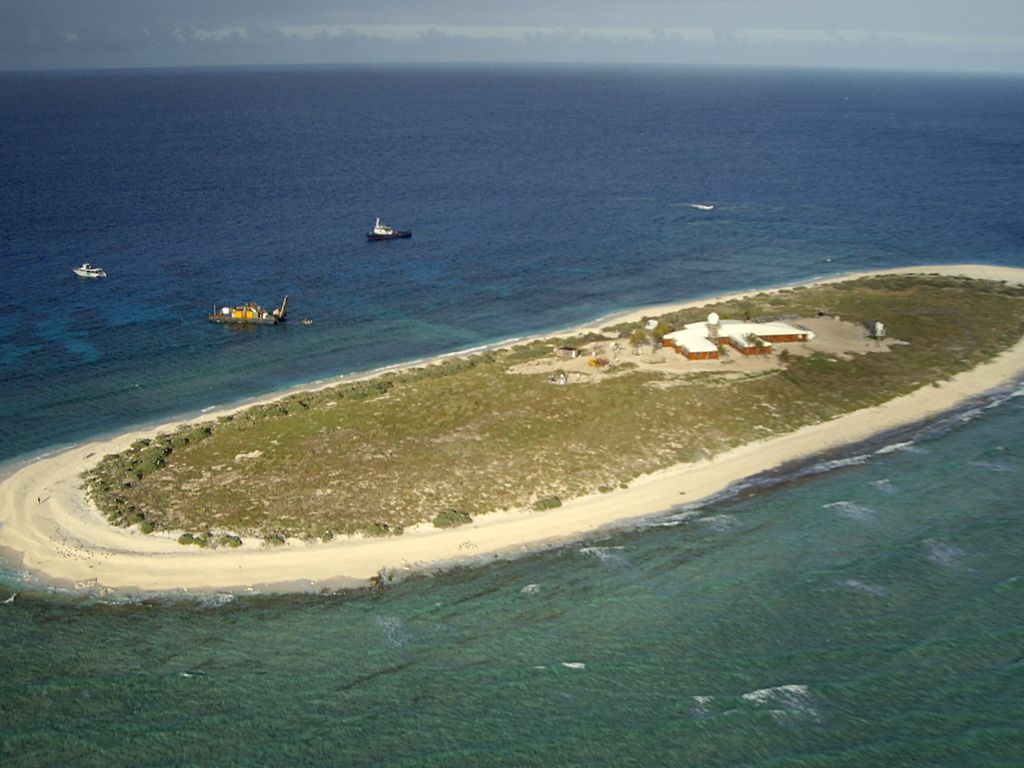
Since this thread brought it to my attention, I thought I’d look up the BOM data for the Willis Island station. It appears to have been there since the 1920s, though there have been some gaps. The picture Anthony found certainly implies that there should be minimal UHI impact on the data.
Looking at the maximum temperature figures, there doesn’t seem to be much of a trend:
http://www.bom.gov.au/jsp/ncc/cdio/weatherData/av?p_nccObsCode=36&p_display_type=dataFile&p_startYear=&p_c=&p_stn_num=200283
But the minimum temperature figures should a strong upward trend:
http://www.bom.gov.au/jsp/ncc/cdio/weatherData/av?p_nccObsCode=38&p_display_type=dataFile&p_startYear=&p_c=&p_stn_num=200283
I found that interesting, but I’m not sure what it means.
Yikes – I’ve got folks sitting right in its path. They’re off the coast of Townsville. Waiting for an email back as I write.
Hopefully, it’ll be just an interesting eyewitness account, rather than a tragedy.
Wind, pressure, temperature and humidity data from the Automatic Weather Station that BoM has in Willis Island can be seen at
http://www.bom.gov.au/jsp/watl/weather/obs.jsp?graph=all_obs&station=200283
It seems that wind anemometer and vane are now broken after reporting a maximum wind gust of 100 knots!!! The fall of the pressure is so dramatic, as well.
[youtube=http://www.youtube.com/watch?v=ML9h3I5Uktw&w=480&h=390]
This is Australia
Wow! The central pressure is an amazing 938!
http://www.bom.gov.au/products/IDQ60801/IDQ60801.94299.shtml
This is a deep, deep low. I can’t remember such a deep low in a TC.
Oh, and from the radar image that Anthony caught, you can see the eye of the storm is about 50km wide. That also is huge.
From a commenter at Jo Nova’s site, here’s a live webcam view of this storm approaching (now) which could be amazing to watch over the coming hours and days:
http://www.gorgecreekorchards.com.au/
According to a comment on Jennifer Marohasy’s blog:
Just asking, but how does anybody know what the wind speeds are? 295 km/hr? Where was that measured and how was it measured? If it was measured from the air, how do we know what the speed at sea level is?
Willis island, the only weather station in the cyclone path, reached 185 km/hr gust, 140 continuous, very close to the eye wall. That is extreme, but there is a huge difference still between that and 295.
To Graeme W
You are correct, the data from Willis Island should have the lowest error bands of possible temperature measurement error over a reasonable historical period.
It is a small island with no UHI. Also, note the narrow temperature range between min and max on a daily and yearly basis. That means less stress on the thermometer measuring system, regardless of the thermometer used, hence less frequent calibrations needed.
Their temp data should be some of the most reliable in the world.
Philip Bradley
Mate your far from being neutral.
The drought intensification is coupled to stronger then normal El Nino events driven by increased ocean temperatures.
The rain intensification is coupled to stronger La Nina events driven by ocean turn over of surface energy heat descending into the cooler depths and the uprising of colder oceanic in a process of climate equilibrium.
The models predict in a warming globe extreme events at both ends of the scale. The report was die accurate!
The US for example is experiencing extreme events. The snow represents climate shifting and on the move. That snow and ice got into the atmosphere in the first place by the earth’s climate storing more energy from the sun. Its “solar cells” gathering this extra energy is the minor radiative CO2 forcing. There is a strong correlation. Very strong. Models many of them produce and can predict these bizarre weather patterns as climate shifts in real time. We depend on the observation as much as we do when we warn of catastrophe through climate modelling.
Water vapour on the move and in many forms is sign of a warming globe producing bizarre out of the ordinary aberrant climate.
It was predicted along with the drought durations intensifying and the rains intensifying in 24 to 36 extreme events. It also clearly shows in the document to avoid flood areas when considering building or re-locating.
The QLD report is the most practical document I’ve ever read as it applies to my daily quality of life and our climate. Only a fool would ignore such information.
The records are accurate and I am no new kid here in regards to BOM historical data.
Cherry picking is another thing. Oh its snowing, drought or raining or flooding – all these are of course climate on the move.
It is obvious where I stand on this issue – and those of us who are convinced – do not need to be babied by cherry picked data.
Ross Brisbane says:
February 1, 2011 at 3:45 pm
===========================
Nonsense! You are falling into the trap: “the climate models predict….”
The disastrous and tragic weather events in Queensland this season are related to a VERY strong and unrelenting La Nina and, see here, the highest Southern Oscillation Index reading in 92 years.
http://www.guardian.co.uk/world/2011/feb/01/cyclone-yasi-head-towards-queensland-australia
Stay safe there mate. You ‘stralians are made of steel…and you will rebuild after any disaster, I am confident.
Chris
Norfolk, VA, USA
Ross Brisbane says:
“It is obvious where I stand on this issue – and those of us who are convinced – do not need to be babied by cherry picked data.”
==============================
Yes it is quite obvious where you stand.
As to the UNconvinced.
Many of us will not be “babied” by cherry-picked model outputs…model outputs that [still] have NO grasp whatsoever on the extremely complex and chaotic nature of climate.
Sorry mate.
You wanna put forth a fantastic theory….then the BURDEN of proof, rests solely upon you.
Let’s see it.
Chris
Norfolk, VA, USA
Graeme W says:
February 1, 2011 at 7:34 pm
Graeme what that info tells me is that the weather of Willis Island is totally controlled by the tropical ocean it resides in.
As such, one would expect very little variations in Ts. The highest min. Ts are during the strong El Nino years of 1998 and 2010. the very narrow T range is also consistent with that.
A plot comparing SSTs of the area to Willis Island Ts should confirm that.
Ross Brisbane
So, Ross, the BOM bring out a Report “sort of” predicting more rainfall at the end of October 2010, when the forming La Nina was obvious and the rains had already started to fall.
How clever of them.
Here is a link to what they were predicting for now, back in 2007.
http://www.csiro.au/news/ClimateChangeInAustraliaReport.html
Here is a link to what they were predicting for now, back in 2008.
http://www.daff.gov.au/__data/assets/pdf_file/0007/721285/csiro-bom-report-future-droughts.pdf
Here is a link to what they were predicting for now, back in 2009.
http://www.bom.gov.au/inside/eiab/State-of-climate-2010-updated.pdf
Here’s a heads-up Ross. Try a simple word count in each document on the words “drought” and “flood”.
You wouldn’t happen to be a recent arrival here from Sydney or Melbourne would you Ross?
OT and in another hemisphere and season….check out the University of Chicago webcams right now.
http://ctscam.uchicago.edu/view/
http://buscam.uchicago.edu/view/index.shtml
Michael says:
February 1, 2011 at 4:42 pm
if u want… go to another planet
where there aren’t cyclones, droughts, what ever…
The last returns seem to show that Yasi is undergoing an ever so slight intensification phase?
Am I wrong or is that dry air “outta there” and we are looking at a more concentric CDO?
http://www.wunderground.com/tropical/tracking/sp201111_sat.html#a_topad
Chris
Norfolk, VA, USA
Ross Brisbane,
While certainly Yasi will be “a good blow” in FNQ terms, and there will be a lot of heartbreak and clen-up afterwards – this is not unusual.
I recently was heartbroken to leave FNQ after 10 years (job reasons), but the recent cyclone seasons have been very quiet – Larry in 2006 was the only stand-up performer doing the regular 30 year odd run of flattening Innisfail.
You may be from Brisbane (or even further south in the past), however I grew up and lived in SEQ and the far north for 40 years – none of the recent flooding (15 years in Toowoomba too) is “unprecedented”. Particularly the Toowoomba creek flooding – I remember them being just as high-running during major storms about 25 years ago, the difference this time is the short-term memory of elected officials building parks and bridges, narrowing the normal watercourse and creating the ideal environment for a fast-running flash flood.
I suggest studying the yearly records of BOM data for FNQ, neither the rain or the frequency of cyclones has changed at all. The extraordinary claims from some representatives of BOM and CSIRO require extraordinary evidence to back them up – and it’s not there.
Cheers
Looks like an eyewall replacement cycle, too.
~Chris
To Baa Humbug
Sure, yes, it is a proxy for SST.
However, the Willis Island data is a better absolute temperature measurement for SST than historical SST data made of the water itself.
Historical SST data is fraught with errors, comprising of a lot of data by taking a bucket of sea water up from the sea and sticking a mercury thermometer in it…
And recent satellite measurements are OK for yearly temp difference magnitudes, temp differences from one location to another, comparisons, if you will, but not for absolute measurement (I have a 20 yr professional background in IR temp measurement).
Willis Island type data is about the best you can expect to get over a near 100 yr period.
Addendum..
Price of bananas will skyrocket again though…. Maybe the trees replanted along the North NSW coast after Larry in 2006 are producing enough now….
Here’s wishing and hoping all the best for the residents of Townsville, OZ. Looks like a beautiful place. God be with them.
Chris
Norfolk, VA, USA
Ross Brisbane,
Here’s the tropical cyclone trend 1970 – 2005:
http://www.bom.gov.au/cyclone/climatology/trends.shtml
La Nina is the reason.
During 1974 queenland was devestated by floods from ex TC’s Wanda and Zoe and then of course the big one – TC Tracey hit Darwin on Dec 24. All of this weather was linked to a strong La Nina.
With the strong La Nina now it was almost inevitable that a big TC would develop. Let’s just hope that Yasi misses the major population areas.
Strong La Niña event persists in the Pacific
Issued on Wednesday 2 February 2011
Australia continues to feel the effects of one of the strongest La Niña’s on record.
http://www.bom.gov.au/climate/enso/
The Flinder’s Reef station is still reporting every 30 minutes (then a few minutes for data upload to the website).
http://www.bom.gov.au/products/IDQ60801/IDQ60801.94290.shtml
Here is the map of stations to retrieve current measurements.
http://www.bom.gov.au/qld/qld-observations-map.shtml
savethesharks says:
“Here’s wishing and hoping all the best for the residents of Townsville, OZ. Looks like a beautiful place. God be with them.”
That says it for me, too. There are no folks I admire more than Australians. It wouldn’t bother me at all if they ruled the world.
Smokey says:
February 1, 2011 at 10:01 pm
That says it for me, too. There are no folks I admire more than Australians. It wouldn’t bother me at all if they ruled the world.
===========================
Agreed. They are tough as nails.
Chris
Norfolk, VA, USA
OT again but look at what Nature can do and how our species (even with our tech advances) can STILL be so stupid:
From Chicago NWS:
… Blizzard creating life threatening situation for motorists…
Reports from media and local law enforcement officially indicate
that hundreds if not thousands of vehicles have gone off the
roads. The governor has activated the National guard who are
currently rescuing stranded motorists.
The blizzard conditions will continue tonight… particularly in
open areas where white out conditions will make travel
impossible. Local law enforcement officials are telling people to
stay off the roads as not a single Road is passable in rural and
open areas. They are asking people to stay in a safe place and not
to leave home tonight.
This is a potentially life threatening situation. Do not travel
unless absolutely necessary overnight.
Here’s the latest webcam from the University of C:
http://buscam.uchicago.edu/view/index.shtml
Wow.
Chris
Norfolk, VA, USA
Good luck Oz. Kiwi’s are praying for you.
savethesharks says:
February 1, 2011 at 10:10 pm
Thanks guys (from someone who felt he was born an Aussie, but in the wrong country, but has now rectified the matter permanently). I agree totally.
As I a guest here as well as a AGW supporter of the science I will be very brief:
1. I was born in QLD
2. I lived on a farm as a boy close to Grantham Lockyer Valley – yes that’s one that was flooded by an extraordinary event.
3. My background is in data mining – I.T. some 35 years.
From a poster this was put to me:
“I suggest studying the yearly records of BOM data for FNQ, neither the rain or the frequency of cyclones has changed at all. The extraordinary claims from some representatives of BOM and CSIRO require extraordinary evidence to back them up – and it’s not there.”
No – I have no need to “study” the data – spent three to two years looking at all information before I moved from sceptic to acceptance of AGW laws of physics and its how it affect climate.
One line of evidence referenced here:
Climate change
”Projections (computer models) also indicate that the regions of east Australian cyclone genesis could shift southward by two degrees latitude (approximately 200 km) by 2050, Leslie et al (2007), while the average decay location could be up to 300 km south of the current location. Models estimate that the number of strong cyclones reaching the Australian coastline will increase, and ‘super cyclones’, with an intensity hitherto unrecorded on the Australian east coast, may develop over the next 50 years Leslie et al(2007). From same references already cited FYOI.
The above is just one paper from Leslie – suggest to anyone they follow this thread of this information and look into – you may end up becoming a non-skeptic at the end of the process. Just like the weather channel man who once was a skeptic.
The onus is not on me to prove to you the ultimate strike out.
The onus is on me to show WHETHER ANY of these events were already stated in any science based literature with a link to AGW as a plausible cause WAY before these events.
The onus is on you (your thinking) to show alternatives to these extraordinarily events. Even so you should consider the relevance of the source and the professional background and leave nothing to chance on fringe opinion and quackery science.
A simple statement on tropical cyclones in Qld.
http://www.bom.gov.au/cyclone/about/cyclones-eastern.shtml
“…There have been 207 known impacts from tropical cyclones along the east coast since 1858. Major east coast tropical cyclones impacts include 1890 Cardwell; 1893 Brisbane; 1898 NSW; 1899 Bathurst Bay; 1918 Innisfail; 1918 Mackay; 1927 Cairns and inland areas; 1934 Port Douglas; 1949 Rockhampton; 1954 Gold Coast; 1967 Dinah, Southern Queensland; 1970 Ada, Whitsunday Islands; 1971 Althea, Townsville; 1974 Wanda, Brisbane; and 2006 Larry, Innisfail…”
About the 130km further south reference – note 1954 Gold Coast, 1967 Dinah, 1974 Wanda – please also remember that 1974 Wanda caused the flooding in SEQ in the same year.
And that is not a complete list of cyclones for SEQ (1,800km south of Cairns for non-Australians) – try 1972 in this list.
http://www.windworker.com.au/qldcyclones.htm
“…8-9 January, 1972. CYCLONE BRONWYN. Moved southwards throughout the State causing serious flooding isolating some towns.
11 February, 1972. CYCLONE DAISY. Hit Fraser Island. Over 200 homes damaged at Pialba and other areas. Severe flooding to the Gold Coast where a peak swell height was recorded at 8.3 metres.
2 April, 1972. CYCLONE EMILY. Crossed south of Gladstone. 8 people lost at sea in huge waves.
…”
Or cyclone Zoe in 1974 that crossed at Cooloongatta – you can’t get any further south before you’re in NSW.
Lastly – in case you still think that the 70’s were caused by rising Co2 – try 1864 and 1867 in Brisbane.
Whoever wrote about the storm track moving 130km further south was making a *very* safe bet.
The biggest storm SINCE 1918 !!
….. when we know that there were HUGE amounts of human caused CO2. 😉
Oh Ross, do you have any data on cyclones BEFORE 1899, Please.
“FNQ-formerResident says:
February 1, 2011 at 9:24 pm”
And don’t forget council planners, while beautifying Tawoomba, ignored advice from engineers about increasing the size drains/pipes to use in their flood easments.
Ross Brisbane,
Try reading some history of Australia and it’s weather, the odd hundred years or so of it. Then try to tell us again that it is all our fault with facts. An old Aussie.
“Ross Brisbane says:
February 1, 2011 at 10:45 pm”
How does your acceptance of AGW stand up against statements from authorities which claim the drought in WA is not related to AGW, but the floods in QLD are? If AGW is to be believed, via the emissions of CO2 only, then all events, globally, would be attributed to AGW. It appears this is not the case.
Ross Brisbane you sound excited, veritably LEAPING out of your skin with delight.
You could at least have the decency to wait until it’s all over before favoring us with your expert analysis.
Technical brief issued by BOM at 6:33 UTC.
It would certainly be nice if we had more data about climate history in Australia.
Methinks many towns on the coast may not have been built where that are !
God help us all.
And God help the mothers with little children – may He be with them.
Is this beginning of what’s normal cycles and events?
I respect old timers but please you just stop this and remember and say that little prayer with me.
I hope by a miracle your all correct you folk who don’t seem to accept that the globe is warming and will continue to warm beyond this century. Its cause is DENIED by some of the people of this planet. We still cling to fossils for our quality of life.
And we exonerate the climate records just like those fossils and just prattle it out – its happened before.
When we enter the next four years I wonder – I really do.
God help us all.
Some very pretty graphics to put Yasi in context. Wry amusement at the reporter’s claim that only Australia and Australians are big enough to ride out the storm.
http://www.news.com.au/breaking-news/floodrelief/how-cyclone-yasi-compares-around-the-world/story-fn7ik2te-1225998762870
Poor Ross,
Since you seem unable to reply with data before the 1918 cyclone, seems you are unable to prove that this is anything more than a 1 in 100 year event..
Surely as a “data minor” you can do better than that ??
Keep your eye on the land path of this beast, if it tracks North past Mt Isa and heads North, it could re-form in the Gulf of Carpentaria. It has happened before from a Coral sea cyclone origin http://australiasevereweather.com/tropical_cyclones/bom_2000_2001_australian_region_tropical_cyclones.htm
Ross, you said “The rain intensification is coupled to stronger La Nina events driven by ocean turn over of surface energy heat descending into the cooler depths and the uprising of colder oceanic in a process of climate equilibrium.”
Ross, with all due respect, that is just gibberish.
Then you said “The US for example is experiencing extreme events. The snow represents climate shifting and on the move. That snow and ice got into the atmosphere in the first place by the earth’s climate storing more energy from the sun. Its “solar cells” gathering this extra energy is the minor radiative CO2 forcing”
That is wrong. The snow events, like those of the 60’s and 70’s are due to negative Arctic Oscillation that forced cold air and cold upper lows further south. Other weather factors are involved. The slight warming from CO2 adds energy to the warm sector of the storm which really doesn’t affect it much, nor its creation, nor its track.
The best thing for you to do is put aside your appeals to selected models and read the more general papers about models. They mostly predict more positive AO, not negative, and weaker arctic outbreaks, not stronger. The most general conclusion is that extreme weather is mostly natural and any strengthening of weather events (e.g. strong water cycle) is a negative feedback to the CO2 warming.
A live blog of the approach of Yasi from the ABC. I’m hoping this will be less intense than it’s being reported.
http://www.abc.net.au/news/events/cyclone-yasi/
http://cairnsweathercam.com.au/weather-display-live.php
Professor Jonathan Nott, from the Australasian Palaeohazards Research Unit at James Cook University, said: “We’ve been lulled into a false sense of security in Queensland because we’ve been through a fairly quiet time of cyclones since the 1970s.”
Senator Christine Milne get the idiot award for a Climate Change blame comment , as far as I know shes the first..but others will follow.
ABC radio has online radio if any of you care to listen, people are calling in and reporting, powers out to a lot of spots from this arvo, winds were 100k then, expected to get worse.
Palm Islanders appear to have not evacuated in spite of days of warnings.
R Brisbane…hes a serial pest on any sites that express any agw disbelief.
figures he’d show here sooner or later:-(
Ross from Brisbane, you say you are not cherry picking and I understand the point you were making about Cyclone Mahina being much further north than Yasi and it was two months difference in time therefore the point you seem to have drawn is that this cyclone crossing the coast near Ingham is further south and therefore somehow due to AGW.
Why then did you not look at the 1912 cat 5 cyclone that crossed the coast at Mackay (much further south) on 21 Jan 1912? This would seem to run counter to the single point inference that you have drawn re Mahina.
Ross, I am also from Qld, grew up on a farm near Mackay, and have also been in IT for 33+ years, I don’t see how this gives either me or you special abilities to draw the conclusions that you have other than you are allowing your biases to drive your logic.
Now I am as guilty as you in using a single data point to make a case, except I am not trying to disprove sceptics with my logic, I am trying to see a pattern and unfortunately the data points you have provided in IPCC and other alarmist summaries do not support the points you make.
Regards
Greg from Brisbane
10:50 pm. Looks like one of my favourite areas South Mission Beach will be in the eye of this cyclone. I spent many days at the caravan park there during my “grey nomad” times. Hope all have been evacuated.
See radar here http://www.bom.gov.au/products/IDR192.loop.shtml
@-Faustino aka Genghis Cunn
“Some commenters/researchers are noting the effects of El Nino and La Nina climate cycles that affect weather in Eastern Australia, as well as the impact of the Pacific Decadal Oscillation, and defining 20-30 years cycles of high/lower cyclonic activity. It would appear that such patterns are not obviously related to any global warming. cf Mark Lawson, AFR, 21/1/11.”
Evidence is acumulating, from people other than journalists, that the ENSO cycles are intensifying as global warming increases.
There are also theoretical reasons why it might be expected for these cycles to become more extreme as temperatures rise.
Ross, I’m from Brissie too and I probably have a few years on you.
We’ve been bloody lucky in Qld since we haven’t had many landfalling cyclones since ’74, in fact we’ve had one, Larry. It has to be a mugs bet to say that there is a chance of the number of cyclones increasing.
If you’ve realy been looking at the BoM data then you would be well aware that the number of cyclones has decreased over the entire Australian region compared to the past. If you’ve really looked at the data then you would know that for the period 1976-1986 there was only one year with less than 12 cyclones in the region (1978) yet since 1991 there has only been one year with more than 12 cyclones (1998).
Now if you are so sure that warming will cause more cyclones can you please explain to me why the number dropped during the last warming period? Since say 1985?
Just because you grew up in time of low cyclone activity doesn’t mean the rest of us did too. We remember when cyclone watching was an annual event, not something to worry about every 5 years or so.
Ross Brisbane says:
February 2, 2011 at 12:32 am
God help us all.
And God help the mothers with little children – may He be with them.
Is this beginning of what’s normal cycles and events?
I respect old timers but please you just stop this and remember and say that little prayer with me.
I hope by a miracle your all correct you folk who don’t seem to accept that the globe is warming and will continue to warm beyond this century. Its cause is DENIED by some of the people of this planet. We still cling to fossils for our quality of life.
——————————————————————
I have never “clinged” to a fossil in my life, except in circumstances that are best not aired on WUWT.
Brisbane is a troll, although he/she did force me to look up the versions of the verb clingo, clinguarame, clingo, strangulatum.
Issued at 11:28 PM on Wednesday the 2nd of February 2011
by the Bureau of Meteorology, Brisbane.
Heavy rainfall associated with Severe Tropical Cyclone Yasi is being recorded in
coastal areas between Townsville and Sarina. The heaviest rainfalls have been in
the catchments of the Haughton and Pioneer Rivers and in the catchments of the
Black and Bohle rivers near Townsville.
http://www.bom.gov.au/cgi-bin/wrap_fwo.pl?IDQ20730.html
Google maps show a nickel treatment plant with two large tailings ponds close to the coast between Saunders Beach and Bushland Beach, to the north of the Black & Bohle rivers. What effect will the heavy rainfall have on these ponds?
LMAO We have channel 7 news team talking to ocean going cargo ships asking them “What is it like riding through this storm?”.
Their reply…
“Ah yeah, I see this all the time in heavey seas…” (Or there abouts).
You can just tell from the tone of the pilot/captain that he is wondering why he’s being contacted about this.
“izen says:
February 2, 2011 at 4:59 am”
This would be true if the globe was actually warming (At a rate anythnig other than “normal”), which it doesn’t seem to be, unless or course, you are looking at computer model output or “adjusted” temperature data.
Alarmist BBC is reporting this storm as
“most dangerous storm ever predicted ”
Just what does that mean./
Alarmist BBC is reporting this storm as
“most dangerous storm ever predicted ”
Just what does that mean?
“Ross Brisbane says:
February 2, 2011 at 12:32 am”
Ross, “he” seems to be on perpetual holiday, when natural events occur. Have you seen “The Life of Brian”?
Presenters on ABC NEWS 24 Australia talking to Jonhathan Nott, biased questions trying to extrat confirmation this storm is caused by AGW. Nott says its not proof of AGW, but this is what we expect. Australia certainly is leveraging the Qld floods and wind to support a “price on carbon” in the fight on “climate change”.
ozspeaksup says:
February 2, 2011 at 4:00 am
R Brisbane…hes a serial pest on any sites that express any agw disbelief.
figures he’d show here sooner or later:-(
We do seem to be feeding a troll with a rating of category 5 on the hysteria scale. Pushing the AGW religion at a time when so many lives and livelyhoods may be in mortal danger is a scandalous way to act IMHO.
But then, what do you expect from misanthropes?
Alarmist computer models (GIGO! GIGO!!!!11) have been used to terrify the public of Queensland into irrational and economically costly action.
We must put a stop to these climate scientist lies and their attempt to enforce socialist ‘evacuation orders’ on freedom loving Australians.
Oh the reporting of this storm is shameful on Australian ABC News 24, shameful!!!
I think that I am about to really lose it. This nonsense has to stop. This is the BBC lead now
“Fierce winds and driving rains brought by the most powerful storm ever to hit Queensland are lashing northern coastal areas of the Australian state.’
http://www.bbc.co.uk/news/world-asia-pacific-12342031
Do they really think that we are that stupid. Do they care. Do they know how stupid they are.
Look any hurricane is tough but people live with them, know the score and above has been listed some terrible outcomes of truly massive storms in the past.
Sorry but they have crossed a line with me.
Ross, dont equate prudent advice re building in flood plains with either intelligence or globull warming. Its neither, nor is it rocket science. But it seems that Common Sense is becoming rocket science.
Since TC Tracy wiped out Darwin in the 1970’s, buildings in the cyclonic region, which is a coastal band running along the northern coast from just North of Brisbane in the East around to about Carnarvon in the West (IIRC), have had to be up to a standard to withstand winds of up to 60 m/s (216 km/h or 135mph) in the “worst” topography. Let’s hope that the builders have only “cyclonic” and “non-cyclonic” designs in their repertoire.
Engineered, non-residential structures, which are designed for greater wind load, should survive except in the very worst areas and where they are struck by flying debris. The latter is the greates risk in a cyclone, with properly designed and built structures. Envelope penetration allows the wind to enter; with a pressure difference in excess of 3kPa; which doesn’t sound like much, but applied over the surface of a building, it’s a huge force that will lead to an “explosion” of ceilings, walls and roof.
Design wind speeds are codified in AS1170-X and AS4055-X … where X is some revision with which I’m not completely familiar.
Keep in mind that there are safety factors in designed structures. A structure that’s designed (and constructed) to withstand winds of 60 m/s won’t disintegrate at 60.1 m/s. Chances are that it’ll take 65 m/s winds and a pretty good chance that it’ll survive 70 m/swith only cosmetic damage. It depends where materials are on the strength distribution curve of the critical structural elements.
I have a question for Mr Brisbane.
Mr Brisbane, would you carefully and thoroughly describe what constitutes an “extreme weather event”?
Considering we have cyclone/hurricane scales, to me the definition of extreme would be something exceeding those scales, or at least consistently pegging to the top of them.
A category 1-3 hurricane, to my mind, is not extreme since the earth is quite capable of making them. A category F1-F3 tornado/waterspout, to my mind, are not extreme since they are fairly common particularly in the central US plains. If you believe these are extreme events, then your example of CAGW being exemplified by extreme weather events is meaningless since these are fairly common weather events.
I’m sick and tired of commonplace weather being called “Extreme” and used as an example of that which doesn’t exist.
Ross Brisbane,
There is an article on Joanne Nova’s site you should read . Note: I completely agree with Jo, “As usual, it’s the name-callers who cling to 100 year time-frames and deny the long term evidence, while we cherry-picking denialists gravitate towards long term studies based on real observations.”
Yasi is a monster — but not an unusual one
http://joannenova.com.au/
Ross Brisbane says:
“Is this beginning of what’s normal cycles and events?”
No, Ross. This is a continuation of the exact same kind of weather events that have happened repeatedly in the past. If anything, weather events were more numeous and severe when CO2 was lower. Quit scaring yourself. It’s only natural variability in action.
Grey Lensman says:
February 2, 2011 at 8:28 am
I think that I am about to really lose it. This nonsense has to stop. This is the BBC lead now
“Fierce winds and driving rains brought by the most powerful storm ever to hit Queensland are lashing northern coastal areas of the Australian state.’
————————————————–
The most powerful storms ever … yada, yada – cheer up Grey Lensman. No record breaking storms where I live. Or where most Australians live.
One of the main reasons my (Dutch) parents came here was to get away from the awful weather. I am gobsmacked by those ‘surveys’ that announce that the best place to live in the world is somewhere in Scandinavia.
No offence to WUWT readers in colder climes, apologies for any wounded feelings. But, if global warming (over and above what we might expect) is happening, and it is so bad, how come people who have a choice usually migrate to somewhere warmer?
Looking at the weather stations that report frequently in the Townsville area it looks like Yasi came ashore as a Aus cat 3 cyclone. No gusts recorded over 100kts, no steady winds over 75kts and very varied rainfall rates (eg Woolshed 40mm/hr, Townsville 15mm/hr). Minimum central pressure 977mb – well up on the 940mb recorded at Willis Island.
It could well be, of course that it was worse somehwere without an automatic weatherstation.
Good news: early reports are that the damage from Yasi is generally modest, except in one or two small towns such as Tully. While there has been widespread loss of power through transmission towers coming down, etc, live video from Cairns and Innisfail shows lights on, minimal wind damage, little or no storm surge flood damage. No reports of death or major injury. Still heavy rain over a wide area, which is likely to lead to some flooding given that the ground is saturated from earlier rain.
Whilst Yasi was a strong storm it is farm from unprecedented in QLD’s history. I can think of several storms which have already been mentioned in this thread.
The Bathurst Bay storm of 1899 which generated the highest storm surge ever recorded and the 1918 Mackay cyclone which recorded a central pressure of 932mb but probably had a lower reading as this was the lower measuring limit for the barometer. In the same year Innisfail had a cyclone that had an estimated central pressure of 910mb.
So TC Yasi whilst very strong was certainly not unprecedented.
I picked up this article in The Oz yesterday from Jo Nova’s site and have posted it on a couple of blogs today
http://www.theaustralian.com.au/news/features/queenslands-cycles-of-havoc/story-e6frg6z6-1225998344719
Jonathan Nott is an expert on the incidence of super cyclones. By analysing ridges of broken coral pushed ashore by storm surges, he has catalogued the incidence of super-cyclones over the past 5000 years.
In a paper published in the scientific journal, Nature in 2001 his research shows the frequency of super-cyclones is an order of magnitude higher than previously thought.
Nott’s work puts into perspective current debate about whether climate change is responsible for the extreme weather events in Queensland.
…
What the longer term records show, however, is that the frequency of extreme cyclones follow a predictable long-scale pattern.
“What the record shows is we go through extended periods, hundreds of years, of high activity and extended periods of little activity,” Nott says.
“The past 100 to 150 years has been very quiet in Queensland in terms of what happened in the past. The couple of hundred years prior to that were very active.”
…
here’s the abstract of the paper by Prof Nott to which the Oz article refers
http://www.nature.com/nature/journal/v413/n6855/abs/413508a0.html
Understanding long-term variability in the occurrence of tropical cyclones that are of extreme intensity is important for determining their role in ecological disturbances1, 2, 3, 4, 5, for predicting present and future community vulnerability and economic loss6 and for assessing whether changes in the variability of such cyclones are induced by climate change7. Our ability to accurately make these assessments has been limited by the short (less than 100 years) instrumented record of cyclone intensity. Here we determine the intensity of prehistoric tropical cyclones over the past 5,000 years from ridges of detrital coral and shell deposited above highest tide and terraces that have been eroded into coarse-grained alluvial fan deposits. These features occur along 1,500 km of the Great Barrier Reef and also the Gulf of Carpentaria, Australia. We infer that the deposits were formed by storms with recurrence intervals of two to three centuries8, 9, 10, 11, and we show that the cyclones responsible must have been of extreme intensity (central pressures less than 920 hPa). Our estimate of the frequency of such ‘super-cyclones’ is an order of magnitude higher than that previously estimated (which was once every several millennia12, 13, 14), and is sufficiently high to suggest that the character of rainforests and coral reef communities were probably shaped by these events.
you have to log in to see the paper in total
To All
To the next and next events. The computer models are forward estimates of collateral damage to our climate. I am looking for correctness and for them to have some semblance of reality as when coupled to precedents of specific events. It is to the now present global warming we are seeing many bodies of empirical data emerge. Some of its track record has been fairly consistent with a globally warming world.
It’s best that we all prepare and some how whether you are skeptic/sceptic or understand better the rudimentary laws of physics. This globe we share will get much much warmer not cooler.
Dr Roy Spencer for example is a MAGW (mildest) and would disagree with total denial of the rudimentary laws of physics within the context of radiative forcing. So he is at odds with many here on this forum. It is little wonder to cherry pick his data but then that is your right to do that. I hold this fellow in very high esteem and I am a avid reader of his articles on his web site.
Of course I tend not to agree with him on a few issues. That being his radiative sensitivity theory. So is Plimer/Monckton/Carter/Lindzen etc.
My understanding and its been a long road of some three years of study/understanding of the historical and the present trends. A +1 Celsius shift in global temperature can have a profound effect on our chaotic climate when factored in.
All that has to happen within 10 short years is a shift to the increase of temperatures beyond .5 Celsius and Spencer’s theory in cloud balancing acts is falsified. That is a fact. BTW Lindzen and Spencer are at odds even here as to the specifics of there MAGW theories – that is the minimal effect of radiative forcing as consequence of CO2 upon climate as a free state acting greenhouse effect. That leads to various climate sensitivity hypothesis.
If we shift to 1.5 Celsius rise in temperatures then models predict Super Cyclones by 2050 perhaps exceeding CAT 5 levels.
There seems to be some fascination with past records. Everyone is looking for that record breaker. This is wrong thinking.
All I have done here is to assert that computer modelling is based on two sources – PAST climate and the way it behaves and future projections as it is projected to behave in a global warmer context.
I could go on and on but sadly there are some here who are taking what I am saying badly out of context.
Now as to other things like snow like some are experiencing – don’t cheer when you see that stuff because in the final analysis USA is less then 5% of entire globe when it comes to land surface and global readings of climate. How less then 5% of a land mass can judge accurately the world’s real climate by looking out there window or putting the best warm coat on and gloves is beyond me. Don’t come to me yelling our “world” is cooling cause it’s not.
Try sitting here in soaring heat of 100 degrees and air like pea soup. Try remembering that north of Australia in the Coral sea are oceans recording warm temperatures breaking all records. Try 110 degrees in Sydney.
I get accused of many things – but myopic vision is not one of them.
Ross Brisbane,
Please provide us with testable, real world evidence showing that the rise in CO2 has harmed the planet. Make sure you are able to attribute any putative global “damage” specifically to CO2, as the alarmist crowd tends to assign every natural event to “carbon.”
The scientific method is completely ignored by the alarmists, but we here kinda like it, because it separates the wheat from the chaff; truth from baseless conjecture.
Take your time, I understand that you may have to check back with the realclimate and skepticalscience echo chambers.☺
Smokey
First: The term alarmist is derogatory for starters.
Second: I have never said here you are a denier. I have said quite clearly here that some DENY the physical laws known to exist in the gas CO2 and how it is a weak collector of the suns radiation and holds more in that would normally escape to space at night.
Third: The rest of the amplification is down to water vapor driving real climate.
Fourth: It is not my place here to drive home the science of AGW fundamental laws of physics and radiative forcing. Go to someone like Spencer for that.
Fifth: When a person reads the data he/she sees a warming world. I do not imply all this data is wrong or contrived. Do you? Mistakes yes but not contrived so to be in the domain of fraudulence.
Sixth: When we see an event like a return of large intense Cyclones/Hurricanes we are looking for anomalies consistent with a warmer globe. There size, development and what drivers within the standard climate are either below standard or above standard deviations.
You see Smokey at the end of day – we do get La Nina’s for sure but smaller ones. At present the oceanic currents are churning like a washing tub. Record La Nina = record heat/cold exchange rates are happening in our oceans – THIS IS NOT COOLING. It is our global oceans sequestering the heat build up in the first 70 meter layer in the oceans. Much like a heat pump in a reverse cycle air conditioner. Climate is only on move when extra energy is being placed into the system through some mechanism.
That mechanism is CO2 – much like the ripple effect of a stone disturbing a pond. We have all seen the movie the “Butterfly Effect”. Very slowly the earth is moving through phases of warming. Within those stages there will be sign posts along the way indicative of a world physically warming.
I fear along the way desensitization may set into the thinking of some. In other words we get so used to these events we think they are the normal.
There is of course a fascination with paleoclimate. All this is going to show over greater time frames in the context of warmer globe a far more active climate. It is NOT predicated on record beaters. It is based on attempts to reconstruct climate as it existed in a warmer context. It supports the theory that we may be headed into DAGW time frames for the earth over the next hundred years.
These studies are used in computer modelling. They help us understand climate trends in a warming globe context.
Smokey it is not my place to under cut Mr Watts web site.
Knowing I am at odds with him over many issues I would direct you to Spencer’s web site for a better understanding of the radiative forcing of CO2 in its basic science.
Ross, that is what’s known as a cop out. I simply asked for an example of global damage caused by the rise in CO2. Either you can provide verifiable evidence or you can’t.
Smokey,
I can answer your objection but on terms of what caused the warming.
1. A known mechanism on earth is warming the globe. This is not in dispute.
2. Warming after many empirical science studies has separated NATURAL variability from the base extra energy stored in the climate system. Radiative laws of physics in regards CO2 give an available quantum.
3. Extra energy is being held daily from the sun through this mechanism.
4. The globe is getting warmer.
5. In a warming globe we should see greater weather anomalies as such we are having. floods/droughts/heat waves/Strange hemisphere solace wind currents. That is in a high energy climate state things will be on the move dynamically.
6. Paleoclimate studies indicate in warmer globe context we see greater cyclonic/hurricane activity
7. Studies of the Australian context indicate as globe warms we should see the following events as signs and confirmations from computer modelling based on warmer globe context:
a. Greater EL Nino intensity
b. Greater La Nina intensity
c. Greater prolonged drought seasons/intensifying downpours/more powerful cyclones/ floods / extreme weather events dependent on La Nina/El Nino extremes which will worsen as the planet warms more.
d. The cause of a cyclone event should be verifiable by ANY given hypothesis based on the scientific method. This does mean that cyclones were ALWAYS dependent on Carbon Dioxide being in greater concentrations. It would simply mean that the extra warming mechanism was different at that time as to its causation. Solar/Earth tilt/Earth orbit/Season Air Current shift/Volcanic/Greenhouse gas concentrations*. This is called climate variability.
* Some really bad science is coming out that is simply not science based. Even Spencer baulks at some of this rubbish science.
Wikipedia:
hypothesis (from Greek ὑπόθεσις; plural hypotheses) is a proposed explanation for an observable phenomenon. The term derives from the Greek, ὑποτιθέναι – hypotithenai meaning “to put under” or “to suppose.” For a hypothesis to be put forward as a scientific hypothesis, the scientific method requires that one can test it. Scientists generally base scientific hypotheses on previous observations that cannot satisfactorily be explained with the available scientific theories. Even though the words “hypothesis” and “theory” are often used synonymously in common and informal usage, a scientific hypothesis is not the same as a scientific theory. A working hypothesis is a provisionally accepted hypothesis.
So what do we have – CO2 did not cause directly the storms and it does not work that way.
What CO2 does is create the mechanism and first cause to warming “drift” in climate – its called nudging. The rest is how water vapor/clouds/oceans RESPOND – climate sensitivity.
So what is your answer – simply if you deny that CO2 is first cause the way you perceive the end result will be different.
Finally if want to remove the CO2 as the first cause of global warming or a warming globe then you have to develop another hypothesis of same quality and quantity.
That my friend is why we disagree. Do not come back to me and tell me that this is not sound science – it is and that is why we are having this debate.
Reply to Ross Brisbane’s comments.
Cyclone Yasi has just passed my beach home just north of Townsville, and heading inland as it weakens. I have lived 70+ years in the North Queensland , and I have seen many severe cyclones as I worked all over this area. When I was a lad the informed senior locals used to judge a severe cyclone by the degree that the winds bent coconut trees nearly parallel to the beach. They had no satellite image to tell them how strong it was.
As Yasi moved towards the coast and before the BoM figures were released on the actual wind speeds in cities like Townsville and Cairns became available, I reflected on past years and I recalled lower wind speeds with cyclones that had large “eyes”.
I therefore questioned the forced evacuations, and the projected storm surge figures that were being projected by the government authorities as Yasi had a large “eye”..
As the forced evacuation only affected those people in the projected storm surge area, a lot of my family and friends choose to stay in their homes that since the 1970 period
have been largely bought up to the catagory 3 standard and their buildings are all O.K…
It will be interesting to see a report by JCU’s building strength team on the cyclones impact on dwellings in the cyclones area of influence. It is a fact that all cyclones are frightening events to live through, but the theory that AGW has caused much stronger cyclones that some political people chose to pronounce is false in my view. Science must be proven to be acceptable to me, and AGW science on the CO2 influence is far from proven.
A G Fostesr gives some lovely satellite images –
February 1, 2011 at 7:33 pm
MTSAT visible (stationary): http://www.goes.noaa.gov/FULLDISK/MTVS.JPG
MTSAT infrared (stationary): http://www.goes.noaa.gov/FULLDISK/MTIR.JPG
On each, there is a peculiar feature on the north front of the 2,000 km of cloud that stretches eastwards from the spiral, way out into the Pacific. This is the “feathery” appearance of filaments a hundred km or more long, pointing to the north like teeth on a comb. My instinct was that these were clouds forming and being drawn south; but on time lapse, they start in the white mass and stretch out northwards like tendrils. They are new to me and I lack key words to search. Anyone able to explain?
graham g
You said:
Science must be proven to be acceptable to me, and AGW science on the CO2 influence is far from proven.
I say:
Well I tell you as fact as I have looked into projections over the next process of temperatures going higher. Based on quantum calculations of the greenhouse effect which is an established law of physics in science it is solid science. There will indeed be even stronger Cyclones as we glimpse into the long sighted looking glass in a warmer global climate. I have seen the models based on a 1 degree Celsius projection and cyclonic aberrations will indeed intensify. They will get very frightening by 2050.
The science papers are out there for anyone to check. No I am not referring to the IPCC or Gore presentation stuff. Many of these papers are not even in the 2007 IPCC reports. Science has made quantum leaps in what know about climate now. The knowledge and objective measurements of such events far exceed the knowledge we had even 10 years ago. They are more accurate and lift the mystery from these events. It is not then a wild off the cap idea of the cliché verbal it is climate change – no. It’s really making a statement that a warmer planet predisposes these Cyclones to develop much larger then they may have been.
I also consider the fact you did not evacuate you are lucky that it did not swing right in your path – we know about the girth of its eye but you were indeed playing with fire based on your own knowledge. I personally would not have done that. More over the precautionary principle would have cut in for me. Not based on some notion of political disagreement to prove some satisfactory point. Rather I would look at my wife and my children in the eye and do the best thing for their safety.
Why is it the older folk think they have better survival skills and better judgments. I recall as a very young child the great rains of the late 50s in QLD – I do not recall my father ever alluding to 75% of the State in a state of flooding all at the SAME time. I knew that cyclones were on the way. In fact I said to a few in 2007 there would be so much water in the dams that a Brisbane flood would eventuate. I made those statements based on few trends – a globally warming earth and the switch to a very strong La Nina event. Now I was also influenced by what I read in those models that showed this an inescapable event.
We live in dynamic changes. God bless.
Smokey says: February 1, 2011 at 10:01 pm:
“There are no folks I admire more than Australians. It wouldn’t bother me at all if they ruled the world.”
Goodly point Smokey, but too much time explaining our sense of humour me thinks.
And that we actually like our weather and Constitution. Well the majority of us that is.
“”””” Ross Brisbane says:
February 2, 2011 at 6:08 pm
Smokey,
I can answer your objection but on terms of what caused the warming.
…………………………………….
So what do we have – CO2 did not cause directly the storms and it does not work that way.
What CO2 does is create the mechanism and first cause to warming “drift” in climate – its called nudging. The rest is how water vapor/clouds/oceans RESPOND – climate sensitivity. “””””
Ross, have you ever considered just how untenable that position is ?
So CO2 ‘starts the ball rolling’ by just giving the climate a nudge (off top dead center I presume) and then H2O takes over.
Last time I checked, Water vapor, Clouds, and oceans, were ALL mostly H2O, not CO2.
The only energy transport mechanism, active in the earth climatic environment, that in any way involves CO2, is the LWIR Radiant emissions from earth surface/oceans/atmosphere captured by CO2 in what is called the “Greenhouse effect” except we know green houses don’t really work that way.
No other energy transport process, such as upward atmospheric convection for example, involves CO2 or any other non-condensing GHG.
So the whole thing was in a nice stable “equilibrium” until MAN came, and introduced some CO2 to the atmosphere ??
Just where abouts in our climate history did that “nudge” occur. Was it at 315 ppm in 1957, or was it earlier than that; was it when we crossed the 280 ppm Sacred value that should never be exceeded.
Since the effect of CO2 is logarithmic (so the established science concensus says), their would have been a 3.0 deg C Temperature “nudge” given by CO2 going from 140 ppm to 280 ppm; did that wake up the H2O monster ?
Those of you in that camp, seem to freely admit, that it is the H2O in vapor and cloud form (oceans too) that really does the climate damage; CO2 is just the wimp that gives the water a nudge; but it is the water that is the 800 pound gorilla that sends Temperatures sky rocketing, and storms hitting new records.
That is such a silly idea; you should be ashamed to offer that as an explanation. If water is such a powerful feedback that amplifies the miniscule CO2 effect, it would seem that just leaving the garden hose on for a few minutes would be enough of a nudge to cause the runaway effect that CO2 is charged with creating.
Water by itself, without any nudging, is perfectly capable of running the whole show itself; it doesn’t need any nudging from CO2 of Ozone, or Methane; or even from accidently released dental laughing gas.
For a start; the system isn’t even vaguely in equilibrium anyway. We can have a total global Temperature spread on any summer day (north) of as much as 150 deg C; and everything in that range may be present somewhere on earth.
Surely in at least one of those places, the local H2O should feel like taking charge, and amplifying the effect ow whatever the local CO2 happens to be.
This morning, the Temperature was right around zero (deg C), and my breath deposited a thin ice slick on my windshield. There was not a sign of any dew, nor a cloud in the sky, a complete hemisphere of cloudless emptiness, and clear air. Temperatures yesterday were low 70s (degF), around 22 degC yet this morning it was zero. And this was in industrial silicon Valley; nobody has CO2, if we don’t.
CO2 didn’t do a damned thing about nudging the Temeprature off top dead center.
Water in any form, in any place in the atmosphere, anywhere on earth, ALWAYS reduces the total amount of solar energy that can and does reach the earth surface (and oceans); every single additional H2O molecule in the air, further reduces that collected solar energy; no matter what. Evn CO2, because of its near IR absorption bands, also acts to reduce the amount of solar energy that the earth collects. Ozone in the upper atmosphere also reduces ground level solar energy; anywhere on earth that it occurs.
That is incontrovertible, and also irrefutable, experimental fact. It is not the output of some Teraputer video game run.
CO2 can’t do diddley about keeping the earth warm in the absence of H2O at reasonable levels in the atmosphere; and anyone who has ever spent a night in an alpine desert knows that too well. And I doubt that there is any place in the atmosphere where weather/climate occurs, where CO2 is ever in excess of the local H2O abundance.
So much for givng things a nudge.
George E. Smith
I never implied the CO2 directly transports energy.
That energy source is the sun. But its the daily 24 hour cycle of this in any net gain that can cause global warming progressively.
There is cause and there is a flow on effect. Energy must in the final analysis be held in.
We know the properties of minor CO2 hold in and retain the radiative effect of the sun. without the effect of CO2 in the atmosphere the earth would freeze at night.
With additional free CO2 being added we are adding the net held in energy over a day/night cycle.
As we increase ppm levels we also increase the net gains of retained energy.
You are muddling my post.
Whilst you are saying things it is mixed and convoluted with the laws of physics of the CO2 radiative that is correct and then sprinkled with misuse and wrong assertion.
Water Vapor – the greenhouse effect – yes we know it is one for sure. It is a greenhouse effect. But without some forcing from a known cause of energy it DOES NOT get created from no energy inputs. By itself it does not become a driver of warmth or cool. There must be inputs of energy into the global climate system.
The million dollar – does water amplify global warming as a negative or positive feedback. Well from what I’ve seen of QLDs climate over the past three months it DOES! Yes that is a very short variability but understand our Summer experienced such heavy cloud for three months it was dim in summer noon. Now temperatures in some are at 45 degrees Celsius so all I can assume this massive cloud cover did cool the landmass at all. Let alone the torrential rains.
So increasing ppm of CO2 increases the likely accounting quantum of energy held in as a positive forcing not a negative one.
One fatality reported after Yasi.
“”He was sheltering inside a residence when he was overcome with fumes from a generator,”
http://www.smh.com.au/environment/weather/cyclone-yasi-claims-first-victim-20110201-1acgp.html
“Ross Brisbane says:
February 2, 2011 at 3:45 pm
Try 110 degrees in Sydney.”
This is the only point in your post I want to talk to. 110f/43c in Sydney, and surrounding areas, isn’t unusual. And these figures you are quoting are in the deep west of Sydney, away from the coast, Penrith for example which regularly gets to 110f/43c in summer. What does appear unusual this summer is that hot temperatures of 105f+/40c+ have occured in February, with high levels of humidity, and with just 3 weeks of summer remaining, will drop to average or below average after this Sunday. Up to this week it’s been average to below average in Sydney. In fact the January/February record highs for Sydney were set in 1939 and 1926 respectively. Not one record high has been broken in NSW this summer. I live near on of Sydneys airports, and its temperature is regularly used in weather reports. Some significant bias happens when airport based temperature readings are used in weather reports.
As for Qld and Brisbane in particular, there was not one single day in Brisbane above 30c for the entire spring.
I do believe your post is misleading.
Patrick Davis,
There are trends emerging for QLD’s temperatures that indicate the most powerful La Nina on record and the greatest cover cloud QLD has ever experienced over December/January IS NOT dampening temperatures. The ENSO factored in appears to have only compensated by much less a half a degree Celsius on the average to averaging since 1950.
Dr Roy Spencer is wrong to assert cloud formations are negative feedbacks as they are far too temporal on the temperatures and are caused by net gained energy inputs anyway. The radiative factoring of global warming seems to reaching a new level of what was global minimums. you should also realise despite the most powerful La Nina ever experienced we are certainly not sufficient impacts to prove variability. These within careful reading of BOM summaries of temperatures is subtle signal of global warming over arching the temperatures. I see it and but you cannot – well aren’t that interesting. The same goes fro our counterparts freezing in the North – you should not read much into snow and ice falls. All it positively points is that somehow a warming mechanism is driving extra extraordinary water vapor into the upper atmosphere. This extra energy does not come from somewhere out of the mother nature’s variability make believe energy creation. The snow storms emanate from higher energy INPUTS in the first place! As goes QLD the freezing are not a sign of global cooling – they are effects of extreme inputs “seeking” climate equilibration.
Another blow to clouds being negative feedback is that the energy that would have lost to space is stored in the water turning to water vapor of condensation. When rain falls the air temperatures cool but the ground actually heat up in cycle.
So the greenhouse effect of CO2 is actually amplified by clouds and water vapor rising into atmosphere. The feedbacks are often ignored in calculating the nudge factor of CO2 is which a weak nudge to a warmer not cooler planet.
Here is in part a QLD BOM summary:
Maximum temperature
The state-averaged mean maximum temperature for January was 34.46 °C, compared with the long-term average of 34.80 °C.
Daily maximum temperatures were 6 to 8 °C above the January average over the southern Channel Country, Maranoa and Warrego and far southwestern Darling Downs on the 25th in the northwesterly airflow ahead of a slow-moving trough over South Australia. On the 26th, daily maximum temperatures reached 8 to 10 °C above the January average over large parts of the Maranoa and Warrego and southern Channel Country and over the far southwestern Darling Downs and Granite Belt as the trough approached the southwest Queensland border. A small area near the Queensland border was even more than 10 oC above average. On the 27th, daily maximum temperatures were 8 to 10 °C above the January average over large parts of the Channel Country and Maranoa and Warrego. Daily maximum temperatures were 8 to 10 °C above the January average over small parts of the far southwest Channel Country and Maranoa and Warrego on the 28th.
The highest daily maximum temperatures recorded in Queensland during January occurred on the 27th and 28th, with 47.4 °C at Birdsville Airport and 47.0 °C at Bedourie Police Station on the 27th, followed by 46.1 °C at Birdsville Airport on the 28th. Daily maximum temperatures were 4 to 6 °C above average over large parts of the west of the state on the 29th.
The warmest days on average occurred at Bedourie Police Station with 40.7 °C, followed by Birdsville Airport with 40.6 °C, followed by Urandangi with 39.4 °C.
The coolest days on average were at Applethorpe with 25.5 °C, followed by Maleny Tamarind St with 25.6 °C, followed by Toowoomba Airport with 26.0 °C.
The lowest daily maximum temperatures recorded in Queensland during January were on the 6th, with 18.2 °C at Applethorpe, followed by 19.0 °C at Stanthorpe Leslie Parade, followed by 19.4 °C at Toowoomba Airport.
Some sites had their lowest January mean daily maximum temperature for at least 20 years. See a map of mean maximum temperatures. See a map of maximum temperature anomalies.
Minimum temperature
The state-averaged mean minimum temperature for January was equal to the long-term average of 22.67 °C. Daily minimum temperatures were 6 to 8 °C above the January average over the far southwestern Channel Country on the 25th in the northwesterly airflow ahead of a trough over South Australia, spreading to a large part of the southern Channel Country and a small part of the far southern Darling Downs and Granite Belt on the 26th as the trough approached the southwest Queensland border. This area extended northeast on the 27th and daily minimum temperatures were up to more than 8 oC above average over far southern border regions. On the 28th daily minimum temperatures were 6 to 8 oC above average over the far western Channel Country and parts of far southern interior and more than 8 oC above average over the far southwest. They were more than 6 oC above average over the far southwest on the 29th and 30th.
The coldest night was at Applethorpe with 12.1 °C on the 24th, followed by Stanthorpe Leslie Parade with 12.9 °C on the 24th, followed by Applethorpe with 13.0 °C on the 15th.
The coolest nights on average were at Applethorpe with 15.7 °C, followed by Stanthorpe Leslie Parade with 16.2 °C, followed by Warwick with 17.3 °C.
The warmest nights on average were at Birdsville Airport with 26.9 °C, followed by Sweers Island with 26.4 °C, followed by Mornington Island with 26.0 °C.
The highest daily minimum temperatures recorded in January were 31.8 °C at Thargomindah Airport and 31.5 °C at Birdsville Airport on the 28th, followed by 30.8 °C at Birdsville Airport on the 8th. Some sites had their lowest January mean daily minimum temperature for at least 20 years. See a map of mean minimum temperatures. See a map of minimum temperature anomalies.
Wind
The strongest wind gust was at Hamilton Island Airport with 128 km/h on the 30th, associated with TC Anthony, followed by Mackay M.O with 111 km/h on the 7th, followed by Double Island Point Lighthouse with 102 km/h on the 9th, followed by University of Queensland Gatton with 102 km/h on the 12th.
______________
You should carefully read the BOM summary. You will find I have not been misleading. You cannot just use REGIONAL minimums as these are not sustained – clouds are temporal and only provide very short relief from the relentless very slow climb in global temperatures.
The snow USA has been experiencing I predict is a temporal shift caused by built up flux energy in the form of massive water vapor free in the upper atmosphere causing a massive clash to condensation in cooler fronts and falling as massive record breaking snows. It points to a climate on the move and not static because extra energy is being quantum-ed into the global system.
America I predict will experience the worst heat waves this coming Summer in their history. The Arctic ice will be a rapid melt back and the tipping point for this region may strike within 5 to 10 years.
I know I write simply but behind all this is a reading of copious material, data and studies on climate at the empirical and historical levels.
Ross (DigitalAdvisor/ConcernedCitizen?), once again you are offering your nonsense interpretations of science. There is no point in trying to help you correct what you say because you just do not want to learn. You were ranting on like this and about those “tipping points” that you are so enthusiastic about on Senator Fielding’s “climate change” threads for much of 2009 and 2010. May I suggest that you concentrate on your English grammar and theology studies and leave the science to scientists.
http://agmates.ning.com/forum/topics/a-handy-hyper-heatwave-and-yet?xg_source=activity&id=3535428%3ATopic%3A124180&page=73#comments :
“I am also trained and highly skilled on matters of theology from the more orthodox evangelical faith to which you belong.”
Best regards, Pete Ridley