Why is this important? Well if you are calculating UHI for stations by looking at satellite images of nightlights, like GISS does (see my post on it at CA) , you’ll find that there’s generally no city lights in the water, leading you to think you’ve got no urbanization around the station. Using only 10 lines of code, Steve Mosher finds 230 errors in NCDC’s Global Historical Climatological Network (GHCN) data that places the station over water, when it should be on land. Does this affect the calculation of Earth’s surface temperature? Steve Mosher investigates. – Anthony
Wetbulb Temperature

This google map display is just one of 230 GHCN stations that is located in the water. After finding instances of this phenomena over and over, it seemed an easy thing to find and analyze all such cases in GHCN. The issue matters for a two reasons:
- In my temperature analysis program I use a land/water mask to isolate land temperatures from sea temperatures and to weight the temperatures by the land area. An area that would be zero in the ocean, of course.
- Hansen2010 uses nightlights based on station location and in most cases the lights at a coastal location are brighter than those off shore. Although I have seen “blooming” even in radiance calibrated lights such that “water pixels” do on occasion have lights on them.
The process of finding “wet stations” is trivial in the “raster” package of R. All that is needed is high resolution land/sea mask. In my previous work, I used a ¼ degree base map. ¼ degree is roughly 25km at the equator. I was able to find a 1km land mask used by satellites. That data is read in one line of code, and then it is simple matter to determine which stations are “wet”. Since NCDC is updating the GHCN V3 inventory I have alerted them to the problem and will, of course provide the code. I have yet to write NASA GISS. Since H2010 is already in the publishing process, I’m unsure of the correct path forward.
Looking through the 230 cases is not that difficult. It’s just time consuming. We can identify several types of case: Atolls, Islands, and coastal locations. It’s also possible to put the correct locations in for some stations by referencing either WMO publications or other inventories which have better accuracy than either GHCN or GISS. We can also note that in some cases the “mislocation” may not matter to nightlights. These are cases where you see no lights whatsover withing the 1/2 degree grid that I show. In the google maps presented below, I’ll show a sampling of all 230. The blue cross shows the GHCN station location and the contour lines show the contour of the nightlights raster. Pitch black locations have no contour.
I will also update this with a newer version of Nighlights. A google tour is available for folks who want it. The code is trivial and I can cover that if folks find it interesting. with the exception of the graphing it is as simple as this:
Ghcn<-readV2Inv() # read in the inventory
lonLat <- data.frame(Ghcn$Lon,Ghcn$Lat)
Nlight <- raster(hiResNightlights)
extent(Nlight)<-c(-180,180,-90,90) # fix the metadata error in nightlights
Ghcn<-cbind(Ghcn,Lights=extract(Nlight,lonLat)) # extract the lights using “points”
distCoast <-raster(coastDistanceFile,varname=”dst”) # get the special land mask
Ghcn <- cbind(Ghcn,CoastDistance=extract(distCoast,lonLat))
# for this mask, Water pixels are coded by their distance from land. All land pixels are 0
# make an inventory of just those land stations that appear in the water.
wetBulb <- Ghcn[which(Ghcn$CoastDistance>0),]
writeKml(wetBulb,outfile=”wetBulb”,tourname=”Wetstations”)
Some shots from the gallery. The 1km land/water mask is very accurate. You might notice one or two stations actually on land. Nightlights is less accurate, something H2010 does not recognize. Its pixels can be over 1km off true position. The small sample below should show the various cases. No attempt is made to ascertain if this causes an issue for identification of rural/urban categories. As it stands the inaccuracies in Nightlights and station locations suggests more work before that effort is taken up.
Click to enlarge images:

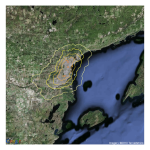
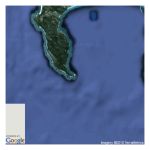



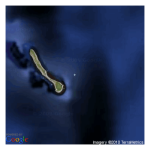
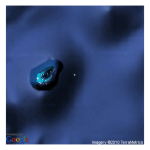
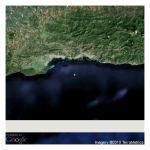


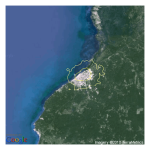
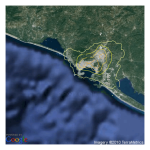

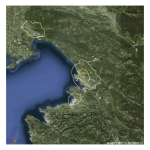
Let me say it first!
“All Wet!”
Can we say they are lazy? Maybe they were processing their data in a dark alley.
==============
They are all at sea!
Mr. Mosher, you progress sir, you progress. In time we shall learn much I think from your worthy efforts. Still clearly there is much more to do, But it is a start.
The only thing that puzzles me is how the professionals, if you can call them that, did not appear to be aware of this. It may of course be that they are, but believe that their statistical analysis copes with these problems. Perhaps, but if so why have they never even referred to this problem? If they knew it existed one might expect they would explain their methods of dealing with it.
Is that too much to ask? They have been doing this kind of thing for decades yet it takes one amateur, I hope you do not take exception to that description Mr. Mosher, Natural Philosophy has a long and honourable tradition of relying on the well informed amateur, where indeed would our astronomical colleagues be without their army of amateur star gazers? but just one such amateur working by himself to discover these flaws in a relatively short time.
Does that not strike you as strange? Perhaps not in the Topsy Turvy world of climatology where it seems it is the amateurs are doing the serious work that the professionals have omitted to do.
As for the answers you will get from the experts Mr. Mosher I keenly await them, but somehow suspect we may have to wait for a very long time indeed.
Kindest Regards
Nightlights over water can be fishing boats or aerosols dispersing city light vertically. The instrument is sensitive enough to detect both. Or indeed, they can be calibration and/or registration errors, or blooming/bleeding.
Perhaps I may be forgiven for repeating a comment I left earlier over at Moshtemp:
Mr Mosher,
I had a great vacation last year prowling the west and documenting USHCN stations. Occurred to me belatedly that I was driving right past GHCN stations without getting them. So I started to include them just in case Anthony ever makes good on his threat to extend the Surface Stations gallery. I only have a couple so far, but I’ll be glad to share the on-site numbers now and in the future if it would be useful.
Oregon’s Sexton Summit shows typical creativity in coordinates. GISS has the station about a mile and a half to the north, MMS is much closer, maybe 300 feet to the east, and my Garmand (at 42.600131, -123.365567) is about right on the satellite photo.
GISS site descriptions can be just as creative as their coordinates. I got a chuckle this afternoon to see that they put El Centro, California, in an area of ‘highland shrub.’ Locals know that El Centro is in the Salton Sink, 39 feet BELOW SEA LEVEL. Ah, well….
A trillion pounds is being spent based on data which so lacks any quality control that it makes infant school artwork look “precise”.
And then they have the gall to suggest that being a sceptic is anti-scientific!
It’s worse than we thought, undetected massive sea level rises.
230 Stations.
Is that a lot?
My respect for Hansen grows and grows.
Oops I used a trick there to hide the decline.
These are good results. Improvement in the the surface measurements are needed. While metadata mining is not my specialty, I am glad someone works that side of it. I think there is a benefit from the surface data, but it is limited in scope and has pesky problems like the UHI and the even simpler fact that there are thousands of separate thermometers in different locations. Calibration and location are just two issues.
A better standard for what the temperature is will greatly benefit everyone. My workaround for using a single set of temperature data is to blend 4 sources of data together. This blended data has some nice advantages. It gives coverage of the entire instrumental period, but also includes the superior satellite data. I even have some AGW fold agree that this is a good method.
Cleaning up the modern data is good, but the real battle is with CO2. This is where I really focus my effort. My current bit of trouble is to discredit climate sensitivity calculations based on CO2 changes.
We will win as the actual science is on our side, but a solid understanding of the science will be needed.
John Kehr
The Inconvenient Skeptic
This may all be meaningless because, as some physicists say, temperature can only be taken if the system is at equilibrium. The atmosphere is never at equilibrium so any temperature taken is meaningless.
What we are arguing about is a few tenths of a degree divergence from what someone has calculated as an average, so giving the anomaly that the graphs show, but this so called average may not be correct because it is calculated over too short a period of time.
Climates change, get used to it.
chu says: (November 8, 2010 at 2:20 am) It’s worse than we thought, undetected massive sea level rises.
Beautiful, Chu! A classic.
“orkneygal says:
November 8, 2010 at 2:24 am”
It’s a lot of bad data, that’s for sure. But they thought they could get away with sloppy/shonky work, and to a large extent, they have. In no other industry do I know of such sloppiness that is tollerated. If my engineering work handn’t turned out within the +/- 2 micron specifications, I’d have been saked.
I suppose it is not clear in all cases where what the coordinates in the metadata are referenced to. Nasa-Giss et.al might not have cared much about that. Google Earth uses WGS84, also the default setting at many hobby GPS devices. I have no idea if there is a worldwide standard for stations, possibly for airports???
This issue can account for a few 1000’s of feet in extreme cases.
The more I learn about the way that temperature data is collected, the less I am convinced that AW theory is built on a sound experimental footing at all.
Somebody please correct my broad brush understanding if it is wrong.
1. The whole subject relies 100% on the observation of daily temperatures around the world and the computation of an average temperature based on the just the maxima and minima of the daily readings.
Q: This seems like a very kindergarten way of computing a meaningful number. I can understand the arithmetic, (a+b/2) but is it the best statistical technique available? And does the mean so computed actually have any meaning to plant growth, sea levels, migration of birds etc etc. Has there been any experimental work to show that it does?
2. There is no universally accepted and adhered to way of observing these temperatures. Stations are built to different standards, placed in non-comparable sites, move, disappear, are modified, use different equipment, use different recalibration routines (if any) and are not subject to any regular systematic check of their validity or accuracy. The data is a complete hodge podge and the histories are largely unknown or unrecorded.
3. The purpose of the measurements is to record the daily maxima and minima as noted above. It is easy to imagine circumstances where the recorded temperature will be artificially high…our world is full of portable heat sources…but very difficult to imagine those that make it artificially low. Our world is not full of portable cooling fans. To my mind there is an inherent bias for the recordings to be higher overall than the truth.
4. Many have written eloquently as well about the heat island effect where the progress of urbanisation over the last hundred years or so has meant that previously undisturbed instruments have become progressively more subject to extraneous heat sources ..and so show higher readings. As urbanisation proceeds, the number of undisturbed stations decreases and the heat affected ones increase…once more biasing the record towards higher recordings over time.
5. Once all the data has been collected in the inconsistent and error prone manner shown above, it is sent to, for example, our friends at CRU in Norwich. They then apply ‘adjustments’ to the data based on their ‘skill and knowledge’. The methodology for the adjustments is not published… and may not be kept at all because of the lack of any professional data archiving mechanisms at this place.
The director of CRU does not believe that the UHI effect is of any significance, because a colleague in China produced some data sometime that showed that in China .. in the middle of great political upheavals.. it was only small. And cannot now produce that data once again…maybe he lost it in an office move.
He is (was) also a highly active and influential member of the community whose careers have been made by ‘finding’ global warming and actively proselytising its supposedly damaging effects. Any guesses as to which directions his ‘adjustments’ are likely to be in?
CRU is institutionally averse to any outside scrutiny. Resisting such examination by any and all means is in its DNA. Their self-declared philosophy is to destroy data rather than reveal it.
(Personal note – As an IT manager, losing any data is one of the greatest sins that I could commit…actively destroying it is a mortal sin, and under FOI may well be legally criminal as well)
6. The data so processed is then released to the world as the definitive record of the temperature series. And used as the basis for all sorts of predictions, models, scare stories, cap’n’trade bills and all that malarkey. Hmmmmmm!
Forgive me if I think that this overall process has not been ‘designed’ to get at the absolute truth. The data is collected in an inconsistent manner, and there is no reliable record that describes the exact circumstances of that collection. It is subject to many outside influences that tend to increase the readings over time, not to decrease them.
Once collected it is subject to adjustments according to no agreed or public methodology. There is a clear potential conflict of interest in the institutions making the adjustments.
I set as a task to first year science undergraduates…take this model of raw data collection and processing to the homogenised state, and suggest how it could be better designed to get at the truth of the temperatures. Do not feel shy about writing at length. There is plenty of scope.
Hmm… so those 230 stations should be reclassified as wet bulb readings, eh?
O/T (slightly). In an article in American Thinker (here), Fred Singer says:
Is that claim (re proxy records) correct? Has the evidence for it been published?
He goes on to say:
Again, is that correct?
Is there no way to hold these people accountable for their ill performed work?
“Even more important, weather satellite data, which furnish the best global temperature data for the atmosphere, show essentially no warming between 1979 and 1997.
Again, is that correct?”
Well the RSS data was up in a post a few days ago – so, no it is not correct.
Every one of these stations get serviced at least occasionally. How hard would it be to visit every single site over the course of, say, a year, get a GPS based location, and update the database? It could be done with little or no additional cost above the basic maintenance.
Robin Guenier at November 8, 2010 at 4:11 am http: should look at
//www.drroyspencer.com/latest-global-temperatures/
There he can see that global Satellite temperatures are essentially “flat” until 1997 and the rises as a result of that 1998 El Nino. We then have another elevated “flat” period from 1998 to present with another peak summer 2010 but declining temperatures again due to La Nina. I have flat in “” as there are natural variations from year to year. As can be seen, the recent peak did not exceed 1998. Since 1998 CO2 has increased by more than 20ppm without essentially sending global temperatures upwards. Sea ice N/S is within natural variation and global sea levels are heading down again.
Amazing (65 N)Canada arctic
automatic weather station
still hourly records
temperatures warmer than
(45 N)NYC JFK station–
http://www.ogimet.com/cgi-bin/gsynres?ind=71981&ano=2010&mes=11&day=8&hora=6&min=0&ndays=30
http://www.ogimet.com/cgi-bin/gsynres?ind=74486&ano=2010&mes=11&day=8&hora=6&min=0&ndays=30
This amazing station also
is consistently 10-30 degrees C
hotter than all its surrounding
Canada arctic stations–
Too hot to be water effects
–it must sit atop
an erupting volcano.
Latimer Alder: November 8, 2010 at 3:33 am
Latimer you make many good points.
Your statement:
“Q: This seems like a very kindergarten way of computing a meaningful number. I can understand the arithmetic, (a+b/2) but is it the best statistical technique available?”
Well it got me thinking about a quote I read years ago:
“Given enough data with statistics you can prove anything.”
Sorry I don’t know the source.
Now I’m no statistician but from my reading of events it was choosing the best statistic, the one that will give me the answer I want, some unusual variant of PCA that may yet get Mann in some hot water.
What are these people doing while under the employ of my tax money? If it is your job to make sure temperature data is accurate, why aren’t you catching these outrageous errors? The only thing I can figure is the data gives the output desired and they are using their time figuring out to keep their easy income, such as going on personal crusades decrying how bad global warming is.
Why do keep calling people who are too lazy to do required quality control “scientists”? They are more like fat cats.
Quick. Somebody notify John Abraham and the AGU. Those pesky skeptics are at it again. (See the preceding article on WUWT.)
@Robin
1) Since 1900, there are warming, cooling and warming periods visible in proxy data, here in glaciers:
http://www.ncdc.noaa.gov/paleo/pubs/oerlemans2005/fig3a.jpg
2) Considering the TLT record, Singer is correct.
http://climexp.knmi.nl/data/itlt_gl_1978:1997a.png
HadCRUT/GISS/global SST record shows warming at the same period, which can be from some part attributable to UHI.
Actually getting the raw data would be the easy bit..and your proposal is a fine one.
But the real problem would be to construct the technical, procedural and cultural ‘infrastructure’ to make use of the data so collected.
We have seen in Harry_read_me that CRU for example are absolutely clueless about data archiving and retrieval, that they have no consistent process for handling their ‘adjustments’, that they most definitely do not want any form of outside scrutiny of their work in exchange for their grant money and that their standards of Information Technology disciplines fall far short of those expected of even a talented amateur in the field.
But the most revealing (and worrying) thing that Harry inadvertently revealed is that they are unashamed by this! Charged with keeping one of the three global datasets that may hold the key to ‘the most important problem facing the world’, they are content to bumble along in their shambolic way..occasionally wiping the fag ash and cobwebs off a pile of old Chinese papers just to ensure that they don’t want to let others see them.
They seemingly have never even thought to visit other institutions whose mission is to keep data secure and with meaning. No concept crosses their collective wisdom that others have faced and solved similar problems and that perhaps there are lessons that could be learnt. Nor that their ‘mission; is suffciently important (or so some believe) that they have a professional and social duty to use the highest standards that have been developed…not the lowest.
It will take years, even with a complete change of personnel in such an institution, to get the data they do have into a state where your most helpful suggestion can be fully exploited (which doesn’t mean that a start should not be made).
The changes needed are primarily cultural….to imbue the whole field with the importance of consistent accurate and verifiable data collection. With consistent accurate and verifiable ‘adjustments’ if these prove necessary. With a relentless focus on the data as the only actual truth…not on modelling predictions.
There is a long, long, long way to go. But until we arrive at somewhere much nearer that ideal, everything else that has been done is just castles in the air.
Robin Guenier says:
November 8, 2010 at 4:11 am
“O/T (slightly). In an article in American Thinker (here), Fred Singer says:
Even more important, weather satellite data, which furnish the best global temperature data for the atmosphere, show essentially no warming between 1979 and 1997.
Again, is that correct?”
Yes. RSS satellite data shows no statistically significant global warming 1979-97.
Here’s the data, you can see for yourself.
http://woodfortrees.org/plot/rss/from:1979/to:1997/plot/rss/from:1979/to:1997/trend
Woodfortrees is a great site for checking out what you read on climate issues as you can easily compile your own plots of climate data metrics, link here:-
http://woodfortrees.org/plot/
The fact that 230 stations were found to have coordinates in the sea proves that at least 230 stations are incorrectly assessed for UHI. 230 is the minimum number that are wrong as the method used (land/water masking) only detects those that have this charateristc.
It’s worse than we though! Look at the evidence right here of extensive recent sea level rises! All those points were classified as land previously, so if they’re not now, it must be due to rising sea level.
John S:
As they switched from relying on interpolating coordinates from maps to direct GPS measurements, they have been updating the database. One complication: rather than correct the existing reported coordinates, they enter the new, corrected coordinates as a station location change, leaving the old coordinates as an apparent previous location. Took me about a year and a half to figure this out; meanwhile I wasted a lot of time and effort trying to run document locations where there had never been a station.
Juan S.
Wow. Just wow. Fantastic work Mosh.
And I liked that funny bit about ‘it seemed an easy thing to find and analyze all such cases in GHCN’. Ha ha ha! Cracked me up. I laughed, really did.
Finding and analyzing all cases was so easy in fact – that the folks in charge of the database hadn’t corrected it ? I doubt that. You clearly have a skill set that THEY do not possess.
Now I understand why these are called ‘wet bulb readings’ ….
😉
Hi Mosh,
Nice work; certainly very interesting.
I have a question: If there is frequent inaccuracy, as your work clearly shows, might we not expect that inaccuracy to indicate that stations nowhere near the water to also suffer significant inaccuracies? That is, doesn’t any random inaccuracy in station location almost automatically imply an understatement of night-light based UHI adjustment? Urban areas are generally rather small, so on average any random inaccuracy would (I think) tend to locate the station further away from the brightest regions; it should not matter the direction of the inaccuracy. Placement of stations over water makes the error obvious, but I wonder how many other significant errors exist where the obvious clue of water vs. land is not available.
Don’t like salt water? Go to Northport, Washington. Both GISS and the MMS will put you into the Columbia. For real location check the Surfacestations.org gallery : > )
chu says: “It’s worse than we thought, undetected massive sea level rises.”
Lovely!
Latimer Alder says:
The changes needed are primarily cultural….to imbue the whole field with the importance of consistent accurate and verifiable data collection. With consistent accurate and verifiable ‘adjustments’ if these prove necessary.
I would second that!
Irrespective of which side of the “fence” anyone sits, it ought to be common ground that the quality of these measurements should be first class. When they seem to have nothing else to do, what are we paying for except world class data handling?
Anyone who has ever installed a quality system knows the principle that in a quality system you have as much concern for the smallest/simplest problems such as the position of stations, because if you’re failing with the simple basic things then it is almost certain you are failing with the more complex issues.
We know the present system has no credibility because we know the quality is totally abysmal. That should not be a partisan issue — even if you believe the world is warming due to mankind, you still want to have good accurate data on which to base action.
One of the clearest indicators that global warming is not a serious problem is that we can see that none of the establishments are at all concerned about the abysmal quality of the present compilation of temperature data … poor quality, poor data handling, and a group of “professionals” who seem to spend more time editing wikipedia and real climate than correcting the many and obvious errors in the temperature record! If they don’t care about the temperature record, then why on earth should anyone else?
Wow. Just wow. Great chunk of work Mosh. And I loved the line ‘it seemed an easy thing to find and analyze all such cases in GHCN’. Ha ha ha! Yeah, right. I laughed out loud on that one.
So easy in fact – that the professionals in charge of the database and conducting the analysis know about the issue but don’t care ? I don’t think so.
I think that YOU possess a set of skills and intellectual drive that THEY can’t possibly emulate. Amazing stuff here.
Sure Abrahams’ “Climate Rapid Response Team” was built to work out such failures.
Steven:
What kind of response did you get from NCDC? Were they appreciative of your work? Have they asked for more technical details?
Am traveling and don’t have access to my data to address the question: is this merely an issue of precision (x.xx vs x.xxxxxx) in the database or are these systematic / siting problems?
I’m confused. Shouldn’t the headline read: Stations that are shown on water are actually on land? Are they actually in real life on water or land? I’m guessing the coordinates are wrong. It would be nice to know the ramifications of these errors as well. Once they fix the gps (if that is wrong) what would be change in data?
And this just audits errors in the current sitings. What about previous site locations which may have had much different temperature measurement issues?
Dave says:
November 8, 2010 at 6:14 am
It’s worse than we though! Look at the evidence right here of extensive recent sea level rises! All those points were classified as land previously, so if they’re not now, it must be due to rising sea level.
Not necessarily, Dave. You are making the “warmist” assumption.
It could easily mean that in those areas, the land has been sinking.
LOL
A bit O/T but also relevant. Read on….
The Royal Society is apparently having a bunfight to discuss / promote “Geo-engineering” solutions to the awful Irritable Climate Syndrome shock-horror-disaster.
The BBC invited some tame “boffin” onto their resolutely alarmist Today “news” programme this morning. After briefly mentioning some of the dopey solutions that had been suggested to stop us frying (even as we shiver), he was asked what was his personal favourite “Geo-engineering” wheeze. Interestingly, this “solution” didn’t involve mirrors, white paint or artificial volcanoes. Instead he suggested getting farmers to plant crops with shinier leaves. (It is to be hoped that these wouldn’t be products of GM technology…Aaaargh…the horror…).
The interesting point (and the one relevant to this thread) followed, with his estimate that the “shiney” leaf crops could make a difference of one degree to Global Temperatures!
Hmmmmmmmm.
Perhaps that’s what they mean about ‘green jobs’. Well someone has to take a damp cloth and polish those leaves.
But how much of a temperature increase have we seen so far since the start of the Industrial Revolution?
I wondered what allowance the “models” already include for changes in the ‘shineyness’ of vegetation in that period? Would this allowance be more or less than the allowances for UHI effect, dodgy records, the march of the thermometers, CRU tweaks, the end of the Little Ice Age, the effects of oceanic current fluctuations, moose dung next to Yamal trees and all those other exciting little things that we have learned about on here?
Definitively, worse than we thought.
“Meta-Data”, beyond data, beyond the “twilight zone” 🙂
No wonder those hippies are all screaming about the looming doom of sea level rise.
Bwaaap, haha, see what I did there?
Steven,
These 230 stations are part of what number of stations in current use by GISS?
I would expect many locations on land are mislocated as well and may be improperly classsified as rural or urban depending on the error in location …
I think it is safe to say that nobody has good temperature data including location … and I mean nobody …
We need a to go tabula rossa on this … start over …
Why are visible lights being used to identify population centers in the first place? Is there some reason actual data on the location of cities isn’t used?
I don’t know the source of your quote.
In any case, I recommend a classic on the subject of statistical gamesmanship: “How to Lie with Statistics” by Huff and Geis
Steven,
One question regarding this work: have you verified that the displacement found is not a function of the location data being recorded in NAD27 and Google using NAD83 (or vice versa)? This can cause an apparent shift in location when plotting with Google.
In my former life, mining property development, QA/QC errors of this magnitude would be sufficient to cast serious doubt on all conclusions based on the data and metadata. The errors documented by Mr. Mosher indicate very sloppy work and a high probability that other errors exist in the data.
The discovery of errors of this sort in a mineral deposit database is a signal to prudent investors to consider bailing.
Betting trillions of dollars on conclusions developed from the current GHCN data without thorough search for, and correction off, additional errors is the height of folly.
Mike Haseler,
Its not like they schedule conferences to discuss shortcomings in current temperature records and ways to fix them, right? If you talk to scientists working on the surface temperature records (and there are surprisingly few of them, mostly owing to low budgets to fund ongoing work), you will find that they are quite well-aware of various factors that can lead to bias (station moves, sensor changes, land cover changes, urbanization, poor metadata, etc.), and spend most of their day figuring out how to a) improve the quality of the data and b) detect and correct for bias when it is not possible to remove it through obtaining higher-quality data.
I wouldnt be surprised to see these stations suddenly added to the SST anomlay dataset!
John Marshall says: “This may all be meaningless because, as some physicists say, temperature can only be taken if the system is at equilibrium. The atmosphere is never at equilibrium so any temperature taken is meaningless….”
We take care of this trivial problem by means of a special non-equilibrium algorithm. We can’t tell you what it is, or share the code, but it’s very robust. Twenty-five hundred scientists believe in it. Or maybe fifty. Whatever. When invoking this algorithm, we also burn sage and dance widdershins around a stripbark pine while chanting ‘hey-ya-ya-ya!” wearing nothing but a little woad. “All true Scotsmen” have also approved this algorithm, along with Al Gore’s Happy Ending Club, the Tooth Fairy League, the Union of Concerned Unicorns, the American Association of Phrenologists, the British National Academy of Astrologers, The World Conference of Necromancers, the Phlogiston Conservation Society, the Club of Barstow, and numerous professionals who don’t get paid unless they endorse it. We’re talking consensus, here, folks! Wake up and smell the Kool-Aid!
/s.o.
Re Fred Singer’s interesting claims (that (1) the reported 1977–1997 temperature rise is not seen in the proxy records and (2) that satellite data show “essentially” no warming between 1979 and 1997), thanks jimmi, John Peter, Juraj V and Tenuc (especially for the Woodfortrees link).
Interesting however that (re 2) jimmi says Singer is not correct, John Peter (via Roy Spencer) suggests that he is (temperatures were “flat”), Juraj V says that, although the TLT record show Singer is right, the SST record shows warming whereas Tenuc says that it does not – or at least that it’s “not statistically significant” (it was about 0.1 deg. C.) So I’m still unsure about whether or not Singer got that right. Any further thoughts?
Re (1) (Singer’s intriguing proxy record claim), Jura V’s glacier link seems to me inconclusive – is there any better evidence supporting him?
#
Martin Brumby says:
November 8, 2010 at 7:46 am
“Instead he suggested getting farmers to plant crops with shinier leaves. ”
#
Like Larry Nivens “Ringworld” Sunflowers! BzzzZAP!
David Jones says:
November 8, 2010 at 1:16 am
Nightlights over water can be fishing boats or aerosols dispersing city light vertically. The instrument is sensitive enough to detect both. Or indeed, they can be calibration and/or registration errors, or blooming/bleeding.
##########
yes, the reasons are many as you suggest. The real issue isnt the presence of lights over water, the real issue is stations in dark water and the calculation of the fraction of land the station represents.
For lights over water I can handle that quite simply with the mask or with an even more highly detailed vector shoreline dataset, but its really not an issue since land stations should be on the land.
The problem of nightlights positional error ( >1km) means that you cannot simply register the station to the nightlights.. without the possibility of error.
using pitch black stations helps but ONLY in the developed world as nightlights does not track with population in the undeveloped world in the same fashion ( see Dodd and Pachuri)
(and there are surprisingly few of them, mostly owing to low budgets to fund ongoing work)
Zeke,
Why no money for such important work? If the numbers are innaccurate you get meaningless squiggly lines.
Maybe it’s not very important.
Andrew
Zeke Hausfather says:
November 8, 2010 at 9:24 am
Mike Haseler,
Its not like they schedule conferences to discuss shortcomings in current temperature records and ways to fix them, right? If you talk to scientists working on the surface temperature records (and there are surprisingly few of them, mostly owing to low budgets to fund ongoing work), you will find that they are quite well-aware of various factors that can lead to bias (station moves, sensor changes, land cover changes, urbanization, poor metadata, etc.), and spend most of their day figuring out how to a) improve the quality of the data and b) detect and correct for bias when it is not possible to remove it through obtaining higher-quality data.
#########
well zeke in some cases that is correct. In other cases I have seen communication from certain well funded people who resist making fixes, and who continue to believe that certain data is more accurate than the actual source documents indicate. We will wait and see if they make the changes or not. In some cases they are not even aware that the source documents have been deprecated and the PI believes the old data should not be used. Just sayin.
Taphonomic says:
November 8, 2010 at 8:40 am
Steven,
One question regarding this work: have you verified that the displacement found is not a function of the location data being recorded in NAD27 and Google using NAD83 (or vice versa)? This can cause an apparent shift in location when plotting with Google.
# Thats a smart question.
I did some tests with better station location data, correcting the mistaken locations in WMO and GHCN. That put those test stations on the land where they belong.
For some cases like Atolls its going to be very difficult.
WRT my graphics, the google earth image is loaded into R and then transformed so that its projection matches the projection of of Nightlights. I had assistance from experts on that part of the task to make sure that there wasnt any issue there.
Also, if you look at the NVDI flags for the stations you will find that in their prior work they also could se that certain land stations were in the water owning to the NVDI value they recorded. Basically the inventory was not DESIGNED to be used in conjunction with a product like nightlights.
On the other hand the error rate is very small ( 230 out of 7280 stations) and it WILL NOT change the final numbers in any substantial way. That’s no excuse for not using the best data.
Neal says:
November 8, 2010 at 8:23 am
Why are visible lights being used to identify population centers in the first place? Is there some reason actual data on the location of cities isn’t used?
#####
asked that question 3 years ago.
j ferguson says:
November 8, 2010 at 8:06 am
Steven,
These 230 stations are part of what number of stations in current use by GISS?
#####
I havent run the GISS numbers.
1. Its entirely possible that NONE of these mistakes carry over into GISS
2. I believe ( looking at their page) that GISS is aware of some of the problems so
they may be fixing it.
3. WMO has a new improved dataset out, that I will use for corrections later this week
LearDog says:
November 8, 2010 at 7:18 am
Am traveling and don’t have access to my data to address the question: is this merely an issue of precision (x.xx vs x.xxxxxx) in the database or are these systematic / siting problems?
## both, less a precision issue with WMO stations, but both precision ( depending on the source) and flat wrong.
Gary says:
November 8, 2010 at 7:27 am
And this just audits errors in the current sitings. What about previous site locations which may have had much different temperature measurement issues?
####
the historical dimension is mind numbing. Bascially, and I havent got to this, some of the sources GHCN and GISS use are estimates. No problem there EXCEPT where you try to register an estimate to a precise dataset like nightlights. Throwing darts.
Robin:
The problem in the proxy record is, in fact, well documented. If you go to Climate Audit, there are extended discussions of the issue – it is a problem which has led the likes of the CRU-gang and other Team members either to truncate their data or use other “tricks” to “hide the decline”. The problem they face is that many of the proxies used (tree rings, in particular), show no “warming” in the post-1970 period. They take a number of dubious approaches, including tacking on the “thermometer record” to the post-1960. That record, carefully “managed” by the various agencies, does show warming in the latter quarter of the 20th century.
Take at look at Climate Audit. There’s a good post entitled “The Trick”, dated 26 November 2009 that explains the problems that the warmists have faced with the proxy record. See: http://climateaudit.org/2009/11/26/the-trick/. (Sorry, not sure how to paste a live link).
orkneygal says:
November 8, 2010 at 2:24 am
230 Stations.
Is that a lot?
### I dont address that. It depends how and IF these stations actually get used.
I’m about 5 steps away from that question. people always want to rush the answer.
Thats how you make small mistakes.
Does it matter?
If you want the best answer, yes it matters. If your happy with a little slop, probably wont matter.
Is the Port Arthur station still being used for official temperatures? Port Arthur joined with Fort William in 1970 and created the city of Thunder Bay. The Environment Canada temperatures come from the airport which is not shown. If you follow the black line on lower part of picture the airport is outside the last yellow line in your picture.
That station is probably for ships entering the port.
I do not have the math skills to follow up this idea, but I was wondering: if the temps and CO2 values are non linear data sets, could some facet of Chaos Theory be used to confirm their statical validity by straightforward calculation, rather the individual examination of how the data was collected at each site? (Current statistical tools seem not to be up to the job.) Specifically, since these are essentially bound data sets, i.e., temps will never go to absolute zero and CO2 will never go to 100%, (Or if either event does occur, we will not care.) could the math associated with “strange attractors” be a useful tool? Anyone with a thought?
I have a quick question regarding potential errors.
Steve says the error rate will be small and will not influence the final numbers, I don’t knowif this is a valid statement or not. Clearly, if assessment of UHI is based on some factors (e.g. nightlights), and other corection factors, such as station drop outs are ‘infilled’ using nearby (supposedly similar) station data, could there not be a compounding effect from say, an adjacent station to one of the 230 having been ‘homogenised’ using the less reliable station data? What I mean is, could there be a slight knock on effect?
GHCN 83897 Florianopolis, Brazil.
http://maps.google.com/maps?q=-27.58+-48.57
@zeke hausfather
Now I know that the whole ‘field’ is in deep deep trouble. There is money coming out of people’s ears to do ‘climate change’ research. No matter how wacko a project, as long as it mentions AGW in its application it gets fast tracked to the front of the queue for spondulix.
And yet without accurate raw data that actually means something, there is nothing to study. Without experimental numbers one can bugger about with models until blue in the face or pin in the cheeks and it will all be entirely pointless. Am I the only one capable of grasping this fundamental point?
You say that the problems are widely known but the few people working on this area are ‘underfunded’. Well I ain’t met somebody living off other people’s hard-earned taxes yet who didn’t claim that they hadn’t been hosed down with quite enough luvverly lolly. But to say that the problems with data collection are known and understood but nobody has allocated enough money to fix them is surely criminal.
What of the IPCC – where in the reports does it say ‘actually chaps we know that this is all complete nonsense as we have no good data, but we’re going to devote all our individual and collective efforts over the next five years to getting a decent data collection mechanism together. Once we’ve done that we might be able to draw some sensible conclusions.
What of the ‘learned societies’. Where are they standing up and asserting that this is the most important problem in the whole field. Or the Hockey Team..brandishing their Nobel prize ( I shudder to write this without retching) an demanding that they cannot produce anything even remotely scientific without firm foundations.
I hear a devastating silence. Perhaps they are all so convinced about the rightness of their models that they have forgotten how to do experiments and data collection. Or have become so detached from the planet that they just don’t care anymore.
Whatever the reason, they bring deserved ridicule and contempt on their field. How can you tell when a ‘climate scientist is using robust data?’. And – you don’t have to, Such a thing does not exist.
Pitiful and contemptible.
Ian:
Yes, I’m broadly familiar with the CRU/proxy issue – largely, as you say, associated with tree rings. But I suggest that Singer is making a point that is only slightly relevant to that and arguably directly relevant to this thread. What I think he’s saying is that the 1910-1940 warming can be seen in both the instrumental and proxy records – so that, in effect, each verifies the other. In contrast however, the 1977-1997 warming is seen in the (surface) instrument record but cannot be seen in the proxy records (presumably not confined to tree rings). To say the least, that seems odd. And surely should ring an alarm bell – and especially so if satellite data for the same period shows essentially no warming.
My question was (and is): is Singer correct in claiming that the 1977-1997 warming is not seen in the proxy record?
Kev-in-UK
Looking at the whole chain is on my todo list. only so many hours
Not only GISS. Nicaragua accidentally invaded Costa Rica last week because the Nicaraguan army is using Google Maps for (inaccurate) navigation.
juanslayton says:
November 8, 2010 at 6:18 am
Now that to me was a WOW! moment. Just correcting the location co-ordinates logged as a station change.
DaveE.
@Steve Mosher
yeah, I realise it’s a big issue!
Are you doing a ‘project’ whereby others can perhaps help? Many hands make light work and all that….
it could be worthwhile ‘delegating’ some tasks, so long as suitably instructed and suitable written records kept (don’t wanna end up like Jones, eh?) – just a thought. (but I do appreciate that one can really only ‘trust’ ones own work sometimes)
Well Steven I don’t quite see what all the fuss is about. They are only off by 300 km; and Hansen thinks that the Temperature anomalies are good to 1200 km; so it looks like a direct hit bullseye to me; well maybe it’s some other bull component.
I do hope our Nuke missile targetting is a little bit closer to that. Man would I be PO’d if some fishing buddy gave me the GPS of his favorite fishing Hotspot; and it turned out to be in a Bar in Lodi.
You chaps in the field do run into some crazy situations though.
And just think about it; somebody wants to make cars without drivers; how does that grab you ?
BS Footprint says:
November 8, 2010 at 8:31 am
In any case, I recommend a classic on the subject of statistical gamesmanship: “How to Lie with Statistics” by Huff and Geis
============================================================
It is indeed a classic. I read it when I was in high school in the 1950’s. But it discusses very elementary statistics. The statistical discussions here at WUWT often boggle my brain, although I learn a lot.
Early in my career, a statistician said to me “too many engineers think statistics is a black box into which you can pour bad data, then crank out good answers” Judging from the present topic, many “climate scientists” think the same thing.
Kev in Uk
The tasks I could hand off will come next.
basically, after I finish cleaning the metadata I’ll do this:
Publish a list of around ( I hope) 500 or so stations with a google tour.
Then folks could go look at each of those sites and check that my algorithm worked.
@Steve Mosher:
It would seem to me that there is an error in the coordinates of the weather stations, since they would not be really floating in the water. So these stations are on a coast. The amount of mis-location would result in an [error] in night light analysis. This does indeed appear to be an error. It would be interesting to learn what is the source of the location error.
Looking at the bigger picture, assuming the error is random in nature, one would expect some errors in the other direction, where coastal locations are put further inland than they should, and more nightlights would be found surrounding the station, than there are in reality.
So what would the results of these errors do the the UHI corrections?
In some cases,where the stations were mis-located over water, stations might be labeled rural , that would ordinarily have been labeled urban. On the other hand some stations which moved inland, might have been labeled rural if located correctly, but ended up labeled urban. In some cases the mislocation may not have made a difference.
You didn’t say how many stations were examined to get the number 230. Is it the 1034 stations with long runs of continuous data, or the total of 7200 GHCN stations.
Even if the rural versus urban classifications have some inaccuracy associated with them, the differences in trends between them are so small, about 005DegC/ century, that the effect of the corrections for UHI can be expected to remain small.
I should have written “result in an error in night light analysis”in the first paragraph in my above post.
eadler says:
November 8, 2010 at 5:11 pm
@Steve Mosher:
It would seem to me that there is an error in the coordinates of the weather stations, since they would not be really floating in the water. So these stations are on a coast. The amount of mis-location would result in an [error] in night light analysis. This does indeed appear to be an error. It would be interesting to learn what is the source of the location error.
################
The location errors result from rounding the location data given by source documents or from errors in source documents or from source documents having limited precision.
################
Looking at the bigger picture, assuming the error is random in nature, one would expect some errors in the other direction, where coastal locations are put further inland than they should, and more nightlights would be found surrounding the station, than there are in reality.
######################
I have done some limited “first look” type analysis of the errors. mean error is around .02 degrees latitude. Longitude error is slightly more as would be expected. When i use corrected locations you see some adjustments in the rural/urban designations with some rural becoming urban and some urban becoming rural. WMO is dropping new data on the 10th so I’ve held off doing any final look at this till I have their fresh data. In general i would look at defining rural not as just one pixel being dark, but rather a region around the site.. to account for the positional errors in nightlights. thinking of something like a 5-10km zone, but need some numbers to support such a decision.
###############
So what would the results of these errors do the the UHI corrections?
In some cases,where the stations were mis-located over water, stations might be labeled rural , that would ordinarily have been labeled urban. On the other hand some stations which moved inland, might have been labeled rural if located correctly, but ended up labeled urban. In some cases the mislocation may not have made a difference.
####################
erarly in this series i argued that the errors cannot make a substantial difference. But that needs quantifying. But what you say is true. I just try to put numbers on the statements.
#############
You didn’t say how many stations were examined to get the number 230. Is it the 1034 stations with long runs of continuous data, or the total of 7200 GHCN stations.
##########################
its the total 7280. I’d like to fix the metadata so:
1. People like Nick Stokes and JeffId who use all the stations could benefit
2. people like Zeke and I who use subsets could benefit.
I actually like Nick and jeffId/RomanMs approach better from a statistical standpoint but I’m curious about what I will see if I only select a smaller number of stations with long histories and good metadata. Curious.
#################
Even if the rural versus urban classifications have some inaccuracy associated with them, the differences in trends between them are so small, about 005DegC/ century, that the effect of the corrections for UHI can be expected to remain small.
##########
Ive never expectred to see anything more than a UHI contribution that was greater than .3C. i would not be shocked with a bias of less than .1C. I’d do an over/under bet at .15C. I think Jones himself said estimates ranged between 0 and .3C. I see nothing to change that range. Hope that’s clear.
Steven, I couldn’t go by you statement here without commenting. Where exactly do you pull this 0.3 ºC maximum figure for UHI? My only recollection of an empirical figure from real data, actually some 10,000 stations, is Dr. Spencer’s work and published here month’s ago. It clearly shows the UHI being many times that not only in the largest cities, depending on population, of more like 1.0-1.2ºC. As his research showed even small towns can have a rather large UHI (0.4-0.7ºC) and if the locations by GHCN used by GISS is off by even a few kilometers this can definitely give the impression that non-urban areas are showing warming where the warming is only occurring tightly within or very near (as am airport) to the urban area. That is where the thermometers are.
http://www.drroyspencer.com/wp-content/uploads/ISH-UHI-warming-global-by-year.jpg
Do you somehow discredit the work by Dr. Spencer that this data was indicating?
I think your work here is much more important than even you might give it. An error of location could have huge implications of whether this is all we are seeing in this GW fiasco, individual local warming of one or a few hundred square kilometers around urban areas that is, however small, and not global world-wide warming.
Here, I’ll lookup Dr. Spencer’s posts here on this matter:
http://wattsupwiththat.com/2010/03/03/spencer-using-hourly-surface-dat-to-gauge-uhi-by-population-density/
http://wattsupwiththat.com/2010/03/04/spencers-uhi-vs-population-project-an-update/
http://wattsupwiththat.com/2010/03/10/spencer-global-urban-heat-island-effect-study-an-update/
Jimmi,
take a look at Wood for Trees:
http://www.woodfortrees.org/plot/uah/from:1979/to:1997/trend/plot/uah/from:1979/to:1997
Yes it goes up a little, but, with the accuracy of the measurements I think this falls into the not significant range!! Over a period of 20 years the trend rises about .06C.
Over 100 years that would be .3C. Jimmi, I can’t believe you are worried about less than .5C over 100 years!!
hat is .a bit less thTan the error
Oh, and Jimmi,
if you do the same graphs for the full satellite period you find that it is about .3c for 30 years!! Still not anywhere close to the IPCC’s 2c+ for 100 years and still pretty small in relation to the error.
Steven mosher @
November 8, 2010 at 11:39 am
_________________________
Thank you for your kind response.
I am actually interested in the question about the relative importance of the 230 stations.
Perhaps I should have asked the question a bit differently and more precisely.
In any case, your later comment about the 7820 total stations gave me a useful measure and perspective while your work continues..
Again, thank you for your response
Let’s have a look at Czech station of GHCN V2:
http://www.unur.com/climate/ghcn-v2/611/11464.html
Milesovka:
Coordinates correct (50.554924,13.931301 according to Googlemaps).
However, then there’s this: “Mountainous valley or at least not on the top of a mountain”
The station was specifically built at the very mountain top with the aim of studying storms and lightning!
>>Latimer
>>1. It relies on … the computation of an average temperature based on the just the maxima and minima of the daily readings.
Sure. So if we have 30oc temperature all day and night, except for a 2-hour drop to 10oc overnight, we can be sure that on average it was a coolish day.
Husten’s got a point. There are a lot of different mapping datums out there and it definitely matters which one you use. 200m error is easy in Australia if one set of coords is in WGS84 and the other is AGD66, that’s without any precision/rounding errors or simple human error transposing digital readouts to paper and then back to digital data which will compound things further. Maybe I looked in the wrong place but I couldn’t find a reported datum for the positions data in the metadata. That’ s a bit like recording a number without specifying the units used.
Robin:
You clearly are aware that there is a divergence problem with the tree-ring proxies. Singer’s article was very high level – my guess is that this is what he was referring to. You might try an email to directly to the source : he’s involved with SEPP, so try through that website (http://www.sepp.org/).
Thanks, Ian. Singer seems to be making an important point but I would like to see the evidence. I’ll try the SEPP link.
I was rather disappointed that no one on WUWT seemed able to help.
Very nicely done.
You might also find it interesting to compare those over the ocean with their elevation. It would help sort out the “atoll” station a 1 m elevation from the “mountain off shore” that’s in the ocean but 1000 m up…
Zeke Hausfather says:
November 8, 2010 at 9:24 am
“Mike Haseler,
Its not like they schedule conferences to discuss shortcomings in current temperature records and ways to fix them, right? If you talk to scientists working on the surface temperature records (and there are surprisingly few of them, mostly owing to low budgets to fund ongoing work), […]”
So you confirm that nearly all the CAGW money is dumped into supercomputer modeling, and nearly nothing into acquiring real world data. One could assume incompetence, or one could assume malice.
For simple defensive reasons, i prefer to assume malice.