One wonders why the story of a new paper covered on WUWT: NCAR: Number of record highs beat record lows – if you believe the quality of data from the weather stations did not include the 1930’s and 1940’s and earlier, conspicuously missing from the NCAR graphic below:

From: “The relative increase of record high maximum temperatures compared to record low minimum temperatures in the U.S.”Authors: Gerald A. Meehl, Claudia Tebaldi, Guy Walton, David Easterling, and Larry McDaniel Publication: Geophysical Research Letters (in press)
The answer: those decades are inconvenient to the conclusion Meehl makes from a cherrypicked portion of the US data. There were many many temperature records during this period. For example, Richard Alan Keen writes in email:
My book, Skywatch West, covers the weather and climate of the 11 western states, plus Alaska, plus 6 western Canadian provincs and territories.
The chapter on temperature extremes includes a chart of the occurrences (by decade) of the all-time extreme temperatures for each of the 18 states, provinces, and territories (a total of 36 records in all).
Some fun statistics from this are:
- Of the all-time record maximum temperatures, 10 occurred before 1940 (the first six decades), and 8 after (the second six decades).
- For record minimum temperatures, the reverse is true: 8 records before 1940, 10 afterwards.
- Half of the records – 8 maximum and 10 minimum, a total of 18 – occurred during the middle three decades of the 1930’s, 40’s, and 50’s, and of these nearly a third of the total (10) were during the 1930’s alone.
- No records occurred in the 2000’s up to the publication date of the book (2004). Since then Arizona’s record maximum was tied, but not broken, in 2007.
cheers, Rich
Here is his graphic:

Granted this is not the entire USA dataset, only western states, and one could say that I’m engaging in the same sort of cherrypicking that Meehl et al engages in by illustrating it here. But there’s more.
Let’s look at all the US data then. Last year in this thread on Climate audit David Smith writes:
The graph in #127 may be overly influenced by single extreme heat waves or cold snaps. So, here’s a look at broader populations.
The first is a look at the decades in which summer high temperature records were set. This covers the contiguous US for the three typically hottest months (June/July/August). A single nationwide event would affect the records for one month but not for all three, so this plot should be less-influenced by single extreme events.
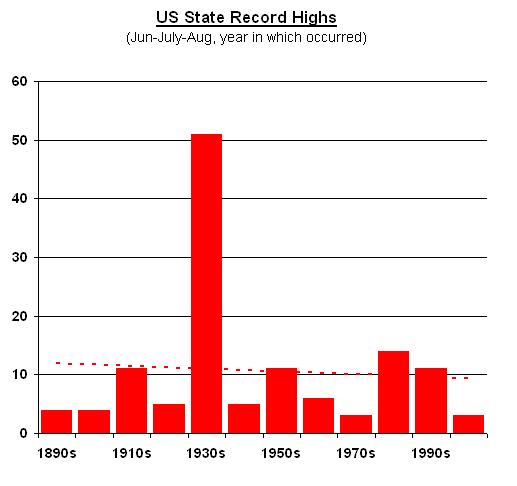
The appearance is similar to the record high plot of #127.
Here is a similar plot except that it is for record lows in December, January and February:
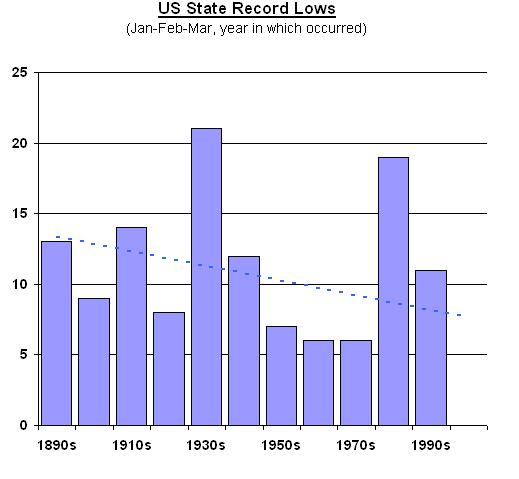
There appears to be a modest downward trend in extreme cold events.
(Note: The final bar in each chart covers 2000-2003 (records posted as of May 2004) and is prorated so as to make an apples-to-apples visual display.)
Here’s the combination of the two:

Conclusion – the 1930s in the US were rough.
Note: The trendlines for all three graphs are essentially flat (no trend) if the prorated early 2000s are excluded from the trend calculations.
Maybe someone has linked to this already:
http://newsbusters.org/blogs/tim-graham/2009/11/15/newsweek-admits-74-percent-gore-letters-are-critical-fail-publish-any
Another example of media manipulation.
The Journals and scientists that publish this nonsense are now going to get caught out everytime because of the internet, data availability and very able statisticians. They will HAVE to adapt or perish. You wonder whether it is worthwhile subscribing anymore to these journals… I am amazed that the journal editors are not obviously checking the raw data before accepting submissions or before letting IPCC friendly reviewers make a judgment……This is another one that will only boost the skeptics viewpoint.
Conclusion – the 1930s in the US were rough.
Assignment: Go find someone from the 30’s who remembers what it was like.
The stories I am getting from No. Calif. are it was no picnic here.
What was it like where you live?
Pointing to broken records as proof of a trend is meaningless anyway. Records will always be broken.
This is nothing new. IT’s funny how you’d think they’d want to include it (“look how high it is!”) but b/c it’s so high, it causes future trends to go down, lol.
THis is no different than the standard method of using charts incorrectly, when putting the lower limit of the Y-axis at some number other than zero, thus forcing a look of “anomolies”, visually accentuating the difference between values.
It’s just another “buyer beware” thing in my opinion. Same with voting. We have the power to stop this nonsense…all we have to do is vote these hucksters out.
rbateman Said:
“Conclusion – the 1930s in the US were rough.
Assignment: Go find someone from the 30’s who remembers what it was like.
The stories I am getting from No. Calif. are it was no picnic here.
What was it like where you live?”
The internet has plenty of stories:
The most visible evidence of how dry the 1930s became was the dust storm. Tons of topsoil were blown off barren fields and carried in storm clouds for hundreds of miles. Technically, the driest region of the Plains – southeastern Colorado, southwest Kansas and the panhandles of Oklahoma and Texas – became known as the Dust Bowl, and many dust storms started there. But the entire region, and eventually the entire country, was affected…
“The impact is like a shovelful of fine sand flung against the face,” Avis D. Carlson wrote in a New Republic article. “People caught in their own yards grope for the doorstep. Cars come to a standstill, for no light in the world can penetrate that swirling murk… We live with the dust, eat it, sleep with it, watch it strip us of possessions and the hope of possessions….
The impact of the Dust Bowl was felt all over the U.S. During the same April as Black Sunday, 1935, one of FDR’s advisors, Hugh Hammond Bennett, was in Washington D.C. on his way to testify before Congress about the need for soil conservation legislation. A dust storm arrived in Washington all the way from the Great Plains. As a dusty gloom spread over the nation’s capital and blotted out the sun, Bennett explained, “This, gentlemen, is what I have been talking about.”
http://www.livinghistoryfarm.org/farminginthe30s/water_02.html
Now all the Soil conservation methods introduced such as grass filter strips, fence line tree wind breaks are about to be eradicated by Waxman’s new Food Bill HR 2749 that has already passed the house.
See HR 2749: Food Safety’s Scorched Earth Policy: http://farmwars.info/?p=1284
This illustrates that the observed warming is not the world getting warmer so much as it is the world getting less cool. Interestingly enough, this is the type of pattern we expect to see from the UHI effect, where asphalt concrete and steel gain take longer to radiate heat than the surrounding natural lanscape.
My Parents:Pop an Eastern Oregon Cowboy-tophand of the BarMC- had stories of streams drying up cattle dying on the range,-of NE Oregon.Mom grew up in the
NW Kansas are she was the daughter of a Railroad Agent and spent time teaching
the Rancher’s kids of Smith County in One room schools .This was the Dust Bowl.She had to place towels in window sills to keep the dust out.Drive with the headlights on
in her 1919 whippet(quite a car for it’s day BTW) .Pop drove his Model A pickup
and in 1933-34-35 fought several forest fires that were only controlled by what passed for winter….
How about that? Mr. P Gosselin (05:25:24) :
Bruce Hall has done a similar analysis:
http://hallofrecord.blogspot.com/2009/11/critique-of-october-2009-ncar-study.html
I’ve never understood the rational behind tracking daily max-min temperatures except perhaps it’s fun. I’m willing to bet a lot of these record breakers are relatively small. A day at 87 tops a day at 86 in the books.
In any case, the number of extremes highly depends upon the values of previous extremes. Assuming most of the maxima/minima have already been hit, one would expect a downward trend in their numbers.
There is also a problem with binning the counts by decades. Counts from 1999 are lumped with counts from 1990 when perhaps they should be lumped with 2000. This only makes sense (and not much at that) if the data were cyclical.
Rather than perpetrating this questionable statistical exercise, why not point out the real problems associated with it ?
Maybe we have used up all the records for our current climate. Additionally if you stop looking then there are fewer records. Has the number of surface stations used in the temperature product been reduced? Has that reduction also been carried forward into the Min Max record product? Of course has the station siting had an effect on the records?
>>>Go find someone from the 30’s who remembers
>>>what it was like.
You mean someone like Wiki? Dirty Thirties, they were called, apparently.
http://en.wikipedia.org/wiki/Dust_Bowl
.
.
Wiki also has this, which suggests that the Dust Bowl was not simply bad agriculture.
“the most severe heat wave in the modern history of North America.”
http://en.wikipedia.org/wiki/1936_North_American_heat_wave
It must have been all those CO2 emissions.
.
Finally. Temperature data reported as a 3 month average. The cyclical nature of these records would be less choppy if the 3 month averages were reported thus as a moving 3-month average:
JFM
FMA
MAM
AMJ
MJJ
JJA
JAS
ASO
SON
OND
NDJ
DJF
and back to
JFM
Hmmm, a Caspar Amann associate?
DAV (06:22:43) : “Assuming most of the maxima/minima have already been hit, one would expect a downward trend in their numbers.”
There are ways around this. One is to take that theoretical expectation and remove it and see what the departures look like. It would be pretty easy, just have a y intercept at the maximum possible number of records and exponentially decay to an asymptote at zero.
The second way, which was done by Bruce (see my post above) is to give a tie to the newer record. This is not such a good method, however because it turns a downward bias into an upward bias, and means that records in the past will slowly dissappear even if they aren’t surpassed.
They tried to get rid of the Medieval Warm Period. Are they trying to get rid of the Dust Bowl years too? Maybe they just didn’t consider how quickly people would be reminded of the 1930’s and how that would make them look suspect.
Read Steinbecks ‘grapes of wrath’ that will tell you how hot it was in the US during the 1930’s.
Tonyb
It must have been a difficult time to live through the depression, drought, and the dust bowl. It makes me sympathetic to my grandparents for always yelling about me cleaning my plate, every drop, when eating because, they said, not everyone used to have a full plate of food to eat.
This type of “analysis” is absurd as is the paper by Meehl et al. You can have more records set in the 1930s but if you are still adding 10 to 20% as many records going forwards each decade, you could be adding on to the records of the thirties (its harder to break the thirties record so you do it fewer times). Imagine this was a graph for one place, then each record added, even if the number is fewer going forward would make it hotter than the 30s for those days. Similarly, for track and field: imagine the number of times the one mile race record was broken in each decade. You may find a fair number in the 1950s and 1960s and then it slows down, but each time it is broken, it is a new record – faster than in the 50s and 60s.
It is not only to be expected that the number of records going forward get fewer on average, but, if the records are a result of random variation as many sceptics believe, then predicting the number going forward is possible using permutations. Take the last record in your series and one can expect on average: the natural logarithm of “n” records going forward were “n” = number of years (or decades in this instance). I don’t have time but one could check out the randomness of the records in these articles going forward from, say, the decade of 1900 using this simple test and, more exciting still, can predict the average number of new records going forward (anyone?).
My Dad was a teenager in the 30’s. He lived in Memphis Tn. He tells of people driving their cattle from the Arkansas side of the river (Mississippi) to islands in the middle of the river due to lack of water any distance from the river. OF course this caused over grazing on the islands and soon the cattle were dying by the thousands. Dad said that you could see the carcasses floating down the river for months. He also mentions that houses back then were not insulated or nearly as air tight and the dust was everywhere. Dad will be 92 in March and is very lucid in his memory. According to him the 30’s were a tough time for real.
Bill Derryberry
I pay attention mainly to my local environment, which at present means southeastern Wyoming, but I have noticed among weather records for this area the disproportionate number of heavy snowfalls and outbreaks of arctic air that occurred after 1950 as opposed to before 1950. Mr. Keen now shows that this is a general pattern over a much larger region.
There are lies, there are damned lies, and then there are statistics.
I have learned never believe a dataset. It is too easy to think that data does anything but help explain and model the world. Our Datasets are imperfect but our interpretation can be even worse.
This is not to say don’t use them, just don’t simply believe them, even if you modeled it yourself. I cannot tell you how many times one mistake, or a skipped observation period, ( such as not placing in the 1930’s ) will give me a different answer then what I expected.
It is unfortunate that the press gets a hold of things like this and touts it rather then critically examine it.
Bruckner8 wrote: It’s just another “buyer beware” thing in my opinion. Same with voting. We have the power to stop this nonsense…all we have to do is vote these hucksters out.
——————————————————–
Try voting out the EPA. Not gonna happen.
Or the IPCC, for that matter.
I’m not sure how the ratio of highs to lows will be affected, but it seems to me that the metric should really be number of record highs (lows) for the previous x-year period. Sure, you will eliminate drift of average (whatever that really means), but otherwise, the record high(low) will eventually approach zero as each record will necessarily need to be further out on the distribution. All time records today may be 3-sigma events, but once they’re records, it will take 4- and 5-sigma events in the future to become a record. So…how is the metric of record highs and lows useful anyway?
Okay. I know my last post was naive. Therefore, because it doesn’t really add to the discussion, I’ll retract it.
The original study was a strawman anyway. It only proves that it is getting warmer, which I am sure we all knew. What it does not prove is that the warming was unprecedented, which it is not, which we all knew anyway.
ralph (06:39:04) :
No, not wiki nor any other internet site. Find a real person who lived and breathed in that time. Like this:
Mr. Bailey: – It was terribly hot & dry. Then the locusts came and ate most of the hay in the fields. Then the catepillars came and ate whatever was left. The cattle starved in the fields.
That was 1933, the 2nd year is was extremely hot & dry. The herds were thinned heavily.
Then came the snows in 1937 and 1938. Normally snow-free winter rangelands got 4-5 feet, and the cattle were trapped & died in thier tracks. And it was still hot & dry in the summers. That ended a lot of cattlegrazing in No. Calif.
My conclusion:
There were no cosmic rays in the 1930s.
No clouds at night: colder.
No clouds in the daytime: hotter.
Elementary, Watts.
Are Phil Clarke and Joel Shore going to weigh in on this?
Has either one taken a stand on the US temperature record and the adjustments made to them?
.
.
Andrew (07:13:13) : There are ways around this.…The second way …
I’m not sure what you’re getting at. Get around what? My point was that the whole exercise is meaningless — not to mention silly — because it adds little understanding about anything.
If 50 record highs had been seen in the years 1990-2000, just exactly what information would have been conveyed? It’s also impossible to state how many SHOULD have occurred, so a qualitative statement (such as “more/less than expected” or “more/less than normal”) can’t be made. What is the value of the knowledge of the number of records exceeded in any give decade?
More than likely, all we are learning is that the length of the record is too short.
For a discussion on diminishing returns see: http://www.numberwatch.co.uk/record.htm
My grandparents on my mothers side moved to Colorado in about 1917, and my Mother grew up in the heart of the depression years. She told me that she ate oat meal for breakfast every day for years, because it was the cheapest filling breakfast my Grandmother could make for her. She also tended to be frugal with food, and saved things that might be useful or repaired rather than throwing them away and buying new.
As I was growing up, I did not really appreciate the seriousness of the dust bowl years until the 1970’s when I lived down in Rocky Ford Colorado for a time. This area is on the north western edge of the area we now call the dust bowl.
I was poking around the Pawnee National Grasslands near Rocky Ford and south of La Junta when I found myself in the middle of an abandoned dust bowl era farm. The fence posts only had a few inches protruding above the ground, having been buried by 4 ft deep drifts of blowing dust. The remaining buildings were buried to their window sills in dirt. It was very sobering to walk around that homestead and realize that someone worked that property for years before it was buried in blowing dust and dirt in a matter of weeks/months.
Even today in that area blowing dust is still a major problem. My front door on the house I rented faced west and following wind storms, I would sweep up several dust pans filled to the brim with dust that got past the doors weather seals. When the wind was really blowing the front door would howl a dull moaning sound as the brass weather strip vibrated from the wind blowing past it. If you opened the front door when the wind was blowing, it would pressurize the house enough to blow the access panel for the attic all the way to the opposite end of the house’s attic.
It was a miserable gritty time, even in a relatively modern home, I cannot imagine living with that sort of conditions day in and day out for months or years.
The classic pictures of walls of blowing dust from the dust bowl era were taken just a few hours drive south east of where I lived. It is very easy to imagine the conditions created by over grazing, and poor land management of the period after living in that area for a while.
When you realize what you are looking for, you can see the signature of that era even today all over that part of the country. Lines of very short fence posts, the tops of wheels of farm equipment poking out of the ground, and the clear pattern of dust dunes in the fields that have not been plowed for agriculture since then. That pattern was most visible right after a very light dusting of snow or heavy frost when the sun thawed the south east face of the dust dunes first as it came up in the morning but the back side of the humps were still covered with white.
Larry
TonyB,
The ‘Grapes of Wrath’ should be required reading for pro climate changers. Unfortunately, too many people today don’t read literature or try to understand the world before their present occupation of it.
Can’t imagine a dopier statistic. Even with a static climate, records would tend to decrease statistically over time. UHI will tend to keep the hot records breaking. Tells nothing.
I see greenfyre has attempted to dismantle these arguments. You might want to respond, Mr. Watts. At a cursory inspection he makes some good points. I will have to reread your posts more carefully before I reread his.
REPLY: Greenfyre aka the Canadian bug man, doesn’t rate a response due to the nasty labels and invective he uses to describe me and others. His language has branded him as hateful towards people with views contrary to his. But thanks for the tip. – A
I’m not sure it’s valid to use the state temperature records in this manner, is it? The absolute numbers of record highs or lows will be influenced most heavily by the installation times of stations. In the post-homestead West, a lot of new stations being added in the early part of the 20th century would mean record temperatures would be recorded much more frequently. Record highs and lows would then decrease as the data accumulated. If you remove stations, the opposite would happen – less record temperatures found.
RE: John Silver (10:45:21)
There were no jet planes in the 1930s.
I was just at greenfyre’s site. He is trying to ride on Anthony’s coattails. Purely ad hom, no science whatsoever. Very sad and weak. Makes us Canadians look bad.
My initial comment has been deleted. I fully expect the second to be so. I did not “meet the requirements” for comment. 8^(
A graph of new highs and lows over a hundred years is meaningless, for the simple reason that in the first few years there is less data to compare to, so there will be more record highs and lows. At the end of the period, it will be much harder to create a new high or low, since it is being compared to more data. So, the only real measure that makes any sense is the actual highs and lows, not the records made.
Meaningless in several ways.
1) Seasons don’t follow the calendar for one, making the ridiculous assumption that the number of days in each season stayed the same, a shift as much as 4 hours in the season cycle would probably cause broken temperature records. I’m not sure how much study has been done on seasonal cycles and their relative stability, but rarely does nature follow a calendar or a calendar year.
2) To the argument that says the 1930’s records are hard to break and a lot of highs are being broken regardless therefore it is warming. AGW theory absolutely requires that 2009 breaks -more- record highs than the 1930’s did, and that the 1950’s do the same, and the 1970’s do the same, because industrialization ( Anthropogenic co2 ) is the primary driver of climate. AGW theory absolutely requires that right now be hotter than then.
3) Related to 2, AGW theory (( especially the runaway warming bit )) requires that the ratios of record highs to record lows trend higher since industrialization, it requires also that the absolute number of record lows go down, and the absolute number of record highs go up. Saying Co2 affects climate is one thing. Saying it is the
-primary- driver of climate is another.
Gene Nemetz (07:13:47) “They tried to get rid of the Medieval Warm Period. Are they trying to get rid of the Dust Bowl years too?”
If they dare go that far, that will be a very telling indicator.
Any alarmists who rail against the 30s probably don’t have a clue about the EOP (Earth orientation parameters) record.
Sacrifices of credibility in spectacular shows of cross-disciplinary ignorance should be documented.
Pamela Gray (06:46:48) “Finally. Temperature data reported as a 3 month average. The cyclical nature of these records would be less choppy if the 3 month averages were reported thus as a moving 3-month average”
Insightful comment. I’ll add the following:
It is important to look at summaries across _all_ time-integration bandwidths (1mo, 2mo, 3mo, … up to the length of the series).
“Scale-dependent pattern” messaging is hammered like a sledge-hammer by brilliant pioneers in disciplines like landscape ecology & physical geography, but it is evident that many disciplines have not yet clued in to the broad arrays of insights that lie only a few data-analysis algorithm-modifications away.
ralph (06:43:12) “Wiki also has this, which suggests that the Dust Bowl was not simply bad agriculture.”
Mainstream narratives about the Dirty 30s are incomplete (if not misleading).
“Dust Bowl” was just the central-North-American manifestation of a _global_ pattern that played out over 2 decades (with the Southern Ocean & Antarctica in anti-phase to the North Atlantic / Arctic).
For those wondering about the aberrations of PDO over this interval, keep in mind the differing NAO & ALPI / NPI components of NAM.
There is a staggering amount of ignorance about the geophysical patterns of 1920-1940. There’s a big clue in plain view.
Extremes are based upon a frequency distribution and can be arbitrary (i.e. frequency of occurrence 1%, .1%, .01%, .001%, take your choice). It depends upon the population from which the frequency distribution is drawn from. The longer, more data points, the better.
Haven’t read the paper but I will. I get GRL. Gerry might have a real good argument for choosing the population he did. On the other hand Rich Keen, a seasoned weather observer, analyzer, teacher, and writer seems to have embraced the proper, objective statistical requirement: as many data points from the population as you can obtain.
Is the data easily available to try to replicate their results and to try to extend the period?