By Joseph D’Aleo, AMS Fellow, CCM
In this recent post, we discussed the problems with recent data that showed the argument presented by the EDF’s millionaire lawyer playing clueless environmentalist on Lou Dobbs Tonight that this will be the warmest decade is nonsense. This claim was well refuted and Al Gore’s credibility disassembled by Phelim McAleer, of the new documentary Not Evil, Just Wrong that challenges the lies and exaggerations (totalling 35) in Al Gore scifi horror comedy film, An Inconvenient Truth. 9 were serious enough for a UK judge to require a disclaimer itemizing them be read whenever, the movie was shown in the schools.
The world’s climate data has become increasingly sparse with a big dropoff around 1990. There was also a tenfold increase in missing months around the same time. Stations (90% in the United States which has the Cadillac data system) are poor to very poorly sited and not properly adjusted for urbanization. Numerous peer review papers suggest an exaggeration of the warming by 30%, 50% or even more. The station dropout can be clearly seen in the two maps below with the number of station going from over 6000 to just 1079 from April 1978 to April 2008.


See the big gaps in the recent data in Canada, Greenland, Africa, South America, parts of western Asia, parts of Australia.
SEE FOR YOURSELF
Take this test yourself to see how bad a shape the global data base is. Look for yourself following these directions using the window into the NOAA GHCN data provided by NASA GISS here.
Point to any location on the world map. You will see a list of stations and approximate populations. Locations with less than 10,000 are assumed to be rural (even though Oke has shown that even a town of 1,000 can have an urban warming of 2.2C).
You will see that the stations have a highly variable range of years with data.
Try and find a few stations with data that extends to 2009. To see how complete the data set is for that station, click in the bottom left of the graph Download monthly data as text.
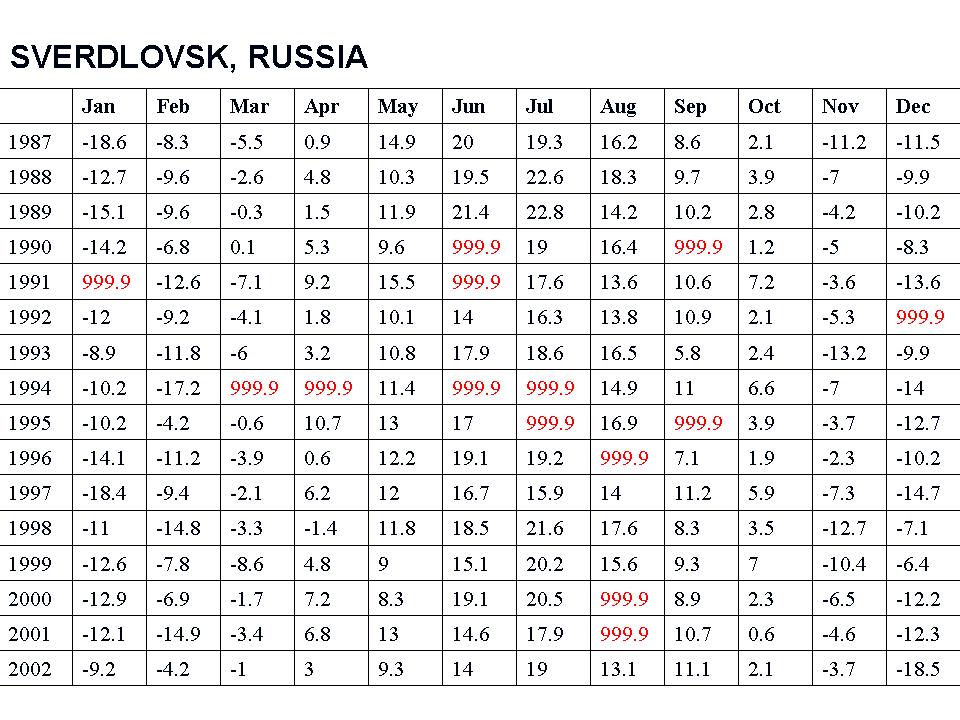
For many, many stations, you will see the data set in a monthly tabular form has many missing data months mostly after 1990 (designated by 999.9).

See larger image here
This required the data centers to estimate data for the grid box for that location with other stations nearby (homogenization). In the 2008 plot above only 1079 stations were used. NASA went to locations within 250 km (155 miles) to find data for the grid boxes. For grid boxes without stations within 250 km, they are left blank, thus the large gaps.
Most of the stations that dropped out were rural. More of the missing data points are having their missing months filled in with more urban data in the grid boxes.

See larger image here
WUWT Volunteer John Goetz created this video that shows the worldwide dropout of weather stations:
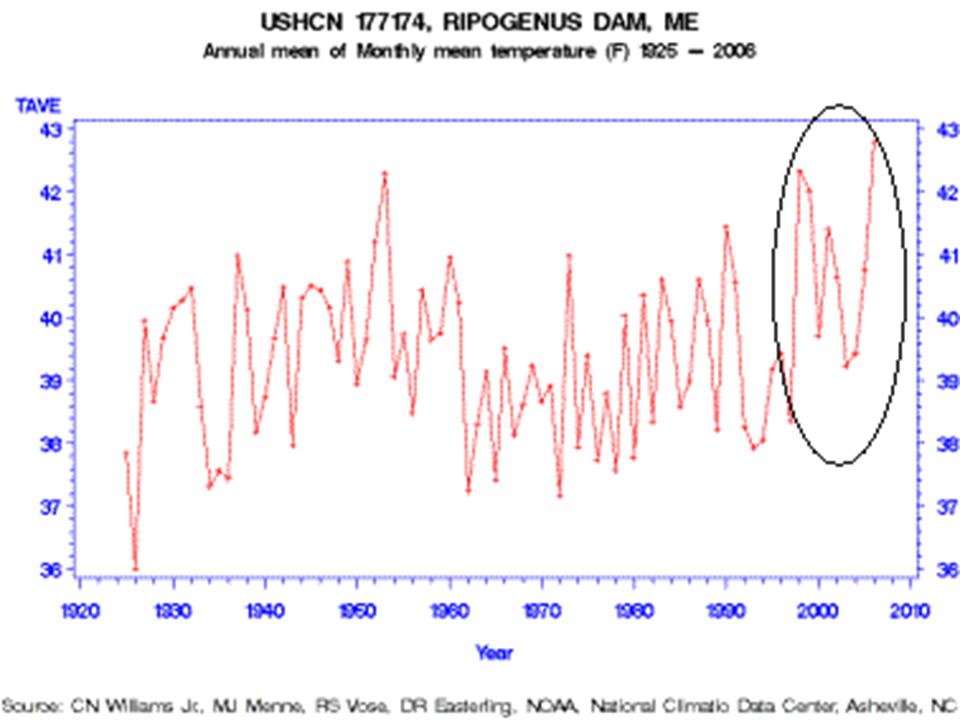
One example of how good or bad this works is from Maine. Volunteers completed surveys of the United States Historic Climate Network (USHCN) temperature stations in Maine for Anthony Watts surface station evaluation project. The survey determined that every one of the stations in Maine was subject to microclimate or urbanization biases. One station especially surprised the surveyors, Ripogenus Dam, a station that was officially closed in 1995.

See larger image here
Despite being closed in 1995, USHCN data for this station is publicly available until 2006! (GISS stopped in 1995)
Part of the USHCN data is created by a computer program called “filnet” which estimates missing values. According to the NOAA, filnet works by using a weighted average of values from neighboring stations. In this example, data was created for a no longer existing station from surrounding stations, which in this case as the same evaluation noted were all subject to microclimate and urban bias, no longer adjusted for. Note the rise in temperatures after this before the best sited truly rural station in Maine was closed. GISS does display this station that did incorporate the “filnet” data input for missing months although as noted they stopped its plot in 1995 which NOAA extended artificially to at least 2006.
How can we trust NOAA/NASA/Hadley assessment of global changes given these and the other data integrity issues? Given that Hadley has destroyed old original data because they were running out of room in their data cabinet, can we ever hope to reconstruct the real truth?
As one of our scientist readers noted: “Well, the 999.9s you showed me today sure opened my eyes…the ramifications are stunning. I knew about the drop-off of stations before but never that existing station reports are so full of gaps or that they’re getting temperature readings from “ghost” stations. This is, as you have said, GARBAGE. See PDF here.
We no longer need an Olympics. we can take statistical data. Too bad my daughter is trying out for the olympics and the heptathlon. On one event last year, she had personal bests every week for a couple of months.
We can “smooth” readings. How about changing weights of sources?
There is so much subjective influence, that it seems some of these studies must be declared invalid and inconclusive.
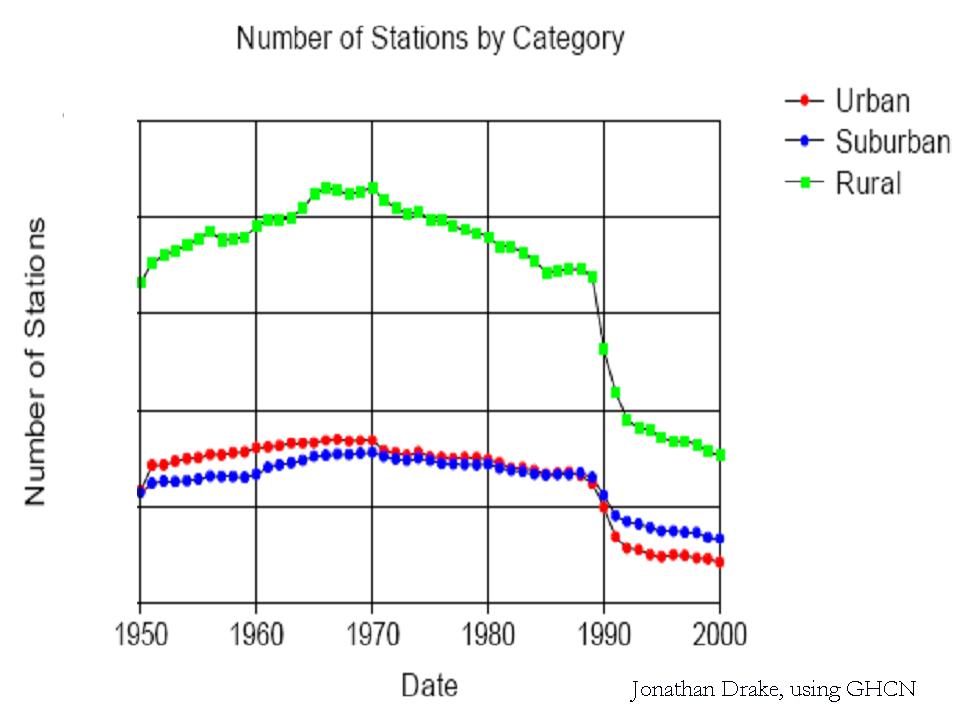
on the “number of stations” over time and by category graph – what is the y axis? just curious on the actual numbers.
Lots of questions running through my mind, but I will not ask, I am sure you guys have the answers and I will keep an eye on the thread.
But:
Did the IPCC use this in any of their reports? Was it used in isolation of other data or was it bundled with some other source?
And if this was used is the data they (actually) used, available for scrutiny?
Thanks for your patience.
Is there a detectable drop in variance caused by the averaging process?
Nick
They took 18 years off the back end of the record for my rural station. Many of the -999’s are to be found in the newspapers. The data is missing from GISS, not that it was not taken.
This record cannot be trusted, and is essentially worthless.
I suspect that many rural stations that are currently still in use have had the many years of record trimmed off the back end. An entire US reporting system was set in place in 1894 to provide a consistent data set. Many of the Western stations had records going back 10-50 years earlier than that, but have been ‘sanitized’ and the data lost or destroyed.
Sick puppies.
First time I’ve done this so if I get something wrong/miss something obvious feel free to flame.
Right, had a look at my patch, the south of England. As far as I can see, there is just ONE station still operating in the southern half of the country (south of Lincoln.)
Now this station is named ‘Bournemouth A’ and looking at the co-ordinates given on the map, it looks like it is in Bournemouth Airport. So the only data station still in the set (that I can see), in the entire southern half of England (on the edge of the Gulfstream) is in an airport (possibly).
Despite this, the last full temp reading (2008), was just 0.01 degree C above the first reading at this station (1961).
Now I know you’re doing an audit of these stations, so a couple of questions:
1) How do I find out *exactly* where it is to do an audit (unless it has already been done).
2) If I do go and have a look, what exactly am I looking for.
Apols for the rambling post.
“To measure is to know.”
Lord Kelvin
Well why do we need so many stations anyway. We can tell the climate for 800,000 years just from one ice core drilled at Vostok Station (maybe with extrapolations), so who need all those other readings anyway.
Why not make just one more good climate station, and put it on The White House lawn; and have the President decide what the climate is; after all he’s a nobel prize winner. That would save a lot of money taking care of all those other stations.
Well they don’t hang on to the data anyway; they just annualize it, and then five year running average it, and then just average it in with all those other annualized five yearized numbers toi get the world climate anyway. Let Obama decide.
Do any of these “Climatology or Climate Science” courses at any of the Major Universities ever mention the Nyquist Sampling Theorem; or teach a class in basic sampled data sytem theory?
Would that be an idea insteaqd of just teaching Stat maths.
You can’t generate meaningful statistics if you have data containing no information.
Excellent synopsis. Kudos to Joe D’Aleo.
The emperor has no clothes. Despite tens of $billions spent on global warming “science,” the data on which the “crisis” is based are sparse and tainted. AGW alarmists cannot even establish that global temperatures are rising, in large part because temp change has been flat or negative for 10 years (or more — the data have been systematically biased and rebiased upwards for 20 years).
AGW alarmists are crying wolf. Their “crisis” is manufactured and illusory.
Based on UAH data I calculate that the Hadcrut data has a warming bias of about .07 degrees per decade over the period that the two records overlap. I suspect that this grows smaller as you go further back but it is quite large. The main cause, I think, is the lack of data in Africa, where there has been little warming. I note that Christy et al., studying East Africa, found that the data from Hadley in the study area greatly exaggerates the trend- and that there is evidence for landuse effects there.
Within the US, GISS’s Al-Gore-Rhythm seems to work OK, but in the ROW it’s not clear anyone has a method that doesn’t suck.
Which reminds me. Joe, do you know what kind of seasonality UHI etc. would have? I’m trying to figure out why there seems to be so much winter warming in many data sets and very little summer warming.
I was shocked at the number of stations that have been dropped. It seems that the goal is not to measure temperature but to stop measuring temperature.
I believe Steve McItyre has posted about this problem several times even pointing out that in many cases the “missing” data are available for download on the public Internet. For example, a site might not for some reason report a value for a month to NOAA but a quick search shows the value for that station from another source. The bottom line is that the amount of QA that goes into this data set is something close to zero.
This article highlights the very reason that data such as GISS simply isn’t believed by many people. Many of the numbers are little more than rectal extractions.
Hi all, what’s happening with the gulf stream? Is it slowing down? Look at the map in this site!
http://polar.ncep.noaa.gov/ofs/viewer.shtml?-natl-cur-0-small-rundate=latest
Is NOAA having issues with the model or has the gulf stream really stopped?
“For many, many stations, you will see the data set in a monthly tabular form has many missing data months mostly after 1990”
The post cold war peace dividend
I agree with George Smith .Let Obama decide.Obama said we must stop climate change .Now some people think Obama is god but I know there is only one GOD ,Jesus Chrsist,and that ain’t Obama.One last thought is Obama talkes about reversing climate change so how does he plan on doing that ??We can’t control the weather and I know weather isn’t climate change , or so we are told ,but if thats the case then when we have heat waves in California the first thing we here is global warming oops i’m sorry climate change??????
The “missing” temperatures are, in many cases, due to a single missing day’s entry!
Ran across a fellow who’s disentangling the GISS data & Fortran programs, and odd as it may seem, GISS drops the entire month’s data if any daily entry is missing.
http://chiefio.wordpress.com/gistemp/
Why, would any sane scientist drop 27 to 30 valid data points because 1 is missing? Simple interpolation would make far more sense than filling in the month from neighboring stations (up to 1000km away). Here in the Central US, the temperature often varies by 10 F within 100 mile radius.
Andrew (09:52:02) : Within the US, GISS’s Al-Gore-Rhythm seems to work OK, but in the ROW it’s not clear anyone has a method that doesn’t suck.
Um, IMHO, the GIStemp method is very sucky too:
http://chiefio.wordpress.com/2009/08/30/gistemp-a-slice-of-pisa/
Which reminds me. Joe, do you know what kind of seasonality UHI etc. would have? I’m trying to figure out why there seems to be so much winter warming in many data sets and very little summer warming.
I think I have the answer here:
http://chiefio.wordpress.com/2009/08/13/gistemp-quartiles-of-age-bolus-of-heat/
http://chiefio.wordpress.com/2009/08/17/thermometer-years-by-latitude-warm-globe/
And a bit more, including some source code to play with the data yourself:
http://chiefio.wordpress.com/2009/08/09/co2-takes-summers-off/
RE:Gulf Stream
Yeah, there have been many articles posted recently that it has slowed. It isn’t the first time. There were in 1907 about the same thing.
Only the fact that there is significant doubt about the quality of the basic temperature data should halt any attempt to control CO2 emissions.
“Mike D. (09:46:59) :
Excellent synopsis. Kudos to Joe D’Aleo.
“The emperor has no clothes.”
If I may suggest a major modifcation to your comment:
The “CLOTHES” have no “EMPEROR”.
crosspatch (09:57:20) :
That and this…
http://i44.tinypic.com/29dwsj7.gif
Which either you or Smokey originally posted IIRC
DaveE.
Was it Leif’s paper here about the solar magnetic stuff, with a black and a red graph that showed quite good correlation; and as I recall, it said somewhere there that a year wasn’t plotted if they had a missing month of data.
That makes no sense to me. If you have 11 months of data; which you are homogenising into a single annual number, it would seem to me that some interpolation from the 11 existing points; or even as simple as the average of the two adjacent points would give a better representation of what happened that year; than simply no value whatsoever; that is the ultimate in data distortion to have one year’s value be infinitely indeterminate.
As hokey as I believe this whole “science” is (climatology; not meteorology) I see no validity to just discarding a whole bunch of data for a single missing value that is going to get homogenised anyway; specially after a five year running average.
“In this recent post, we discussed the problems with recent data that showed the argument presented by the EDF’s millionaire lawyer playing clueless environmentalist on Lou Dobbs Tonight that this will be the warmest decade is nonsense. This claim was well refuted and Al Gore’s credibility disassembled by Phelim McAleer, of the new documentary Not Evil, Just Wrong that challenges the lies and exaggerations (totalling 35) in Al Gore scifi horror comedy film, An Inconvenient Truth. 9 were serious enough for a UK judge to require a disclaimer itemizing them be read whenever, the movie was shown in the schools.”
Climate Depot posted my videos of this Lou Dobbs CNN Story.
http://www.climatedepot.com/a/3306/CNNs-Lou-Dobbs-Hosts-Rare-Global-Warming-Debate-Over-Gores-Errors–Mocks-claim-that-capandtrade-is-market-based-plan-Video
“Hi all, what’s happening with the gulf stream? Is it slowing down? Look at the map in this site!
http://polar.ncep.noaa.gov/ofs/viewer.shtml?-natl-cur-0-small-rundate=latest
Is NOAA having issues with the model or has the gulf stream really stopped?”
Yeah, that looks really strange indeed. Something happened September 18 on all maps.
E.M.Smith (10:29:21) : The GISS corrections in Pisa would be ROW (ie not US) where they us a completely different UHI correction method that pretty clearly sucks. But I was refering specifically to the US.
You also didn’t answer my question as to the seasonality of UHI or landuse effects, but rather commented on it having something to do with the GISS method. But the winter warming I have seen occurs in many different data sets. GISS unfortunately does not seem to have monthly anomalies for the US, so I can’t compare them with NOAA’s, which show a strong winter effect. I’m trying to figure out how real that might be, given the indications that the USHCN used by NOAA still has spurious warming in it (GISS warms considerably less).
Has anybody figured out what global temperature is? It seems to me like it’s a myth, perpetrated by the hoaxers. Probably based on the same math as the computer models.
How could you possibly take the global temperature and have it mean anything.
The drop out of rural data points is critical here.
For me, the most accurate way of measuring global temperature, free of UHI effects, is to SOLELY use rural stations.
This article shows either a cunning plan since 1990 to artificially drive the ‘global warming’ agenda, or a rather fortuitous series of events which happened to make such an agenda more likely to apparently fit the hypothesis.
I suspect the former, but I have no proof of it.
Does anybody else??
George E. Smith (09:44:23) :
Do any of these “Climatology or Climate Science” courses at any of the Major Universities ever mention the Nyquist Sampling Theorem;
You can’t generate meaningful statistics if you have data containing no information.
Funny you should mention Nyquist, after looking at thier output, they have incredibly poor spatial resolution. If they were photo journalists, the editor would have them canned.
Oh, but they do generate statistics, all the time, it just doesn’t have any value unless one is out to create art by grinding dirt into a Rembrandt.
@ astateofdenmark (09:33:01)
Re Bournemouth Airport UK (Hurn) known as EGHH
Have a look at this web page:- http://weather.gladstonefamily.net/site/EGHH
It shows the weather station compound adjacent to taxiways and aircraft parking
cheers
Patrick Silchester Hants>
The idea that there is something wrong with our climate is preposterous,
the global plot to regulate and curb CO2 emissions plainly criminal.
This is a crime against humanity as is Chapter 21.
Both are related.
http://canadafreepress.com/index.php/article/15713
So they use observations to model the future and they use models to create the observations. Reality is becoming a computer simulation. Is this the Matrix?
Svalbard airport at 78N, a reference climate station, part of the network of stations particularly suited for climate change studies, has a record going back to 1911. That makes it very interesting for climate change studies, since the arctic is of special interest in climate studies and there are few stations there. However, the actual observations only go back to 1975. Everything before that has been reconstructed. About half of the missing data has been homogenised from a station a few km away but in quite different topology, the rest from stations 10’s or even 100’s of km away or from interpolations. While such reconstructions are interesting, they don’t really have a place in a data set which we expect to consist of real observations. Do the climate researchers know when they’re using real weather observations and when they’re using computed weather? Do they care?
astateofdenmark (09:33:01) :
First time I’ve done this so if I get something wrong/miss something obvious feel free to flame.
___________________________________
We don’t flame at WUWT.
Rhys Jaggar (11:33:20) :
Even if it were possible to take a global temperature, it is meaningless as just a temperature reading.
As I have stated before, if a given volume of humid air warms 1ºC & the same volume of dry, (arid), air cooled 1ºC, the average temperature hasn’t changed but the energy level has.
DaveE.
Rhys Jaggar (11:33:20) :
If you believe a certain thing to be true and if in 1990 there was not much difference in temperature reported from, lets say, 8000 observations and 1000 observations and since 1000 is easier to manage, then why not drop the other 7000. That might be their reasoning. And … since the remaining observations support what they believe to be happening, then they have no reason to doubt the result.
People tend to weight information that validates their beliefs higher than data that invalidates their beliefs.
If the data comes out that shows what they expected, it (the result) is left as is without further checking. If the data results in an outcome counter to what is expected, then it is checked and rechecked and checked again.
This is why errors have been found most often when they produced a cold anomaly than when they produced a warm anomaly.
If you expect temperatures to warm, a hot spot generates an alarm for some kind of action to mitigate it. A cold spot generates and alarm to inspect the data.
Steve McIntyre is the only one I am aware of that inspects the data when unusual warming is seen.
A message for astateindemark and others. I live in the west of England and have been studying the Ross on Wye weather information going back to the 1850’s.
I am not an expert so have had some difficulty understanding the raw data but there does not seem to be much difference in the temperatures in the last 150 years. When I mention this in dinner parties etc I am usually shouted down. I have been very supicious of the term global warming as who was taking the global temperatures in the nineteeth century except the U.S.A and modern Europe?
Please contact me as I feel that I am the only person in the U.K that is questioning the whole issue of global warming data.
This, plus the big holes in World cover and obviously a lack of reliable temporal History for the precision needed, is what makes me say that we don’t know what is going on. We might even be getting warmer. But the corrupt AGW “science” destroys everything.
As an extension of what I said previously.
Say the tropics, (humid) were to cool & remain at the same humidity & the mid latitudes to the poles were to warm. You could end up with an increase in global temps with no change in energy.
Mix any temp/humidity changes to get the same results.
DaveE.
Really fantastic work. Very impressive.
One of the disadvantages to data collection is the inconvenience of having to go into the real world and do it. With just a handful of congenially sited interferometers around the globe the temperature can be taken reliably.
Measure the increase in CO2 from this morning, pro-rate the value 1 based on a doubling, multiply by 6 for WV feedback, state temperature. No more UHI, no more Vostok, no more bristlecone pines.
My New Video’s Made it on Prison Planet
http://www.prisonplanet.com/lou-dobbs-al-gore-not-evil-just-wrong-global-warming-debate.html
These “mean” monthly temperatures are the average of the daily means of the maximum and minimum temperatures aren’t they ? How well does the average of two daily points represent changes in daily temperature ?
It’s really sad. Just look at that big dark red blotch in the south of Norway where I live: It’s probably mostly due to “rural” Gardermoen: http://data.giss.nasa.gov/cgi-bin/gistemp/gistemp_station.py?id=634013840003&data_set=1&num_neighbors=1
(which I fear is used to correct a lot of stations in Sweden too…)
Only problem: Gardermoen isn’t rural anymore, since 1998 it’s home to Norway’s main Airport. I don’t know how close to the runways they measure temperature, but the whole area is obviously not the same as it used to be.
It would appear the only accurate temperature measuring that might even come close to true representation is satellite based. I wonder of we could find a willing person who could explain how that is done. I would like to know how they do it …
It’s clear ground based data is virtually useless for serious science — unless you did an exceptional study of each data site before you allowed the site’s data into the final model. And then, I wonder what you would really have.
Climate Myths and National Security
By Viscount Monckton of Brenchley
http://www.americanthinker.com/printpage/?url=http://www.americanthinker.com/2009/10/climate_myths_and_national_sec.html
The President of the United States recently told the United Nations that “global warming” poses a threat to national security and may engender conflicts as populations are displaced by rising sea levels, droughts, floods, storms etc. etc. etc. However, it is now clear that there is no basis for the notion that the barely-detectable human influence on the climate is likely to prove a threat to climate, still less to national security.
The first principle to which any national security advisor must adhere is that of objective truth. Though he must have an understanding of politics, he is not a politician: he is a truth-bearer. Therefore, he begins by narrowing down the issue to a single, central question whose answer determines whether the suggested threat is real. He then tries to find the truthful answer to that question, and draws his conclusion from that.
Quid enim est veritas? What, then, is the truth? The single question whose answer gives us the truth about the climate question is this: By how much will any given proportionate increase in CO2 concentration warm the world? We now know the answer. The oceans, which must store 80-90% of all heat-energy accumulated in the atmosphere as a result of the radiative imbalance caused by greater greenhouse-gas concentration, have shown no net accumulation of heat for almost 70 years, implying a very small influence of CO2 on temperature (Douglass & Knox, 2009). The devastating analysis of cloud-albedo effects shortly to be published by Dr. Roy Spencer of the University of Alabama at Huntsville will show that the UN has wrongly decided that cloud changes reinforce greenhouse warming, when in fact they substantially offset it. Repeated studies of the tropical upper troposphere (e.g. Douglass et al., 2008) show that it is failing to warm at thrice the surface rate as required by all of the UN’s models, again implying very low climate sensitivity. The clincher is Professor Richard Lindzen’s meticulous recent paper demonstrating – by direct measurement – that the amount of radiation escaping from the Earth’s atmosphere to space is many times greater than the UN’s models are all told to believe. From this, the world’s most formidable atmospheric physicist has calculated that a doubling of CO2 concentration, expected over the next 150 years, would cause 0.75 C (1.5 F) of warming, at most: not the 3.4 C (6 F) that the UN takes as its central estimate.
Most analysts would stop there. Yet some might ask, “Suppose that the single satellite on which Lindzen’s results depend is defective. What then?” They might consider the economic cost of attempting to mitigate the “global warming” which, as our Monthly Reports demonstrate, is not actually happening. The figures turn out to be startlingly simple. To mitigate just 1 C (2 F) of warming, one must forego the emission of 2 trillion tons of CO2. The world emits just 30 billion tons a year. So the analyst, as a thought-experiment, would shut down the entire world economy, emitting no CO2 at all. Even then, and even on the incorrect assumption that the UN’s exaggerated projections of the effect of CO2 on temperature are correct, it would take 67 years to mitigate 1 C warming. Preventing the 3.4 C (6 F) warming that the UN’s climate panel thinks would occur in 100 years would take 225 years without any transportation, and with practically no electrical energy. The national security advisor would at that point advise his head of government that there has never been any security threat less grave, or more expensive to prevent, than the non-problem that is “global warming”. It is the fearmongers that are the real national security threat.
“”” DaveE (11:53:06) :
Rhys Jaggar (11:33:20) :
The drop out of rural data points is critical here.
For me, the most accurate way of measuring global temperature, free of UHI effects, is to SOLELY use rural stations.
This article shows either a cunning plan since 1990 to artificially drive the ‘global warming’ agenda, or a rather fortuitous series of events which happened to make such an agenda more likely to apparently fit the hypothesis.
I suspect the former, but I have no proof of it.
Does anybody else??
Even if it were possible to take a global temperature, it is meaningless as just a temperature reading.
As I have stated before, if a given “””
Actually there is nothing wrong with having UHIs included in the temperature data gathering; after all, Gaia uses those UHI temperatures; every one of them, plus all the ones that don’t even have thermometers.
But if you think the UHI temperature recorded outside the Department of Environmental Science Building at the Universoty of Arizona should be used to represent the temperature 1200 km away, or even up at Flagstaff; you’d be in for a rude awakening.
But the most glaring error in all of the data gathering is this max/min twice a day strategy for getting the daily mean at any one site location. A max/min recording strategy is only usable if the daily temperature (diurnal) cycle is a purely sinusoidal waveform. That is the only situation in which the sampling method is valid for a 24 hour cyclic variation. I doubt that actual daily temperature graphs at a fixed lkocation are ever sinusoidal; so the daily average is wrong before you even start to worry about the spatial sampling frequencies, whcih are undersampled by orders of magnitude.
And as others have stated; even if you could calculate the correct average temperature; which you can’t (Gaia can and does), that tells you exactly nothing about energy flows; either local or global. It has no scientific significance whatsoever to know the global mean temperature.
I’ve been looking into the discrepancy between the stations that have been retained and the stations that have been dropped over the past few years.
I’ve looked at a selection of stations in Alaska and California. In both areas the dropped stations showed the 1930’s to be as war, or warmer than the late 1990’s to early 2000’s and the retained stations have been mostly in urban areas and show the 1930’s to be much cooler than the late 1990’s to early 2000’s. This has had the effect of cooling off the 1930’s. It’s a neat trick to “cool off” the 1930’s from a vantage point in the early 2000’s.
This is a graph of Alaska stations that were dropped after 1990 compared to the stations retained in 2009…
Alaska
The dropped stations show the 1930’s to be about 0.5C warmer than the retained stations.
Here’s a comparison of California stations dropped in 2007 to stations retained in 2009…
California
The California “2009” curve is dominated by Los Angeles and it shows about four times as much 20th century warming as the “Rural” curve does (1.85 C vs 0.45 C).
I’m sure it’s just a coincidence, but the station dumping started about the same time that James Hansen was promoted from NASA-GISS climate science manager to NASA-GISS Director in 1981… And that the station dumping accelerated after he published his 1988 model.
NASA-GISS Stations
How bad is the global temperature data? Truly, we have no idea.
And this is the 21st Century, folks.
=======================================
I like many others who post here, am very concerned regarding the accuracy, reliability and consistency of the data which underpins the concept of runaway global warming. But although these concerns are dealt with from time to time by WUWT in posts such as this, what impact is any of this having on MSM and the majority perception of global warming? The mantra of peer review is constantly invoked even though recent revelations suggest this process is a lot less stringent than it used to be. What I’m really trying to say is that the questioning of global warming is not reaching all that many people. I truly despair at the bastardisation of science that is occurring with climate change and which is shown so clearly in this article and I fear the sceptics have lost the war. Sorry for the negativity but I feel so frustrated that fair debate in the MSM is not permitted.
Dr A Burns (13:15:05) :
This is something I intend to check as soon as I have enough funds to build my continuous temp monitor.
I also mean to check the validity of TOBs.
DaveE.
“”” Dr A Burns (13:15:05) :
These “mean” monthly temperatures are the average of the daily means of the maximum and minimum temperatures aren’t they ? How well does the average of two daily points represent changes in daily temperature ? “””
Dr Burns, I just got through that above.
If the temperature variation thorughout the day is a pure sinusoidal waveform with a period of 24 hours; then the Nyquist Sampling Theorem says you must sample it at least at 12 hour intervals, in order for those two samples to allow you to reconstruct the continuous function and hence properly compute the average.
Actually at just twice the signal frequency sampling rate; you have a degenerate case, and you can’t reconstruct the waveform (what if your two samples came at the 0 and 180 degree zero crossing points). But fortunately you can still get the correct average as the average of your two readings.
But daily temperature graphs are not sinusoids, as the heating and cooling parts of the daily temperature are not symmetrical. So that means that at the very least your temperature function must have at least a second harmonic signal with a 12 hour period; and that means you need to get samples at 6 hour intervals. Now throw variable cloud cover into the daily picture, and now you have temperature change signals at much higher frequencies, with periods of just a few minutes.
So the answer is NO, twice a dat temperature sampling will not give you the correct daily average temperature; it will be corrupted by aliassing noise; since the reconstructed signal spectrum is filded back all the way to zero frequency and beyond; so even the average is not recoverable.
But consider the long wave infra-red radiation emitted from the surface. That varies about as the 4th power of the temperature. And if you take the 4th power of a sinusoidal function, oand integrate it over a full cycle, you will get an always positive offset, that depends on the amplitude of the cyclic variation, relative to the average or DC temperature. For typical daily temperature ranges from max-min, that offset is significant; and when you consider the cyclic temperature range for the annual cycle through four seasons, the underestimate of total emitted LWIR is quite significant; and failure to properly calculate it (by using average temperatures), always underestimate the global emittance, which leads to an over estimate of the mean global temperature required to balance the total solar insolation.
The central limit theorem does absolutely nothing for you in buying a reprieve from a Nyquist violation; the aliassing noise becomes a permanent inherently unremoveable part of the reconstructed temperature funtion; because that out of band signal is convolved into an in band noise, whcih can’t be removed without removing real signal as well.
But Statistical mathematics is so much easier to teach than Sampled data system theory, and signal recovery.
PS
All data I collect I will make available through Anthony. It will not be a pristine site, (far from it, it’s my back garden), but we may be able to gain some insight.
DaveE.
PPS
I am also planning a variation of Woods experiment using double glazed units, (which I have made), one of which is plain glass, the other low E.
I did plan on using low metal glass but to be fair I had to use normal glass as there is currently no low metal low E glass available.
DaveE.
Ian (13:38:36) :
I like many others who post here, am very concerned regarding the accuracy, reliability and consistency of the data which underpins the concept of runaway global warming. …… Sorry for the negativity but I feel so frustrated that fair debate in the MSM is not permitted.
I, too ,feel that way sometimes. Just keep fighting the good fight!!! It’s been said before that a lie told over and over again will be believed. How much more effective then, would a truth told over and over again be?
“This is something I intend to check as soon as I have enough funds to build my continuous temp monitor.”
Anthony sells a relatively cheap ($60) device to do what you want to do.
See the sidebar.
Tom in Texas (14:03:35) :
My plans go way beyond available technology. Data logging is just a small part of it & $60 + shipping is more than I need. I will get there soon.
Forgot to mention RH monitoring too. Bloody expensive little sensors they are.
DaveE.
Much has been observed and extensive analysis has taken place on land surface temperature records. However, the seas cover 70% of the earth. I would suggest that those who follow the AGW debate would be very interested in understanding how HadCru and GISS calculates ocean surface temperatures. And please do not say that GISS uses satellite data — that is a very misleading claim even though there is some truth in it. Also, does Phil Jones claim that his agreements with foreign countries prevent from sharing his data on sea surface temparatures?
George E. Smith 13:26;58 states:
The drop out of rural data points is critical here.
For me, the most accurate way of measuring global temperature, free of UHI effects, is to SOLELY use rural stations.
This article shows either a cunning plan since 1990 to artificially drive the ‘global warming’ agenda, or a rather fortuitous series of events which happened to make such an agenda more likely to apparently fit the hypothesis.
<<<<<<<<<<<<<>>>>>>>>>>>>>>>>>>>>
George, I agree completely with the first line of your comment pasted above. And I am particularly aghast that so much initially blank data has been fudged from nearby sites. I also believe there is a huge differrence in temperatures between urban, suburban and rural areas, just as the local TV weather forcasters give us predictions of temps in the city and the suburbs — tonight it will be cold in nearby Philadelphia, with frost predicted in the northern suburbs and a freeze in some rural areas. Sometimes the difference can be a degree or two F.
However, I have a problem with the concept accompanying the fourth (unnumbered) figure titled “Number of Stations by Category” in D’Aleos commentary. Presumably, with so many rural stations having been eliminated, according to the graph going from around 7700 in 1980to around 5200 in 1990 ro around 3100 in 2000, thus would tend to effect a positive bias the measurements.
But I wondered if this is a fair conclusion because wouldn’t the effect depend on the ratio of rural to urban/suburban stations rather than the actual numbers? So to make some ratio measurements over three decades, it was necessary to average the suburban and urban numbers in 2000, whereas the numbers for those two almost coincided in 1980 and 1990. My averaging for 2000 may not be realistic, but in any case, my measurements oddly show a slightly increasing ratio of rural to suburban/urban stations. The data points on the curves are fairly large, but in carefully scaling the points at the three decade marks over this recent 20 year period, I found these ratios: 1980: 2.52; 1990: 2.68; 2000: 2.77.
Would you agree that, in view of this slightly increasing ratio for rural stations, any bias problem with the stations involves the probably rapidly growing heat islands in the urban areas rather than the diminishing number of rural stations so long as their ratio is almost constant if not rising slightly?
Bob
Yawn, yawn, yawn,
temperatures’ boredom,
yawn, yawn, yawn,
they have it all wrong.
I like how Canada doesn’t show any stations…… but wait…
how come there is some of the most signifigant warming going on in the Hudsons Bay area??
http://global-warming.accuweather.com/GHCN_GISS_HR2SST_1200km_Anom09_2009_2009_1951_1980.html
IS THIS WARMING JUST INFILL???? anyone? Bueller?
Michael, making it on ‘prisonplanet’ is not such a high honor.
Be sure to delouse for fleas (or anything else) picked up from over there after leaving …
.
.
.
In other news, the mainstream here in the UK are starting to ask questions:
Honestly, I nearly fell off my chair, but I’m not surprised. The whole rotten edifice is starting to crumble.
Apologies if this question has already been answered; I don’t think I missed a mention of this, but it’s possible. What, exactly, HAPPENED in 1988-1992? What was going on there? The slow drop leading up to that fall is also interesting, too, but…Really, now. Why were so many weather stations allowed to go offline? Anyone know?
Joseph’s global GISS plot may exaggerate missing data. I looked up April 2008 on the GISS site here, and there were a lot less missing areas. The version shown here may show data as missing when first posted, but which came in later.
Mizen2, I’m on the case, Ellie from Belfast put me on to it and I might have done a post that would have beat Joe dAleo here but I wanted to do more on Yamal before getting involved in what could be a big and much-needed project we could do for the UK. I want to go and hunt for UK records that have really long histories. And I want help with this. All the amateurs we can get on the case. You see, GISS castrated all the records at 1880 at one end, and often in modern times I’ve found hints that a station with someone who might actually care, still keeps records, even when the station stops in the GISS records.
UK Met Office was under the RAF originally which is why so many UK records are RAF, and perhaps also why so many UK records are at current airports.
I’ve done a whole load of blink comparators. Yes, THE PATTERN IS DIFFERENT TO USA. All the end temperatures are left alone and the start temperatures are depressed. Four crimes in one! Pre-1880 castrated. UHI ignored. Integrity of early recorders poo-poohed. Trend “worse than we thought”.
Mizen2, anyone else in the UK, please get in touch!
Why is this a problem? I mean 12 thermometers should be plenty to prove either case, as long as they are in Yamal, right?
Patrick
So I guessed right, the only station still operating in the southern half of England, is on the site of an airport. Unbelievable.
Uploaded by your’s truely on Youtube.
Glenn Beck’s One Minute Response to Recent Global Cooling News 10-13-09
Washington is cold:
http://www.wenatcheeworld.com/news/2009/oct/12/record-cold-hits-region-snow-on-the-way/
Ronan
See my #7732 on http://www.harmlesssky.org/ for an explanation of what happened around 1990.
tonyb
Current trends for the temperature records based on thermometers from 1979 to the last data point:
(degrees/decade)
HADCRUT: 0.157
GISS: 0.159
And the satellite records which do not rely on thermometers:
UAH: 0.125
RSS: 0.153
TonyB, when I go to Harmless Sky the URL doesn’t change in the title bar at all at all. Can you please give a date, title of post, and comment number if appropriate?
Nick Stokes (15:15:20) : It’s true that some data comes in eventually which would register as missing at first, however there are still large portions of the world which have had and still have very little data. Africa has the most severe problem as far as I can tell. And that’s important because the evidence seems to me to indicate very little warming there.
What’s striking is how little influence all that data coming in seems to have. Should not the additions make some difference? Apparently not. That’s probably because the areas where data tends to be the most sparse never come in.
I would seem that AGW is really dying from reading the Headlines in mainstream newspapers re australians are less and less interested, BBC etc. I wonder if it was SM tree story that really cracked it. The next one to crack entirely and should be pursued relentlessly is that HADcrut data. Anyway I look forward to the day where I dont have to waste my time looking at sites like this or RC or CA (meaning we should not have to waste time looking at weather issues LOL). THis site will I hope be remembered as one of the main ones to have brought reality back I hope they are awarded a prize!
timetochooseagain (16:53:10) :’
Well, my main point is that the graph presented above is misleading in its depiction of missing stations. I don’t know basis you are using for saying that the info when it comes in makes little difference. However, it’s not so surprising. If you look at the plot with 1200 km interpolation, almost everything is covered. There is reasonable correlation on the 1200 km scale, and the world average calculated with proper weighting with the smaller initial set of points is pretty good.
Nick Stokes:
“If you look at the plot with 1200 km interpolation, almost everything is covered. There is reasonable correlation on the 1200 km scale, and the world average calculated with proper weighting with the smaller initial set of points is pretty good.”
Are you serious? Of course a 1200 km interpolation will have a reasonable correlation with itself!
When you are measuring something like a 0.5 deg C change in 100 years, and the difference between stations only 20 miles apart is over 4.0 deg C each day, then there is something very wrong.
I no longer debate the obvious…
RE: Barry L. (14:53:56) :
I like how Canada doesn’t show any stations…… but wait…
how come there is some of the most signifigant warming going on in the Hudsons Bay area??
http://global-warming.accuweather.com/GHCN_GISS_HR2SST_1200km_Anom09_2009_2009_1951_1980.html
IS THIS WARMING JUST INFILL???? anyone? Bueller?
——————–
This one is likely correct. We had one of the warmest Septembers in history. Temperatures were frequently around 30 C (not F) during the month with many stations setting records. Lots of sun as opposed to a fairly wet summer. October is correcting that. We had snow on Friday and minimums are below freezing this week and maximums just above freezing in southern Manitoba. The late warm spell delayed the leaves turning color. The green ash in our yard did not turn yellow. The leaves just started falling off. I expect toi have leves falling on the snow this fall.
Paul (09:20:06) :
>on the “number of stations” over time and by category graph – what is the y axis?
Click the PDF at the end of the article.
I don’t know if anyone mentioned it yet, but there was also another problem with some stations. The previous month’s data would be re-reported as the current month’s data. That can go unnoticed in tropical areas and even in higher latitude regions in summer or winter but it happened in the fall at some locations in Finland and Russia and at least one other place and was noticed. Going back through the record it was discovered that it had happened several times in the past.
I believe there was a post here on that as well but it has been a long time ago.
So, where does the satelite data fit in?
TonyB: Hm. You’re saying that it’s due to taking stations offline in Eastern Europe and elsewhere in ’93? But there’s only a small drop in the number of stations between ’92 and ’93; the main plunge takes place from ’89 to ’92. THAT’S what I’m curious about, not the much smaller dip you’re referencing. Does anyone know what caused that?
“If you cannot measure it, you cannot control it.” –Dr. Pierre R. Latour, P.E. chemical engineering and control engineering.
This is a fundamental principle of process control that applies equally to a thermostat as to an entire world’s air temperature.
Pofarmer (18:51:27) : Satellites generally refer to the LT data from UAH and RSS. GISS does not use those, because it is trying to get a “surface temperature” metric. However, GISS uses
Reynolds, R.W., N.A. Rayner, T.M. Smith, D.C. Stokes, and W. Wang 2002. An improved in situ and satellite SST analysis for climate. J. Climate 15, 1609-1625, doi:10.1175/1520-0442(2002)0152.0.CO;2.
For Sea Surface Temperature, using sattelite based estimates of SST in the later years of the record. These are, again, distinct from the LT data, which are bulk atmospheric.
Hmm … an odd thing just happened. Thought I’d look at some data that ought to be as good as it gets instead so (with future NAO changes half in mind too) I chose Valentia Observatory.
This site is on the south west tip of Ireland right in the face of the gulfstream, in a rural location, well maintained and pretty renowned – all as noted by John Daly years ago (God rest his soul). To check out the location, see satellite view on Google Maps.
So, about 6:30pm UK time I fetch the data. Confusingly, six datasets with IDs covering periods as follows:
621039530000 1880-1991
621039530001 1949-1990
621039530002 1961-1990
621039530003 1961-1990
621039530004 1961-1980
621039530005 1987-2009
I begin by looking at the first and see the other columns. Thinking these must be averages I check out the four quarters and what I assume is the annual (metANN) by averaging the months just as a sanity check to see what I’m dealing with here. They’re not derived from the month columns so I decide the whole lot must come from daily observations at a minimum and would therefore not tie up precisely anyway. I take a break for food, etc.
On return I look at the overlaps and, since all files contain different entries, I decide they probably relate to different instruments that have been introduced/retired over time. Just to check I had the dates and ID numbers right (renamed from default station.txt) I have another look at the WEB site at around 01:00am.
Whoa! Now there is only ONE dataset. 621039530005 has been replaced and the others are not shown. This file now says it covers 1880-2009 (actually 1881-2009 internally).
A quick look reveals the figures in the old files do not tie up with those in the new one. For years since 1987 (which only appear in the last old and new file) some monthly values are different and additional 999.9 entries have appeared. I have not looked at previous years in detail yet.
Whatever is going on here? It suggests things are being re-worked before our very eyes and possibly being derived from base data elsewhere. If there’s a simple explanation I’m not aware of, please let me know. Anthony, if you want the files (old and new) drop me an email with instructions on how to get them to you.
PoFarmer:
“So, where does the satelite data fit in?”
I think you already know the answer, but unlike the surface stations, the satelite data is scrutinized in every detail for any possible error. That is how data should be analyzed and we welcome it.
I honestly do not care one way or the other if the Earth is warming or cooling.
All I care about is the integrity of the raw data and honest analysis, no matter where it may lead.
But from an “old fart” that has been working with weather satellites since 1972, I kinda trust that data when properly processed.
Oh, how wish the world could be made aware of Anthony Watt’s surface station work !!
TerryBixler (09:55:43) :
It seems that the goal is not to measure temperature but to stop measuring temperature.
They certainly have some explaining to do.
Nick Stokes (17:27:43) : Have you ever seen GISS’s record suddenly arbitrarily change noticably due to new data? I haven’t, and that’s my basis.
Incidentally, surely the interpolation’s reliability is dubious when the underlying climates of two areas are very different? Much of interior Africa is interpolated from the Coasts-that’s like measuring the temperature in Kansas as a mean of San Francisco and Raleigh.
Anyway, the point is, there are areas of very low data availability on a regular basis.
Tracking satellites since 1972?
Yup, weather satellites did not suddenly appear around 1979 like some people would like you to believe. That is the time when satellite data analysis became somewhat reliable and was archived in an official way.
Back at the Fernbank Science Center in Atlanta George, I was tracking and obtaining weather satellite images in 1972. Rude and crude, since you had to use a circular slide rule to compute the location of the satellite at one minute intervals as it passed over your location, but it was possible to obtain a decent APT image.
Scientific Atlanta donated the satellite equipment that I was using and it was based upon a Polaroid camera and a Tektronic oscilloscope to create the image, one scan line at a time. The operator had to track the antenna manually, according to the locations as calculated with the circular slide rule.
Using the Emory university IBM 360 computer, I soon learned how to program computers to calculate the satellite positions. The rest is a rather interesting personal history.
Do I trust the satellite derived temperature data? ABSOLUTLY!
DaveE (11:14:59) :
That and this…
It seems that some sort of law is being broken with this change of data at GISTemp.
It also seems that there should be full openness, a willing openness also, by GISTemp employees of before and after data, the methods for the change, and most importantly, the reasons for the change.
Anything but willing openness creates suspicions.
let’s connect a couple of dots here…
From Monckton’s piece linked by Ed Scott (13:23:32) there is re Lindzen…
“The clincher is Professor Richard Lindzen’s meticulous recent paper demonstrating – by direct measurement – that the amount of radiation escaping from the Earth’s atmosphere to space is many times greater than the UN’s models are all told to believe. From this, the world’s most formidable atmospheric physicist has calculated that a doubling of CO2 concentration, expected over the next 150 years, would cause 0.75 C (1.5 F) of warming, at most: not the 3.4 C (6 F) that the UN takes as its central estimate.”
So the planet is radiating more longwave radiation to space than the models calculate.
George E. Smith (13:47:20) may have the reason why. From his comment…
“But consider the long wave infra-red radiation emitted from the surface. That varies about as the 4th power of the temperature. And if you take the 4th power of a sinusoidal function, oand integrate it over a full cycle, you will get an always positive offset, that depends on the amplitude of the cyclic variation, relative to the average or DC temperature. For typical daily temperature ranges from max-min, that offset is significant; and when you consider the cyclic temperature range for the annual cycle through four seasons, the underestimate of total emitted LWIR is quite significant; and failure to properly calculate it (by using average temperatures), always underestimate the global emittance, which leads to an over estimate of the mean global temperature required to balance the total solar insolation.”
So the temperature series are not reflective of true average temperature, which is more serious than mere weather noise, and thus the calculation of radiative emission is underestimated.
Or am I looking in the wrong wheelhouse?
Pofarmer (18:51:27) :
“So, where does the satelite data fit in?”
You know, I think at also depends on how the satellites calculate ‘average’ temperature.
It’s still possible we’re comparing apples and oranges not just average temps at the surface vs average temps in the lower troposphere.
Steve Huntwork (19:47:51) : According to:
http://www.uah.edu/News/climatebackground.php
The MSU’s started in November 1978-with TIROS-N
How bad is the data? It is a joke that anyone thinks they or others are doing science with it. There are 33 stations listed within ~130 mi of me in western Colorado, only one of which is listed as current to 2009. Many, 22, go back 100 years or more. One, Collbran is listed as active, 1900-1999. Funny thing is, I surveyed that site earlier this year, and the folks there are still dutifully recording data. Between cherry-picking what stations to count, and UHI effects, there is nothing to believe about the data, or even the capacity to measure a 0.7° change. Correlation may not be causation, but this stinks of something other than anthropogenic CO2: http://i27.tinypic.com/14b6tqo.jpg
Correct with the Microwave Sounding Unit data starting in 1978. However, when it comes to polar ice or cloud induced albedo, that data has been available over a longer period of time.
I got involved with the MSU using the DMSP satellites prior to the first Gulf War with Iraq. By the time that war started, the software had been perfected and was able to obtain accurate upper-air weather conditions behind enemy lines.
This is when I learned to respect the MSU satellite products, because they work.
It seems that the September 2009 map shows more stations than the April 2008 map. Have the number of stations increased from 2008? Where can I find a list of those stations which are reporting temperature data until 2009?
timetochooseagain (19:46:22): Steve Huntwork (17:45:12):
Again, let me make my main point, which is that the plot shown in the head post for April 2008 is not current, and exaggerates the missing posts. I found out more of its provenance. Bob Tisdale showed the plot, as it appears here, in a post dated 20 May 2008. That means it came out within a few days of the end of the data period, and would certainly have data omitted from stations yet to report. Many more stations are shown in the current version.
I’m agreeing with TTCA about the smallness of subsequent adjustments, although his basis is anecdotal. In the initial global average, missing stations would be interpolated. The small adjustment shows that, on average, the interpolation is unbiased.
Hansen and Lebedeff (1987) have a lot to say about the distribution of GISS stations. They deal with the issue of correlation of adjacent stations – see their Fig 3.
Andrew (09:52:02) :
Based on UAH data I calculate that the Hadcrut data has a warming bias of about .07 degrees per decade over the period that the two records overlap.
Could you explain what you’ve done? The reason I ask is that since ~1992 the Hadley and UAH trends have been very similar (UAH slightly warmer than Hadley).
UAH v Hadley since 1992
http://www.woodfortrees.org/plot/hadcrut3vgl/from:1992/offset:-.2/plot/uah/from:1992/plot/hadcrut3vgl/from:1992/offset:-.2/trend/plot/uah/from:1992/trend
you know, there are so many words have been already said about the problem of global warming and temperature that it seems to be nothing new anymore. A person kills the planet by itself. and all these talks are just attempts to do something. but everything stays the same.
Jari: This is the list of stations actually used: http://data.giss.nasa.gov/gistemp/station_data/station_list.txt.
But that list includes a lot of stations not reporting anymore, you’ll have to look them up here: http://data.giss.nasa.gov/gistemp/station_data/ to find out when they stopped reporting.
Aligner: I think you just used http://data.giss.nasa.gov/gistemp/station_data/ with different settings for the “Data set” menu. You can get the original data or the combined data or the homogenized data by choosing different settings.
Syl(20:35:58) quoting Lord Monckton and connecting dots:
But this is just false, and ridiculous. If it were true, we would have an Ice Age within days. Lindzen said no such thing. What he claims is that the correlation of change in flux with change in SST is positive (ERBE) instead of negative (GCMs), and that is where he gets the lower sensitivity.
Syl (20:35:58) :
Your error is that the temperature in K is always positive. The sinusoidal modulation is overlaid on that.
DaveE.
I’ve gone fishing at the Ripogenus Dam a few times in the 1990’s. I think my cousin the climatologist would be a bit surprised to hear that the site stopped being used for GISS. I know U Maine – Orino’s geology, hydrogeology, climatology, and related departments regularly did field expeditions to the lake as there is a boom house there owned by Boston U that U Maine students use for field studies there (the fishing in the lake is fantastic).
It seems to me like those of us who are fans of the surfacestations.org project should organize a new network of independent weather stations properly sited in locations that will remain undeveloped for long periods, like public parks.
Hi to all and especially Lucy Skywalker.
Thanks for the contact. I am very happy to help with the work on historic weather stations information in the UK. As stated in my earlier statement, a cursory study of the Ross on Wye weather data going back to 1850 show very little change in temperature. I have downloaded 48 full scap pages of numbers. I would like some help turning these into meaning full graphs etc.
Other than ‘Astateofdenmark’ I think that I must be the only person in the UK that is challenging the climate warming lobby.
It is so bad in the UK that at Manchester University they tried to classify any one challenging global warming as suffering with mental illness!!!!
The reason I am studying the climate information is that I was tired of just listening to people telling me what I have to do to combat global warming. When I searched for the raw data on global warming I found it decidedly difficult to find a web site that did. If you go onto the official English Met office and look at global warming you find the usual statements of ‘ It is happening so get over it ‘ attitude. The same is also on the Royal society web site where they spend most of their energies dismissing the anti global warming arguments. There is no graphs or raw figures or scientific information to back up their position.
If there is anyone in the UK willing to continue with promoting the information found on this web site please contact me on james.brisland@mail.com
Thanks
“The scientists of the world are conspiring to fool us about global warming!”
Quite a hypothesis (again), Joe.
http://ossfoundation.us/projects/environment/global-warming/myths/station-drop-out
Read about GISTemp here:
http://data.giss.nasa.gov/gistemp/
I guess station dropouts have caused rapid warming in the Arctic and a tremendous buildup of heat in the oceans since 1950? There does seem to be a strong correlation.
See: http://www2.sunysuffolk.edu/mandias/global_warming/modern_day_climate_change.html
Finally, the oceans cover 70% of the surface. How much urbanization on the ocean surfaces has caused their temperatures to be artificially heated? 🙂
A good article about how surface temps are measured can be found here:
http://www.yaleclimatemediaforum.org/2008/04/common-climate-misconceptions-global-temperature-records/
Mizen2
You are completely mistaken in your understanding, as there are many thousands of people in the UK actively challenging climate change theory at all levels of society, including govt and scientific forums. Even the BBC has now recognised something is going on, partly due to a huge amount that is going on behind the scenes. Only some of this is manifested in forums such as this.
The Global temperature figures worldwide back to 1850 are highly slanted and disguise the fact that many individual datasets show cooling in that period as well, of which an increasing number are now falling into a 30 year trend due to the last ten years cooling.
Various people are already working on these dubious datasets and there may be duplication of effort. Please visit the EM Smith website by just googling
“Chiefio” I am also working on these datasets.
Catastrophic climate change has been mainly politically driven since 2003 and I hope to publish a major article on this aspect shortly.
You are by no means alone.
tonyb
Scott Mandia,
in one of your links Gavin says: “station dropping out doesn’t affect the trends at all (you can do the same analysis with only stations that remained and it makes no difference)”. Gavin is confident that he can get the temperature correct even if there is 1200 km between stations.
I do not quite understand this statement. How many more stations can be dropped out before the trends will be affected? How it is possible that September 2009 GISSTemp can show almost all Greenland 0.5 to 4 degrees hotter than normal (with the 1200 km smoothing radius) when the 250 smoothing radius shows that there was NOT ONE single station used for the whole Greenland in September 2009 (in GISSTemp)?
I would think that Greenland temperature trends should be very important for global temperature trends and monitoring climate change in general.
Jari (05:25:10) :
Of course it can be done Jari!
Everyone knows that the climate in the Shetlands or southern Norway is identical to that at Lands End 😉
DaveE.
John Finn (00:32:02) : Again, this is 1. Highly misleading and 2. Meaningless.
OF COURSE starting in 1992, right after Pinatubo, will elevate the trends, and because the response of the UAH data is greater, it will be elevated more.
But “agreement” means nothing, sense it is quite clear that the LT should warm more.
So let me explain what I did. First, I took the UAH and Hadley data, put them on the same baseline, detrended them, calculated the coefficient of a OLS best fit of the residuals of one to the other, then used that to adjust the original UAH data to the implied surface data. This resulted in a trend of about .09 degrees per decade, while the trend in Hadley was a little more than .15 degrees per decade. I would say that it is probably more accurate to say that the bias was something like .06 degrees per decade.
Scott Mandia (04:07:16) : Did Joe ever say that the bias in the record caused all the warming? No, he didn’t. So why are you devoting energy to tearing down that strawman.
DaveE (06:25:32) :
Jari (05:25:10) :
Of course it can be done Jari!
Everyone knows that the climate in the Shetlands or southern Norway is identical to that at Lands End 😉
DaveE
Hey, I live around 1200kms from the Alps in the South Of England so I will just nip out and do some skiing as our climate is the same as Val’ d’isere.
Tonyb
@ timetochooseagain (07:07:22)
Joe claims:
Numerous peer review papers suggest an exaggeration of the warming by 30%, 50% or even more. without citing them, of course.
He also posted awhile back about UHI and applied his land-based UHI correction to the oceans. Huh?
Joe may not have explicitly stated how much warming he thinks UHI has caused but he is strongly implying that it is significant.
The problem with his arguments is that UHI is, for the most part, insignificant.
RSS (0.18 C per decade) and UAH (0.14 C per decade) satellite-only derived temperatures show about 0.16 C per decade of warming since 1979, and GISS and HadCRU which use both surface data and satellite data show 0.16 C per decade. Where is the UHI?????
Urban heat island effects are real but local, and have not biased the large-scale trends. A number of recent studies (see IPCC 2007 Chapter 3) indicate that effects of urbanization and land use change on the land-based temperature record are negligible (0.006ºC per decade) as far as hemispheric- and continental-scale averages are concerned because the very real but local effects are avoided or accounted for in the data sets used.
Joe has a conclusion and is looking for data to support it – not scientific method at all.
Watch “The Day After Tomorrow”. Dennis Quaid explained it all.
The raw versus the cooked:
Who needs that old musty data anyway? As noted in Patrick J. Michaels’ essay, “The Dog Ate Global Warming,” we still have Phil Jones’ “Value-ADDED” versions. What more do you want?!
Alfred E. Newman could have handled this issue.
What? Me worry?
TonyB and DaveE,
yes, it is quite amazing how uniform the temperature is over large areas. And in Greenland you do not need even one thermometer to get accurate data for the whole island.
And of course the biggest warming signal is in the Arctic where there is not much measured temperature data anymore. Maybe when even more stations are dropped the smoothing radius can be increased to 6 378 km and we use only one thermometer to measure global warming…
[youtube=http://www.youtube.com/watch?v=RVT6o6LUxmw&hl=en&fs=1&]
Scott Mandia (08:33:57) : The papers he refers to are:
Block, A, Keuler, K., Schaller, E., 2004, Impacts of anthropogenic heat on regional climate patterns, Geophysical Research Letters, 31, L12211, DOI:10.1029/2004GL019852
de Laat, A.T.J., and A.N. Maurellis (2006). “Evidence for Influence of Anthropogenic Surface Processes on Lower Tropospheric and Surface Temperature Trends.” International Journal of Climatology 26:897—913.
Kalnay, E., Cai, M., Impacts of urbanization and land-use change on climate, 2003, Nature, 423, 528-531
Karl, T.R, 1995: Critical issues for long-term climate monitoring. Climate Change, 31, 185.
McKitrick, R.R. and P.J. Michaels (2007), Quantifying the influence of anthropogenic surface processes and inhomogeneities on gridded global climate data, J. Geophys. Res., 112, D24S09, doi:10.1029/2007JD008465.
McKitrick, R and P. J. Michaels (2004). “A Test of Corrections for Extraneous Signals in Gridded Surface Temperature Data” Climate Research 26(2) pp. 159-173. “Erratum,” Climate Research 27(3) 265—268.
Pielke Sr., R.A., C. Davey, D. Niyogi, S. Fall, J. Steinweg-Woods, K. Hubbard, X. Lin, M. Cai, Y.-K. Lim, H. Li, J. Nielsen-Gammon, K. Gallo, R. Hale, R. Mahmood, S. Foster, R.T. McNider, and P. Blanken, 2007: Unresolved issues with the assessment of multi-decadal global land surface temperature trends. J. Geophys. Res., 112, D24S08, doi:10.1029/2006JD008229
Pielke Sr., R.A. J. Nielsen-Gammon, C. Davey, J. Angel, O. Bliss, N. Doesken, M. Cai., S. Fall, D. Niyogi, K. Gallo, R. Hale, K.G. Hubbard, X. Lin, H. Li, and S. Raman, 2007: Documentation of uncertainties and biases associated with surface temperature measurement sites for climate change assessment. Bull. Amer. Meteor. Soc., 88:6, 913- 928.
Among others:
http://icecap.us/images/uploads/US_AND_GLOBAL_TEMP_ISSUES.pdf
“RSS (0.18 C per decade) and UAH (0.14 C per decade) satellite-only derived temperatures show about 0.16 C per decade of warming since 1979, and GISS and HadCRU which use both surface data and satellite data show 0.16 C per decade. Where is the UHI?????”
First, the LT should warm more than the surface, second, the Satellite datasets are not equal, RSS clearly has a spurious step in 1992, third, I have no clue where you get your UAH rate but it does not accord with the file, which gives a rate of 0.13 per decade, and finally, YES Joe has made mistakes on this issue, I was one of those who pointed them out, but that does NOT mean that the surface data do not have a serious issue-they almost certainly do.
“”” bob paglee (14:36:52) :
George E. Smith 13:26;58 states:
The drop out of rural data points is critical here.
For me, the most accurate way of measuring global temperature, free of UHI effects, is to SOLELY use rural stations.
This article shows either a cunning plan since 1990 to artificially drive the ‘global warming’ agenda, or a rather fortuitous series of events which happened to make such an agenda more likely to apparently fit the hypothesis. “””
Bob, Absolutely nothing contained in the “”” — “”” above is anything I said. Those are simply cut and pastes from womeone else I was citing.
Virtually everything I post here is either something I clipped from someone else, or is my own words (including typos); and it is easy to separate them. I always use “”” — “”” as a format to refer to someone elses work. thats three double quotes followed by three spaces; then the cited text, then three spaces, and the closing three double quotes.
I do that so there is no question as to what I say (which is in plain text without quotes), and what is something I am lifting from another author.
For a large fraction of the postings at WUWT, I cannot distinguish who said what. So use Italics or some other font trick to delineate cited information; but there’s no guarantee that formatting survives everybody’s browsers.
So bottom line; if you do in fact agree with that first sentence as you say; you are agreeing with what somebody else said; not something that I said. My position on what otherws say should be apparent from what I add to their stuff that I lifted.
You can’t delineate citings from self comment by simply doing a paragraph spacing. Good writing would do that just for clarity anyway.
George
Scott Mandia (08:33:57) :
RSS (0.18 C per decade) and UAH (0.14 C per decade) satellite-only derived temperatures show about 0.16 C per decade of warming since 1979, and GISS and HadCRU which use both surface data and satellite data show 0.16 C per decade. Where is the UHI?????
1.8 C/century, 1.4 c/century, and 1.6 c/century, respectively. Where is the positive feedback???????
“”” George E. Smith (10:42:57) :
“”” bob paglee (14:36:52) :
George E. Smith 13:26;58 states:
The drop out of rural data points is critical here. “””
Re above.
Bob, there isn’t; and there cannot be, any “optimum” mixture of “urban” versus “rural” temperature measuring stations.
First of all remember that what GISS and Hadcrut, UAH and RSS report are NOT global temperatures; they are anomalies, which means some machinations have already been performed on whatever the thermometer siad at the time it was read.
BUT! If you wanted to measure the true average global surface Temperature; it is a simple 8th grade science project to figure out how to do that. By “surface” Temperature, I mean the Temperature at the boundary between the contiguous atmosphere, and that which is not atmosphere; usually either oceans (73%) or land (27%).
1) Divide the surface up into cells; each with some cell area.
2) Read the Temperature from a thermometer in the center of each cell.
3) Multiply the Temperature by the cell area.
4) Sum all the Temperature*Area products.
5) Divide the total of those products by the total surface area of the Earth.
The result is the true global average temperature, at that instant when all the thermometers were simultaneously read.
6) Repeat 1-5 periodically for say a whole year.
7) Take the average of all of the results from 6.
The result is the annual mean global surface temperature.
PROVIDED; that the size of the cells is such that the single temperature reading from the cell center, is truly representative of the temperature over that cell area; and provided that the process is repeated often enough to follow any cyclic variations in those temperatures.
The strict rules for adequacy of either the cell size or the reading frequency are set down in the general principles of Sampled Data System theory, and in particular the Nyquist Sampling Theorem.
Now notice I said this was an 8th grade science project; but if you read what I actually wrote; I said the project was to figure out HOW to do that; certainly NOT to actually try doing it; because the resources required to do it are actually beyond our capabilities; we don’t have enough thermometers on eqarth to actually carry out the task.
Well we don’t; but Gaia does. Every single atom or molecule, is one of Gaia’s thermometers. Each registers its local temperature directly in the form of the average energy per degree of freedom, that that atom or molecule has.
Gaia takes everyone of those into account in deciding what the climate should be; and she always gets the right answer because her sampling strategy is impeccable.
There’s no chance we can equal her performance; but we sure should be able to doa heck of a lot better than we do.
Where UHIs create problems is not that they give an incorrect temperature reading; but that the reading obtained is erroneously applied to adjacent areas for which it is not a valid temperature reading.
The fallacy that seems to go unrecognized, is that for a given set of actual real thermometers that are used ; let’s say to obtain GISStemp results; the prevailing process (AlGorythm) that is used seems to record a relatively continuous, and well behaved function; and the values cnage relatively smoothly from time to time. That lulls us into believing those results are real.
Well they actually are real results for GISStemp; whatever that is (Hansen knows).
What they are not, is a real representation of the temperature of the earth; just the values of GISStemp.
Hansen; might just as well be averaging the phone numbers in the Manhattan Telephone directory, and reporting the changes, as they from time to time republish that.
An exercise he gets paid to do; but which has no underlying scientific basis for doing.
George
John Finn (00:32:02) : Again, this is 1. Highly misleading and 2. Meaningless.
There’s nothing misleading about it. I chose 1992 because that’s round about the time of the reduced number of stations.
OF COURSE starting in 1992, right after Pinatubo, will elevate the trends, and because the response of the UAH data is greater, it will be elevated more.
There’s no “OF COURSE” about it. I accept the effect of Pinatubo will increase the trend but it’s not obvious that the UAH trend has been more affected than the Hadley trend. I”m not arguing about the magnitude of the trend I’m arguing about the similarity. Like it or not the trends are similar. (UAH shows slightly more warming). In fact if you adjust GISS and Hadley monthly anomalies to the satellite base period (1979-98) you’ll find they’re quite consistent with the satellite anomalies.
e.g
GISS Sept anomaly is +0.65 but relative to the 1979-98 base period the anomaly is +0.45, so we have
UAH +0.42
GISS +0.45
RSS +0.48
But “agreement” means nothing, sense it is quite clear that the LT should warm more
Separate argument.
John Finn (12:22:40) : “There’s nothing misleading about it. I chose 1992 because that’s round about the time of the reduced number of stations.”
Bull. It is absolutely misleading.
“There’s no “OF COURSE” about it. I accept the effect of Pinatubo will increase the trend but it’s not obvious that the UAH trend has been more affected than the Hadley trend.”
B.S. again, the response to Pinatubo is much greater in the UAH record:
http://www.woodfortrees.org/plot/hadcrut3gl/mean:12/offset:-.15/from:1991/to:1996/plot/uah/mean:12/from:1991/to:1996
“Separate argument.”
You are trying to separate the arguments so that no one can criticize your sacred cow.
Like it or not, using non cherry picked and manipulative comparisons, you are just wrong, the surface clearly has a warm bias.
@ Andrew (10:28:16) :
Thank you for the extensive information. Joe should try to publish this in a journal instead of presenting it at The Heartland Institute conferences which are not taken seriously.
Joe’s article does a bit of cherry-picking, does it not?
At the end of the day (decade) we are still left with the following conclusions:
1) All 4 data sets show a warming climate in the past three decades.
2) They are fairly close in agreement with warming rates (one cannot just throw out RSS because they do not like the results).
3) Joe suggests that there is a serious enough UHI bias that we cannot use this data for policy decisions.
4) There is literature that shows UHI and no UHI but the data from point #1 doesn’t show UHI.
5) There is a plethora of actual observed effects of rapid climate change if we choose to ignore surface data. Shall we ignore those also?
@ Tim Clark (11:10:36) :
One cannot use a present day decadal rate and multiply it by 10 to get a century rate. The feedbacks are coming – you should not assume that the climate reacts to increased GHGs rapidly. The oceans are buffering the effect quite a bit. The models also show that much of the wamring will be in the later parts of this century.
About 1/2 of the CO2 has been added since the 1970s. The warming and feedbacks are coming, unfortunately.
When a new religion takes over, the most important thing to do is preempt or hide (destroy) all old records that might be contrary to their teachings. Is this happening to the published temperature records? I believe many of the stations, not published, are still being recorded. ( see mizen2 (03:51:19) :above) especialy in rural areas. Thank god for inertia in record keeping. Maybe these need to be privately collected and published, as they are no longer wanted by the powers that be.
Airport temperature recordings are about worthless for weather or climate record purposes.
“The warming and feedbacks are coming, unfortunately.”
No it isn’t. Would that it were. Heat can’t hide except in cartoons.
Andrew (12:42:45) :
John Finn (12:22:40) : “There’s nothing misleading about it. I chose 1992 because that’s round about the time of the reduced number of stations.”
Bull. It is absolutely misleading.
The fact that you keep sayiing it’s misleading doesn’t make it so.
There’s no “OF COURSE” about it. I accept the effect of Pinatubo will increase the trend but it’s not obvious that the UAH trend has been more affected than the Hadley trend.”
B.S. again, the response to Pinatubo is much greater in the UAH record:
Ok let’s take it from 1994 …..
http://www.woodfortrees.org/plot/hadcrut3vgl/from:1994/offset:-.2/plot/uah/from:1994/plot/hadcrut3vgl/from:1994/offset:-.2/trend/plot/uah/from:1994/trend
Big difference – instead of the UAH trend being a couple of hundredths of a degree (per decade) warmer Hadley’s now a couple of hundredth’s warmer. Both are well within the stated error bars of each other whichever start point you use.
Scott A. Mandia (13:31:03) :
@ Tim Clark (11:10:36) :
One cannot use a present day decadal rate and multiply it by 10 to get a century rate. The feedbacks are coming – you should not assume that the climate reacts to increased GHGs rapidly. The oceans are buffering the effect quite a bit. The models also show that much of the wamring will be in the later parts of this century.
About 1/2 of the CO2 has been added since the 1970s. The warming and feedbacks are coming, unfortunately.
You’re correct, the oceans are a buffer. Unfortunately for your predisposition, the “cool” PDO will not help your cause. Using a present day decadal rate is precisely what is imbedded in the models. Your models hyperventilate about the last 30 years of warming (about 1.5/century) and then extrapolate that into the future. Where’s the thermal energy hidden. Not in a negative PDO. According to predictions, we’re ~.5 degrees behind the eight ball right now. To catchup requires immense positive feedback. We shall see this winter.
Scott Mandia, you post here so much in disagreement with the blog in general without bad-mouthing, which is good. But I think you need to go a lot further back to basics, further than I’ve seen you go so far, and you need to check yourself more carefully lest you merely support strawman arguments.
Re your 5 points (@ 13:31:03):
I don’t think anyone is disputing or ignoring the general agreement of the 4 temperature records that show recent rises in temperature, at least up to 2000. Concern about inadequate allowance for UHI, or about other problems with surface data, is not “ignoring surface data”. Now this “plethora of actual observed effects of rapid climate change” that you mention – I have not come across a single such harmful effect that is both relevant to today and true. May be true but irrelevant, or relevant but untrue, or relevant but harmless or beneficial, or relevant but misleading, or would be relevant only if at least one part of the basic AGW thesis of (a) unparalleled warming (b) CO2 as cause were substantially, transparently proven true. But perhaps you can enlighten me. Perhaps I’ve missed those plethora somehow. I would not like to be accused of ignoring important data.
The PDO cannot explain the long term trend. Just like the shorter-term El Ninos and La Ninas, PDOs effectively cancel out in the long run and the underlying AGW trend sticks out like a sore thumb.
Here are some good links for those of you who are unfamiliar with PDO:
http://www.skepticalscience.com/Pacific-Decadal-Oscillation.htm
http://www.jisao.washington.edu/pdo/
I could not believe how awful the GISS records might be until I started working with them, doing UK blink comparators for Ellie. I think my response reactions are still too much in the expletives stage, but that will pass… I shall channel it into better science…
Scott Mandia (08:33:57) : Joe… is strongly implying that [UHI] is significant. The problem with his arguments is that UHI is, for the most part, insignificant.
It would be great to have a post on UHI. I am certain Scott Mandia is wrong but it would be good to have the evidence of this spread out again. And I think we are going to need calibrators for UHI that we can trust, to try to reassemble a trustworthy global surface temperature record, though I understand Chiefio’s reasoning that we should only use rural sites. Personally I want to see the really long old records reinstated but with decent UHI corrections. The original keepers took a lot of care with them and I would rather have a few good records than a thousand botched ones. My guess is that many of the old records are still somewhere, in somebody’s archives, and may still exist, even if GISS or CRU have ignored or deleted them.
Scott A. Mandia (13:31:03) :
“1) All 4 data sets show a warming climate in the past three decades.”
Yes, although this really doesn’t say much, sense the 2 non satellite products are essentially analyses of the same data.
“2) They are fairly close in agreement with warming rates”
Not when one takes into account expected-and empirical-amplification
“(one cannot just throw out RSS because they do not like the results).”
No, one can however cite serious arguments that RSS is not a good data set. which I would indeed:
Christy, J.R. and W.B. Norris, 2006: Satellite and VIZ-Radiosonde intercomparisons for
diagnosis on non-climatic influences. J. Atmos. Oc. Tech., 23, 1181 – 1194.
Christy, J. R., W. B. Norris, R. W. Spencer, and J. J. Hnilo, 2007: Tropospheric
temperature change since 1979 from tropical radiosonde and satellite measurements,
J. Geophys. Res., 112, D06102, doi:10.1029/2005JD006881.
Christy, J.R. and W.B. Norris, 2009: Discontinuity issues with radiosondes and satellite
temperatures in the Australian region 1979-2006. J. Atmos. Oc. Tech., 26, 508-522,
DOI: 10.1175/2008JTECHA1126.1
Sakamoto, M. and J.R. Christy, 2009: The influences of TOVS radiance assimilation on
temperature and moisture tendencies in JRA-25 and ERA-40. J. Atmos. Oc. Tech.,
doi:10.1175/2009JTECHA1193.1.
Randall, R. M., and B. M. Herman (2007), Using Limited Time Period Trends as a Means to Determine Attribution of Discrepancies in Microwave Sounding Unit Derived Tropospheric Temperature Time Series, J. Geophys. Res., doi:10.1029/2007JD008864, in press
All of which find specific issues with RSS and similar data, and find UAH to be the more consistent data set, both internally, and with the best radiosonde data sets.
“3) Joe suggests that there is a serious enough UHI bias that we cannot use this data for policy decisions.”
It’s more than UHI but “use for policy decisions” does not have a clear meaning and I don’t find it particularly relevant. What is clear is that the surface data exaggerates the warming and therefore exaggerates the “problem” motivating policy makers.
“4) There is literature that shows UHI and no UHI but the data from point #1 doesn’t show UHI.”
See my response to point one. And again, it’s more than just UHI
“5) There is a plethora of actual observed effects of rapid climate change if we choose to ignore surface data. Shall we ignore those also?”
You miss the point. Again. Yes, there’s warming. I don’t know what the qualifier “rapid” is there for, but magnitude of the “problem” matters.
“He who refuses to do arithmetic is doomed to talk nonsense” and I tire of the qualitative defense of warming. Yawn.
John Finn (15:23:03) : You really deserve to be ignored for being incredibly thick. Look at the fluctuations. It’s clear that UAH goes up and down more. So why is the trend even slightly less?
If you misdirect with nonsense about “separate issues” you have lost and I will ignore you.
“The fact that you keep sayiing it’s misleading doesn’t make it so.”
Except that I give specific reasons. [snip ~ E].
@ Lucy Skywalker (16:13:00) :
I have not come across a single such harmful effect that is both relevant to today and true
I suggest you read IPCC 2007 WGII: Impacts, Adaptation and Vulnerability
http://www.ipcc.ch/publications_and_data/publications_ipcc_fourth_assessment_report_wg2_report_impacts_adaptation_and_vulnerability.htm
@ timetochooseagain (16:56:46) :
1) Yes, although this really doesn’t say much, sense (sic) the 2 non satellite products are essentially analyses of the same data.
2) No, one can however cite serious arguments that RSS is not a good data set….All of which find specific issues with RSS and similar data, and find UAH to be the more consistent data set, both internally, and with the best radiosonde data sets.
How can you make these two statements back to back? FYI: 4 of the 5 references that you claim show RSS is not a good data source are from the folks who run UAH. Conflict of interest?
3) What is clear is that the surface data exaggerates the warming and therefore exaggerates the “problem” motivating policy makers.
Actually, the surface data does not even begin to show the warming that is here and will be coming. The oceans have taken in almost half the CO2 and about 95% of the excess heat.
4) “He who refuses to do arithmetic is doomed to talk nonsense” and I tire of the qualitative defense of warming. Yawn.
If you took the time to review my Website, which is filled with data from peer-reviewed experts, you could not accuse me of a qualititative defense. I am sorry if I am boring you with my simple language here but I am not here to try to change your mind. I post here because I hope that the lurkers out there compare my comments to the regulars here so that they can hear the other side of the AGW debate – the side that has overwhelming support by the majority of experts in the field.
[REPLY – Do bear in mind that you get this opportunity because we moderators encourage that both sides be heard. And that is not the case on most prominent pro-AGW blogs. ~ Evan]
Scott Mandia
I enjoy your comments, you are a thoughtful and courteous debater and yes I have visited your site.
Several times I have pointed out here about historic precedents and you have said that was something you didn’t know about it and would go away and have a think about that aspect. (arctic ice variations, glaciers being higher in MWP and Roman times etc) it. I never get any feedback on that and the belief that all this is happening for the first time remains unchallenged on sites such as yours.
Do any of these well documented cases of cyclic variations in our climate that predate satellite data ever give you pause for thought?
best regards
Tonyb
Scott Mandia (20:34:34) :
I suggest you read IPCC 2007 WGII: Impacts, Adaptation and Vulnerability
I suggest that many have. The problem with the IA&V is that none of it matters if “The Physical Science Basis” is faulty or even slightly so. If I hand an agricultural specialist a “scenario” in which the US warms by 3°C and ask for a probable outcome, I get a chapter of doom and gloom but I would get just the same result back if I gave a -1°C change scenario.
Actually, the surface data does not even begin to show the warming that is here and will be coming. The oceans have taken in almost half the CO2 and about 95% of the excess heat.
Your suggestion seems to be that SAT is showing just some tiny fraction of the “real” warming? And don’t warming Oceans hold less CO2 not more? Hmmm…. colour me confused.
Scott Mandia: “Actually, the surface data does not even begin to show the warming that is here and will be coming. The oceans have taken in almost half the CO2 and about 95% of the excess heat.”
yes, and the ocean heat content has been sinking for a while now. Now SST is also going down. I wouldn’t be surprised if we’ll see a drop in land temperatures over the next few months. OHC seems to be the only reasonable measure of a warming earth. Unfortunately, records go no longer back than 1955, which means that they start at a local temperature minimum. We know that at least the Barents sea was just as warm around 1940 as it is now, so what if the global OHC was comparable to today’s values around that time? Even if it was lower: by how much? And would it mean that the difference between 1940 and today is due to AGW, or is it just a natural recovery from the LIA?
John Finn (15:23:03) : You really deserve to be ignored for being incredibly thick. Look at the fluctuations. It’s clear that UAH goes up and down more. So why is the trend even slightly less?
The largest relative difference is in 1998 which is near the start of the record is likely to dampen the UAH trend. Let’s take it from 2000
http://www.woodfortrees.org/plot/hadcrut3vgl/from:2000/offset:-.2/plot/uah/from:2000/plot/hadcrut3vgl/from:2000/offset:-.2/trend/plot/uah/from:2000/trend
Ooops. UAH now warming more than Hadley.
If you misdirect with nonsense about “separate issues” you have lost and I will ignore you.
Ok – can I assume from this you believe that the models are correct, i.e. the troposphere really is warming at ~1.2 times the rate of the surface. Also you seem to believe that non-climatic land-based factors just happen to have offset the surface/troposphere warming difference.
timetochooseagain (16:56:46) :
Take a look at this Lucia link and scroll down to the first graph.
http://rankexploits.com/musings/2009/adding-apples-and-oranges-to-cherry-picking/
It shows the trends from Sept of each year (1989-2004) until August 2009. Note all 5 records are pretty close over the longer term (i.e. 14+ years). Hadley and the satellites (UAH/RSS) remain in lock step right up until ~2000. There is divergence after that. This is where the magnitude of the fluctuations becomes more influential, i.e. over the very short term. Since 2004 we’ve moved from predominantly El Nino-type conditions to the La Nina cooling of 2008. If UAH and RSS measure a greater response than Hadley, the trends will differ over this period. As the period lengthens the difference will reduce.
Also I reckon there’s reasonable evidence that the earlier GISS divergence is related to the GISS arctic extrapolation.
@ Scott Mandia (20:34:34) :
In response to Evans comments:
Do bear in mind that you get this opportunity because we moderators encourage that both sides be heard. And that is not the case on most prominent pro-AGW blogs. ~ Evan
Yes, this site is to be commended for that policy. I have thanked AW more than once for allowing me to post here. And I have learned from researching that I must do in order to provide an effective reply to some comnents here. 🙂
@ TonyB (23:51:39) :
I guess what it comes down to is that I keep seeing various proxy data by various scientists yielding the same temperature reconstruction which shows that the climate now is warmer than in the past 2000 years and has done so at a relatively fast rate. In my eyes, there is a prepondernace of evidence for this position.
@ 3×2 (00:42:23) :
Your suggestion seems to be that SAT is showing just some tiny fraction of the “real” warming? And don’t warming Oceans hold less CO2 not more? Hmmm…. colour me confused.
Yes they do. That is why CO2 will increase into the future even with drastic emission controls.
@ Espen (01:31:58) :
yes, and the ocean heat content has been sinking for a while now
A few studies show that there may have been cooling or a flat trend since 2003 but more studies show that the oceans are gaining more heat. See the following site for a nice rundown on this topic:
http://www.skepticalscience.com/How-do-we-know-global-warming-is-still-happening.html
or is it just a natural recovery from the LIA?
Recovery from the LIA is not a forcing mechanism. Something has to warm up the planet just like a weak sun and volcanic eruptions likely cooled the planet during the LIA. What warmed up the climate since the LIA and did so at a rapid pace? It was not the sun, BTW.
Lucy,
Don’t you ever wonder why there are no peer-reviewed journals articles that can explain the warming of the modern climate while also showing why rapidly increasing GHGs have had little influence on recent climate change?
There are certainly plenty that show how CO2 is responsible.
What saddens me the most about posts here at WUWT is that folks here seem to believe one or more of the following so they choose to ignore the current state of climate science:
1) The majority of scientists around the world are incompetent (they do not interpret data correctly, for example), but folks here at WUWT can intepret the data better than these experts.
2) The majority of scientists around the world are afraid to publish alternate viewpoints to an AGW-forced climate despite the fact that they would become famous if they could refute AGW.
3) The majority of scientists around the world are conspiring in order to secure funding.
4) The majority of scientists around the world are just using group speak which implies that they do not think for themselves.
Instead, there are a small handful of scientists that do not fit any of the above points, rarely, if ever, publish their findings in a respected journal, and are the ones that most here are listening to.
Seems very foolish to me.
Scott Mandia,
The newest toy for the alarmist crowd is an alarmist blog that calls itself ‘skeptical’ science. There is nothing skeptical about it.
I’ve looked at it a couple of times. It’s simply a another alarmist blog with a mendacious name. It’s clear that the term “skeptic” tortures the scaremongers. They crave to be called scientific skeptics. But they fail to understand what a skeptical mind-set entails.
So they use the term dishonestly. They can not be skeptics, because they have bought into the whole bogus AGW scare hook, line and sinker. They don’t understand what scientific skepticism is. It is a questioning of any hypothesis until the hypothesis fails, or remains able to withstand all questioning. Alarmists can not prove their conjecture, and it certainly has not been able to withstand scrutiny.
Every good scientist is a skeptic. And skeptics are on the ascendant because the CO2=AGW conjecture not only fails to pass the scientific method, but the planet itself is falsifying the conjecture. If CO2 caused measurable global warming then where are the measurements? You can buy a pig in a poke, but the rest of us want to check out the pig before wasting our money.
The alarmists’ claim, which attempts to contradict the fact that the planet has not warmed despite steadily increasing CO2, doesn’t pass the skeptics’ requirement of testability. ARGO shows deep ocean cooling, so the alarmist crowd is naturally desperate to claim that 3,000 separate buoys are wrong, just like they claim that satellite data is inaccurate, but the surface station record is not. It is the alarmists who are wrong.
And it has been explained here that there is no clear division between feedbacks and forcings; they are only general definitions which overlap. You say that the planet’s natural recovery from the LIA is not a forcing. You think it is a feedback, which is ridiculous.
The entire alarmist belief in CO2=AGW comes down to the false assumption that a *very* minor trace gas, which is as harmless and beneficial as H2O, will cause runaway global warming if it increases from 4 parts in ten thousand to 5 parts in ten thousand. That is rubbish. There is no empirical evidence for that claim.
All the so-called ‘evidence’ for the CO2 conjecture comes from GCMs, which are notoriously inaccurate. Climate models are not evidence. They are simply a tool. Evidence is data. And the data shows that the alarmist crowd is wrong. At current low levels CO2 has no measurable effect on the climate. None. But I invite you to prove that wrong. Base your argument, if you even have one, on data, not on computer models or on the circular arguments of rent-seeking peer reviewed papers.
You can keep referring to a blog that wishes it were really skeptical. Alarmists are desperate enough to play word games like that, which tells us all we need to know about their lack of substance; the planet is falsifying the CO2 conjecture. Skeptics prefer to listen to what the Earth is saying, not to what alarmist propagandists want people to believe.
Finally, your claim in point #2 above shows how misunderstanding the scientific method leads you to false conclusions. Skeptics need refute nothing about AGW. Nor do they have to refute a conjecture that there is a methane monster living under my bed. As usual the scientific method is being turned around backward. What the alarmist contingent must show is that their AGW conjecture explains reality better than the long accepted theory of natural climate variability. Since it can not, alarmists demand that skeptics must disprove AGW.
Until climate alarmists understand how the scientific method works, they will continue to make the same error in believing that skeptics have any duty to prove or disprove AGW. Skeptics need prove nothing. It is the alarmists who must convincingly show that AGW has any validity. So far, they have failed to do so.
Scott Mandia: “Recovery from the LIA is not a forcing mechanism. Something has to warm up the planet just like a weak sun and volcanic eruptions likely cooled the planet during the LIA. What warmed up the climate since the LIA and did so at a rapid pace? It was not the sun, BTW.”
Well, except for the probably minuscule contribution from geothermal energy, and the actual heat release from human activity, nothing else than the sun can warm up the planet! The system of ocean currents, cloud cover and precipitation is vastly more complex than what it might seem that you suggest here. And in any case, given your simple observation of warming since LIA and “rapid pace”, how do you explain (I’m looking at the HADCRUT temperature graph now):
1) that the 1910-1940 warming was very similar in its rapid pace to the 1975-2005 warming?
2) the cooling from 1940 to 1975?
…and also:
3) the first part of the LIA recovery?
4) the onset of the medieval warm period?
@ Espen (06:40:44) :
1) Perhaps similar but 1975-2005 was a steeper slope and the past three decades have been warmer than almost all of the decades since 1850. The rate of warming is increasing each decade.
2) Global dimming due to pollution offset much of the global warming.
3) Not true, but I would refer you to hockey sticks and I do not think that works for you.
4) See #4 above.
I think I am done with this thread now because I just keep repeating myself so I am not really adding anything new.
Scott Mandia:
“The rate of warming is increasing each decade.”
Here, let me help:
‘The rate of warming
iswas increasing each decade.’Fixed.
I’m not going to dignify Finn with a response.
Scott Mandia (03:20:28) :
“I guess what it comes down to is that I keep seeing various proxy data by various scientists yielding the same temperature reconstruction which shows that the climate now is warmer than in the past 2000 years and has done so at a relatively fast rate. In my eyes, there is a prepondernace of evidence for this position.”
See the Wegman Report figure 5.8:
http://www.climateaudit.org/pdf/others/07142006_Wegman_Report.pdf
“A few studies show that there may have been cooling or a flat trend since 2003 but more studies show that the oceans are gaining more heat. See the following site for a nice rundown on this topic:
http://www.skepticalscience.com/How-do-we-know-global-warming-is-still-happening.html”
Huh? NODC data doesn’t show what you are talking about:
http://bobtisdale.blogspot.com/2009/10/update-of-nodc-levitus-et-al-2009-ohc.html
(Note how Bob tried to post this as a comment on Romm’s flag waving, bible thumping SS triumphalism-and the juvenile response)
So I guess your point is…that Ocean Heat Content data is crap, and therefore, what’s the point?
“Recovery from the LIA is not a forcing mechanism. Something has to warm up the planet just like a weak sun and volcanic eruptions likely cooled the planet during the LIA. What warmed up the climate since the LIA and did so at a rapid pace? It was not the sun, BTW.”
And you know it wasn’t the sun because….? And what does “rapid pace” mean anyway? And incidentally, this idea that the only factors in nature are the Sun and Volcanoes is rather tiresome. One has to be rather feeble minded to not understand that the climate can fluctuate all on it’s own. The MWP and LIA are likely examples of this (not “likely solar and volcano”). But if, as you say, they didn’t exist…
Scott A. Mandia (07:13:47) :
“Perhaps similar but 1975-2005 was a steeper slope and the past three decades have been warmer than almost all of the decades since 1850. The rate of warming is increasing each decade.”
This is really stupid and I would have hope you would not be so daft, Scott.
Using the HadCrut annual data:
http://i23.photobucket.com/albums/b370/gatemaster99/warmtwice.png
that 1911-1941 and 1978-2008, thirty one year periods with essentially identical rates of change. There is no basis what so ever for you claim of either “acceleration” or the claim that the first warming of the twentieth century occurred slower than the recent warming.
Add to that the lack of warming for twelve years now, and the claim of ever faster warming is really outrageous.
Andrew,
Let me start off by saying, YES, I WAS DUMB when I fell into the trap of arguing about trends and using single decade comparisons. You are correct and I am wrong when considering just pieces of the plot.
Of course, your plot shows an increasing trend since 1850 even with the cooling decades so there is an underlying trend upward that I do not believe natural causes can explain. I also think that global dimming caused the cooling before the 1980s or at least offset much of the warming.
You also mention the Wegman Report. That report addresses the 1998 temperature reconstruction. So? The 2008 Mann et al. and newer reconstructions show the same hockey stick even without using tree data. Also, the NAS report vindicated Mann 1998. I give more weight to NAS than Wegman but it is still a moot point with the newer data sets.
The NODC data is indeed interesting and I will need to look into this when considering the Schukmann et al. 2008 paper. However, a few years does not a climate make and the trends in those graphs are still upward over the entire period. Also, it appears that the past 6 months of data are skewing the “trend since 2003”. I guess we will need to see how the next year or so goes to see if this is a real downswing or temporary.
Also an interesting read from a comment on Tisdale’s blog:
Ocean Heat content:
Sea Level Budget over 2003–2008: A Reevaluation from GRACE Space Gravimetry, Satellite Altimetry and Argo by Cazenave et al. 2008
http://sciences.blogs.liberation.fr/home/files/Cazenave_et_al_GPC_2008.pdf
Summary: You are correct and I am wrong regarding my comments about rates of warming in selected 10 year and 30 year periods. I was daft as you say! 🙂
However, I do not see how you can claim: “Add to that the lack of warming for twelve years now…” How do you figure there has been a lack of warming in the past 12 years, and, does 12 years change the past 160 regarding trend?
Scott Mandia in reply to Andrew: “…does 12 years change the past 160 regarding trend?”
Scott, I think that after all it all boils down to whether one thinks the hockey stick is broken or not. Even if it should eventually turn out that global temperature data actually isn’t as bad as the article we’re commenting on will have it, and that Hadcrut data really tell a pretty good story, it still remains to be decided if the last 160 years represent something unusual or not. My take on this is that ice cores show that warming usually happens fast, while cooling takes a long time.
So, suppose that the hockey stick is broken and that those who claim that the MWP was at least as warm as the current warm period are right. Further, suppose that the LIA was a pretty unique event for the last couple of thousand years. Then maybe the current warming isn’t unusual at all – it’s just the sign of the planet’s oceans returning to their normal heat content after an unusually long cold spell. It’s the return to normal, to equilibrium. And it happens fast because warming does happen fast, while cooling takes a long time.
Andrew (07:38:18) :
I’m not going to dignify Finn with a response.
Why – have you checked the Lucia link and found out I’m right.
D’Aleo writes “Numerous peer review papers suggest an exaggeration of the warming by 30%, 50% or even more.” Those papers to back up my estimate that 30% of the apparent 0.8C global temperature increase over the past 150 years is due to Data Bias.
It appears the actual increase is between 0.5C and 0.6C, or perhaps even less.
Other estimates are that around 40% is due to Natural Cycles (of the Sun and ocean oscillations), 20% to Ocean Carbon (due to more carbon gas emissions and less absorbtion by the slightly warmer ocean surface) and only about 10% due to Human Carbon (burning of formerly sequested carbon).
Scott A. Mandia (11:41:16) :
“Of course, your plot shows an increasing trend since 1850 even with the cooling decades so there is an underlying trend upward that I do not believe natural causes can explain. I also think that global dimming caused the cooling before the 1980s or at least offset much of the warming.”
Blah blah blah blah blah….
“You also mention the Wegman Report. That report addresses the 1998 temperature reconstruction. So? The 2008 Mann et al. and newer reconstructions show the same hockey stick even without using tree data.”
You didn’t even read my comment!!! I told you LOOK AT FIGURE 5.8! Do you even know why I reference that specific figure?????
“Also, the NAS report vindicated Mann 1998. I give more weight to NAS than Wegman but it is still a moot point with the newer data sets.”
WRONG!
http://www.climateaudit.org/?p=2322
North UNDER OATH BEFORE A CONGRESSIONAL COMMITTEE, said that Mann’s method was WRONG.
The “newer data sets” are not independent of the older ones and resolve NOTHING.
More “blah blah blah”
“How do you figure there has been a lack of warming in the past 12 years, and, does 12 years change the past 160 regarding trend?”
Because it is, I don’t know, true?
http://masterresource.org/wp-content/uploads/2009/10/cherry-pick_fig2.JPG
And no, it doesn’t! For the last damn time, I’m not refuting the existence of twentieth century warming, I am refuting the claim of accelerating warming! How can you have twelve years of no warming and honest tell me that EVERY DECADE IS WARMING FASTER THAN THE LAST???
Finn, stuff it, your “right” in a pointless, stupid way, that means nothing. Drop this crap, because I won’t respond again.
Timetochooseagain:
I just realized that you are an 18-19 year old freshman college student. I am very impressed with your intelligence. I had always assumed I was speaking to a degree-holding scientists of some sort. Wow, I am being smacked down by somebody who could be sitting in my class. I wish all of my students could be this well-read, bright, and energetic.
I wish to retract my statement “The rate of warming is increasing each decade.” As I said before, I was wrong, dumb, and daft. I admit it.
However, the data shows the past three decades have been warmer than almost all of the decades since 1850 (and if one believes the hockey sticks – the past 2,000 years) and the underlying trend has been up, up, up. There is no “blah, blah, blah” there.
I also think Figure 5.8 of the Wegman Report does NOT disqualify the various proxy records.
Some advice for you now:
According to your blog, you calim to be libertarian/conservative. Don’t you wonder that your libertarian/conservative belief system is clouding your judgement? Those of your political persuasion do not like any type of regulation by the government or other organization of personal or societal activities. Certainly if there is AGW, there will have to be quite a bit of regulation. Isn’t it possible that this idea abhors you so much that you are trying to find a way out?
When you and I chatted about Zhang and the NAO/AGW influence on global precip, you were fairly courteous in your responses. Your latest posts to me and to Finn, although including valuable information, have a very derogatory and condescending tone. People will judge you on both what you say and HOW you say it. Be careful or you may lose credibility. I will chalk this up to you having a bad week and venting on me. No problem – we all do it occasionally.
You are bright but I still think those profesional researchers in the field who are strong supporters of AGW are at least a tiny bit smarter than you. One day you may put them all to shame but it is not today.
Good luck in your college career and always be sure to learn much but also to have much fun doing so.
“Certainly if there is AGW, there will have to be quite a bit of regulation.”
I disagree. It depends on the degree. And even then, there doesn’t have to be regulation, there are other mechanisms.
But let’s be clear on one point. I started out totally agnostic on the science. I’ll admit, I had my doubts but I would never claim to know what I am talking about. My first post on climate audit was to the effect that “I don’t know who is right, but isn’t it reasonable that maybe there can be a solution to the “problem” which is not as objectionable to [well, to us rightists]? After all, it seems plausible that there might be a problem, even if the big proponents are jerks like Gore.”
I was sixteen. And I don’t like to brag about my intelligence. But yes, I have been told I am really smart!
“Your latest posts to me and to Finn, although including valuable information, have a very derogatory and condescending tone.”
Let me be frank. I don’t like Finn’s tendency to be impenetrable and determined to “win” arguments in completely wrong ways-that is, by side stepping normal logic and the arguments themselves.
This got me irritated. And I’m a quarter Spaniard, so that’s…a little hazardous, to say the least. I feel I probably took out my frustration on you too much. Finn, I think, totally deserved it.
“I still think those profesional researchers in the field who are strong supporters of AGW are at least a tiny bit smarter than you.”
Here, I think, I must totally disagree. It’s not that I’m smarter or they’re smarter. I didn’t come to be of a strong opinion and high knowledge base through innate intelligence. I just think, and research, and to be honest, I rely a lot on people who know more than me. These include researchers who are “smarter” than I am, and who are not “strong supporters” of AGW. And I have read their papers in the literature and understand them, kind of. In my mind the whole picture is rather coherent. Of course, you have yet to correctly gauge my true opinion on the issue (hence some of my frustration). I suspect that you think that I think that 1. There is no such thing as Global Warming (I “believe” believe it or not) 2.That AGW is completely wrong (Heavens no! My view of AGW is probably far too nuanced for most of the WUWT readership).
So everyone is clear from now on:
I believe that the world has warmed in the last century if not longer than that. I also believe that some part of that is greenhouse warming. I even believe that the AGW influence is probably more important than the natural factors, if marginally, in causing the late twentieth century warming. But I do NOT believe in the AGW apocalypse.
timetochooseagain (14:53:32) :
Finn, stuff it, your “right” in a pointless, stupid way, that means nothing. Drop this crap, because I won’t respond again.
Scott Mandia (17:25:15) :
Timetochooseagain:
I just realized that you are an 18-19 year old freshman college student. I am very impressed with your intelligence.
18-19? That surprises me – I’d have said more like 8 or 9.
Andrew (11:22:26) :
E.M.Smith (10:29:21) :
The GISS corrections in Pisa would be ROW (ie not US) where they us a completely different UHI correction method that pretty clearly sucks. But I was refering specifically to the US.
GIStemp uses it’s own “UHI correction” and applies it to all the data, US and ROW. The Pisa example is valid as an example of the exact same thing that the exact same program does to the US data. (It is all merged by this step of GIStemp).
You also didn’t answer my question as to the seasonality of UHI or landuse effects, but rather commented on it having something to do with the GISS method.
Sorry, didn’t know I was obligated to answer all your questions for you.
But the winter warming I have seen occurs in many different data sets.
Because they use the same thermometers and suffer the same failings.
Airports are warmer in winter than their surroundings. We are increasingly putting thermometers at airports and more of those airports are in the tropics or southern hemisphere. Average that together and you get global “winter warming” because more thermometers are in places that are warm in winter. (And no, gridding, boxing, and anomalizing don’t make this go away, I’ve measured it all the way through GIStemp. It tries, and fails, to do the correction sufficiently).
For some reason folks love to assert that “Winter warming is to be expected” and then turn around and assert that the “gridding, boxing, and anomaly steps” will take care of any thermometer count issues. Somehow they don’t seem to notice that these two things are mutually exclusive. If the GB&A steps cured the thermometer count issues then both hemispheres would be equally weighted and there is no GLOBAL winter.
So for the globe to warm in N. Hemisphere winter is, on the face of it, evidence for a broken grid, box, and anomaly process and for the unequal distribution of thermometers to be ‘leaking through’ the process.
GISS unfortunately does not seem to have monthly anomalies for the US, so I can’t compare them with NOAA’s, which show a strong winter effect. I’m trying to figure out how real that might be, given the indications that the USHCN used by NOAA still has spurious warming in it (GISS warms considerably less).
You can download the data from NOAA (both GHCN and USHCN) and it has monthly data in it. What is done on the way to “anomalies” is anyones guess.
FWIW, the stations with the longest life span do not show warming in winter to any significant degree. Since it looks like you didn’t bother to follow the link I provided, here is the data. Notice that January (1st column) rises all the way from 1.8 to 1.0 degrees. Oh, Wait, that’s a drop… Maybe February will be better: 2.9 to 2.0. Oops. December? 2.7 to 1.7. This just isn’t working out for that Winter Warming Thing, now is it? November? 6.8 to 6.9! Yeah, hurray, a 0.1 C rise. Too bad it is well inside the error band…
So if you would like to use the link, here it is again:
http://chiefio.wordpress.com/2009/08/13/gistemp-quartiles-of-age-bolus-of-heat/
Now this is the “nearly raw” data before GIStemp manufactures it into anomalies, so don’t expect to find the politically corrected fluctuations in it. And this data is limited to the best longest lived records, so don’t expect to find the bolus of tropical thermometers at airports post WWII nor the burst of jet age airport warming at them. These are just well tended thermometers that have a life span of 103 minimum to 286 maximum years of being recored with the same “modification flag” (meaning, in the same way).
An Inquirer (14:33:27) :
Much has been observed and extensive analysis has taken place on land surface temperature records. However, the seas cover 70% of the earth. I would suggest that those who follow the AGW debate would be very interested in understanding how HadCru and GISS calculates ocean surface temperatures.
GIStemp does not have SST in it until STEP4_5 where it merges in the Hadley data. It does, in STEP3, fabricate SST “data” in the zones, grids, boxes process by taking LAND data and smearing it out over the ocean. (Up to 1200 km away…).
http://chiefio.wordpress.com/2009/09/08/gistemp-islands-in-the-sun/
And please do not say that GISS uses satellite data — that is a very misleading claim even though there is some truth in it.
I examine that misleading claim and find it wanting here:
http://chiefio.wordpress.com/2009/02/28/hansen-global-surface-air-temps-1995/
Scott Mandia (08:33:57) : Urban heat island effects are real but local, and have not biased the large-scale trends. A number of recent studies (see IPCC 2007 Chapter 3) indicate that effects of urbanization and land use change on the land-based temperature record are negligible (0.006ºC per decade) as far as hemispheric- and continental-scale averages are concerned because the very real but local effects are avoided or accounted for in the data sets used.
I’m sorry, but I’ve gone through the GIStemp code. Their UHI correction is seriously broken and in some cases has the sign backwards (i.e. makes the slope of warming greater rather than smaller as a “removal” of UHI).
The notion that the data are correctly adjusted for UHI is what’s broken.
Scott A. Mandia (13:31:03) :
1) All 4 data sets show a warming climate in the past three decades.
Gee, when the PDO was in a warming phase they recorded a warming phase. That’s fine, but has nothing to do with climate. 30 years is just 1/2 of the 60 ish year normal ocean cycle. Oh, and you get to deal with the 176-210 or so year solar cyclicality too. And don’t forget the 1500 year cycle that gives us Bond Events (a cycle that has been going on for hundreds of thousands of years, so don’t expect it to stop any time soon…)
If you are measuring with anything less than about a 3000 year baseline, you are simply riding cyclical ripples and fooling yourself.
http://chiefio.wordpress.com/2009/10/09/how-long-is-a-long-temperature-history/
2) They are fairly close in agreement with warming rates (one cannot just throw out RSS because they do not like the results).
The only problem with this is that GIStemp fudges their data by re-writing the older bit, prior to sats. So sure, the recent stuff can match, but they made the past colder to “find” global warming. Yes, I’ve read the code. Yes, it does this.
3) Joe suggests that there is a serious enough UHI bias that we cannot use this data for policy decisions.
He is right.
4) There is literature that shows UHI and no UHI but the data from point #1 doesn’t show UHI.
And there is literature telling me to prepare for the second coming too.
That the couple of decade trend matches AFTER the major growth of airports and urbanization is not very good evidence that the UHI effect is insignificant to the climate history. Oh, BTW, GIStemp uses airports as pristine rural reference stations to “correct” other stations. I’m sure all that asphalt and jet exhaust wouldn’t change a thing compared to grass and trees /sarcoff>
http://chiefio.wordpress.com/2009/08/23/gistemp-fixes-uhi-using-airports-as-rural/
And the transition of the jet age matters:
http://chiefio.wordpress.com/2009/08/26/agw-gistemp-measure-jet-age-airport-growth/
5) There is a plethora of actual observed effects of rapid climate change if we choose to ignore surface data. Shall we ignore
Sorry, but not in my experience. We’re having some cyclicality is all. It’s been warmer in the past, repeatedly, and it will be colder in the future. “The Ice Man” was only melted out from under his glacier recently. Guess what that means… It means the glacier was not there when he fell down and died. The alps were much warmer when Hanibal crossed with his elephants. Etc. All your “observed effects” are in the range of the normal cyclical variation of the planet.
Now that the PDO has flipped and the sun has quieted down, you will see more “observed effects of rapid climate change”, only it is toward colder and snowy. It’s a cycle. Learn to ride it.
E.M.Smith (06:14:29) : “GIStemp uses it’s own “UHI correction” and applies it to all the data, US and ROW.” This is not correct:
http://www.climateaudit.org/?p=4852
“Outside the US, the GISS meta-data on population and rural-ness is so screwed up and obsolete that their UHI “adjustment” is essentially random and its effectiveness in the ROW is very doubtful.”
Perhaps you would like to explain to Steve how he missed GISS throwing out the nightlight adjustment and now uses the same algorythm in the US and ROW?
“Sorry, didn’t know I was obligated to answer all your questions for you.”
You claim to have the “answer” to my question as to whether UHI effects winter versus summer significantly! But you didn’t answer it. I didn’t ask you, YOU STEPPED FORWARD with an “answer” to a question I hadn’t asked.
“Because they use the same thermometers and suffer the same failings.”
Right, the sattelite data suffers these problems to, presumably. And here I would refer you specifically to RSS because, although it has a spurious trend, it doesn’t have the seasonal problem UAH has right now.
“If the GB&A steps cured the thermometer count issues then both hemispheres would be equally weighted and there is no GLOBAL winter.”
This profoundly misunderstands the situation. If you look at the Northern Hemisphere independently, the NH winter warms more than summer. You are also wrong to assume that a perfect global average would have no seasonal effects. Again, look at the satellite data-even look at the daily non anomalized data, you will see that 1. the amplitude of the NH annual cycle is larger than the southern hemisphere and 2. the warming is generally greater in the NH, too.
Now why do you suppose that the global average has a NH winter effect? Because the hemispheres are not climatically symmetric! You falsely assume that they should show identical behavior, since they are just two halves of the globe. But the SH has more ocean, the NH more land, so that’ what causes it’s dominance.
Scott A. Mandia (05:34:08) : Don’t you ever wonder why there are no peer-reviewed journals articles
IMHO we are simply seeing the decline of the quality of the ‘peers’ in the peer review process. Peer review has always had the issue of “most folks think A, but the guy who shows A is false has trouble getting published”. The history of this is quite large. Plate techtonics comes to mind, there are plenty of others.
that can explain the warming of the modern climate while also showing why rapidly increasing GHGs have had little influence on recent climate change?
You require the proof of a negative. That doesn’t work…
What saddens me the most about posts here at WUWT is that folks here seem to believe one or more of the following so they choose to ignore the current state of climate science:
You left out “The majority of scientists believe the temperature data provided by Hadley and GISS and then go looking for something it would imply in their field; but the basic temperature series products are badly broken so their results are flawed”.
Hadley and GISS work closely together, read the same journals, have the same beliefs, and there will be similar thought processes and thus similar errors.
Basically, I only assume that about a dozen folks in two places are either wrong or crooked (and it might just be one or two leaders in each place) and that then breaks the temperature data. Everything else follows as a natural result.
And i can give strong assurance that GIStemp is broken. I’ve ported it to my computer, have it running, and have deconstructed most of the code. What it does is simply wrong. There isn’t any warming in the records once you pull GIStemp out of the way ( and it is helpful to adjust for thermometer count and location issues.)
3) The majority of scientists around the world are conspiring in order to secure funding.
Does not require a conspiracy. All it takes is “enlightened self interest”. I hear, as a hypothetical, that the Soros Foundation is handing out grant money to study Polar Bear response to global warming, I’m going to apply with a study based on the presumption of Gobal Warming. I’m not going to apply with a grant request that says “AGW is wrong and the thermometers are busted”. This happens all the time. (My spouse is writing a grant request as I type. It is in a different field, but the pattern is the same. They provide money for “foo”, so she is applying for “foo” money.
4) The majority of scientists around the world are just using group speak which implies that they do not think for themselves.
Close. Everyone suffers from “group think” and herd behaviour. It is well documented. If you travel much, you rapidly run into this. I once spent a few extra minutes stuck in a Japanese airport as the customs inspector enquired at length about what shoes I had brought with me. Puzzled, I later asked my travel companion what it was about. He had lived in Japan for years and explained that I was wearing Birkenstock sandals. What? Asked I. It seems that the inspector was worried that I would wear sandals in public as a business traveler. Sandals are for private in home use, not business. The inspector was relieved when I pointed to my hard business shoes in my luggage… So here we have a cultural norm (when to wear sandals) that is widely followed and ‘serious’ enough for the customs inspector to make it a bit of an “issue”. Yet in California you see sandals at work often. Different group, different group think. It is a fundamental part of being human.
Don’t believe me? Shave 1/2 of your head. The right side. See what happens for a week… especially in a business / office setting. Or cut one leg off of your trousers and see what happens. Cultural norms are so extraordinarily important that we often put people in prison for not indulging in the right “group think”. See the history of the inquisition, for example. More recently, the sodomy laws. Still on the books, drug laws and the war on drugs. Or just go to a nice Jewish Kosher deli and order a ham and cheese sandwich… And then ask your girl friend why fashion matters and can she just wear 5 year old designs. Or just dress up in Amish clothes and ask where the nearest bar is located… Just look at top hats and tails. Essential one decade, fading the next, ridiculous now.
We are, at our core, herd animals. It is very hard to go against that.
Instead, there are a small handful of scientists that do not fit any of the above points, rarely, if ever, publish their findings in a respected journal, and are the ones that most here are listening to.
It is not a small handfull of scientists. I have a whole shelf of books by folks with Ph.D after there name on the AGW is bunk side. And the refreshing thing about this site is that many of us here DO our own thinking and our own investigation. It is an active group. We don’t just sit, beaks open, waiting for a worm to be dropped in our gullet. It’s not about our belief system it is all about what the truth is.
The quest for truth is not mediated by a panel of peer reviewers.
Seems very foolish to me.
Only because of the way you choose to color things.
E.M.Smith (06:14:29) : “You can download the data from NOAA (both GHCN and USHCN) and it has monthly data in it. What is done on the way to “anomalies” is anyones guess.”
I guess I missed this one. I’m complaining that GISS has no monthly data for the whole US, so your response is totally useless.
timetochooseagain (07:46:58) :
E.M.Smith (06:14:29) : “GIStemp uses it’s own “UHI correction” and applies it to all the data, US and ROW.”
This is not correct:
OK, I read the link. I see no conflict between my statement and what Steve has posted. Oh, and you are quite wrong about my being ‘not correct’.
At the point were the “UHI Correction” is done, in the program PApars.f, the ROW and US data have already been merged into one single data set. It is run through PApars.f ‘en block’ and is subjected to the exact same lines of code. It does this after a rather ‘hokey’ un-adjusting step (in STEP0, IIRC) that does a somewhat cumbersome compare of the GHCN and USHCN data and uses a calculated “offset” to un-adjust some of the adjustments in some of the records. Details are in the code review on my site.
So you see, the exact same code is applied to both ROW and US stations. That is what I’m pointing out.
That the meta data is screwed up in ROW is quite true, no doubt about it. That much of it is screwed up in the USA is also true. For example, from:
http://chiefio.wordpress.com/2009/08/23/gistemp-fixes-uhi-using-airports-as-rural/
In follow on comments where some of us were inspecting what “pristine rural stations” has shown up in the GIStemp run logs, we have:
Now this is just silly. THE main airport on Kauai… My spouse and I flew into that airport on our honeymoon a couple of decades plus a few years ago. It was not exactly a small rural place.
5 425 91165000 LIHUE, KAUAI, 21.98 -159.35 45 86R -9MVxxCO 1A-9WARM FOR./FIELD C 21
http://hawaii.gov/lih
And in some ways, my favorite:
OOOhhh:
186 425 72405002 QUANTICO/MCAS 38.50 -77.30 4 22R -9FLxxno-9A-9WARM FOR./FIELD B1 10
Quantico! Marine Corps Air Station! Gotta Love It! Semper Fi!
http://www.globalsecurity.org/military/facility/mcb-quantico.htm
Calls it the “Crossroads of the Marine Corp” and says it’s 100 sq. miles on the Potomac.
Now maybe you want to argue that calling those two oceans of tarmac and jet exhaust “rural” and asserting that they have not had a UHI impact during the transition from grass fields to the jet age, but I would prefer to call it “messed up meta data”.
“Outside the US, the GISS meta-data on population and rural-ness is so screwed up and obsolete that their UHI “adjustment” is essentially random and its effectiveness in the ROW is very doubtful.”
And I agree with Steve’s statement completely. I would only add to it that the impact of airports as rural messes up the US record as well, only in a more orderly way, perhaps, due to more consistent airport growth profiles. This one, for example, will be growing nicely for years to come. Has an industrial park underway and the Air National Guard is moving in:
http://chiefio.wordpress.com/2009/09/04/most-used-rural-airport-for-uhi-adj/
Perhaps you would like to explain to Steve how he missed GISS throwing out the nightlight adjustment and now uses the same algorythm in the US and ROW?
Never said he missed anything. Just said that the ROW and US data are merged, and go through the same bit of code, and get the same UHI process applied, which is exactly what happens. The code is posted on my site and you can walk through it line by line if you like, as I have done.
I also said that the UHI is broken for both ROW and US (and in the same way) and it is. And I’d even go further and say that it is metadata related in both cases, with emphasis on “airports as rural” as a major issue.
“Sorry, didn’t know I was obligated to answer all your questions for you.”
Um, that was in response to “Andrew (11:22:26)”, not you, so I still don’t see why you are hot under the collar about it.
“Because they use the same thermometers and suffer the same failings.”
Your rant about satellites deleted. Look, the sats are just too short a time base to be significantly impacted by UHI growth. It takes time for cities to grow and airplanes to change from props to jets. To see UHI change over time, takes, well, time. So the sats look down on a world that has had a 30 year warming as a normal cyclical PDO thing and see normal. I’m fine with that. But to assert that somehow that says something about climate is a bad joke. To say it says anything about the 100 year long growth of urban centers in America around thermometers is even more of a joke. The UHI around, for example, Sacramento Metro Airport was pretty much a done-deal by 1970. New growth is out in Roseville.
“If the GB&A steps cured the thermometer count issues then both hemispheres would be equally weighted and there is no GLOBAL winter.”
This profoundly misunderstands the situation.
You got a problem with reading predicates? See that little word “if” followed by the Grid, Box and Anomaly abbreviation. That is a predicate. What I’m doing here is showing that the global set having a “winter warming” is not compatible with the assertion that GB&A “fixes it” (something that generally gets tossed up ever time this comes around). I’m showing a simple way to demonstrate that GB&A does not “fix it” (and in fact, it does not. I’ve been through that part of the code and due to all the islands, that step ends up warming the ocean grid boxes with airport tarmac. See the “islands in the sun” link).
But to your, orthogonal, point:
If you look at the Northern Hemisphere independently, the NH winter warms more than summer. You are also wrong to assume that a perfect global average would have no seasonal effects
Yup, a problem with predicates. And with logical deduction too.
OK, here we go. I’ll try to avoid reposting here all the stuff I’ve posted on my site (in the hopes of saving the moderators from reading it 100 times…) but will try to just put in enough for you to see what is happening. It would really be better, though, to follow the links.
Yes, the NH warms more in winter too. AND FOR THE SAME REASON. The thermometers migrate south. Not all the way to Brazil, just from Siberia to Italy in latitude. Now the GB&A folks assert this will be fixed by GB&A, but it doesn’t. GIStemp is just unable to correct for an order of magnitude change of thermometer records. The link is:
http://chiefio.wordpress.com/2009/08/17/thermometer-years-by-latitude-warm-globe/
You can see the thermometers migrate south in charts like this sample. This shows the percentage of thermometers in each latitude band by 20 degree bands. South on the left, north on the right:
An amusing sidebar: Notice that all of 1% of the thermometer records are in the southern 40 degrees of globe. It rises all the way to 5.5% at the 60 degree line, and you have to go all the way to “near the equator” to get to 11.2% of the thermometers. The whole Southern Hemisphere is seriously Missing In Action when it comes to thermometers, though it has roughly doubled it’s percentage over this time period as has the equator.
The 40 to 60 N band drops from about 65-69% ish down to 49-57% ish.
Notice we drop from about 20% of the thermometers in the 20-40 degree band to about 10%. Now look at the 6th column. It rises from 4% to 13%. Oh, and half of the 5th column will be “N.H.” too, and it rises from about 2% to 6.8%. Guess what happens as you move from Main to Florida (or Mexico), you get warmer winters. Thermometers notice this too.
And this is why that point about the GB&A code matters. Because the Warmers will want to insist that that code will “fix it”. But I’ve gone through that code, and it it does not. Not for the globe as a whole, and not for the Northern Hemisphere.
We move the thermometers southward, both for the N. Hemisphere and for the globe, and we find that ‘winters get warmer’. Golly, who knew…
And my apologies to the moderators for making you read all this, again; I really do wish folks could click a link and save both of us a lot of time…
E.M.Smith (10:18:42) : “Um, that was in response to “Andrew (11:22:26)”, not you, so I still don’t see why you are hot under the collar about it.”
Wow, you couldn’t even figure out that we are the same person? Really?
You missed the point about the satellites. Whatever.
Your point about migration of stations: can you also show stations move south within grids? Because it is NOT an effect of stations migrating south if it is seen in specific grids. You point seems to be that you think that the lack of data at higher latitudes later in the record is causing a spurious winter warming effect over the hemisphere as a whole. But I’m not talking about the hemisphere as a whole, I can show the same effect in individual bands!!!
Look:
http://data.giss.nasa.gov/cgi-bin/gistemp/do_nmap.py?year_last=2009&month_last=09&sat=4&sst=0&type=anoms&mean_gen=1106&year1=1979&year2=2008&base1=1951&base2=1980&radius=250&pol=reg
http://data.giss.nasa.gov/cgi-bin/gistemp/do_nmap.py?year_last=2009&month_last=09&sat=4&sst=0&type=anoms&mean_gen=0506&year1=1979&year2=2008&base1=1951&base2=1980&radius=250&pol=reg
NOTICE I didn’t use the 1200 km smoothing!!!!!
Andrew (09:46:40) :
E.M.Smith (06:14:29) : “You can download the data from NOAA (both GHCN and USHCN) and it has monthly data in it. What is done on the way to “anomalies” is anyones guess.”
I guess I missed this one. I’m complaining that GISS has no monthly data for the whole US, so your response is totally useless.
What you complain about is totally useless. Your evaluation of what someone says is what is totally useless. Have you any contribution beyond snark? If you would like monthly data, you can get it from GHCN. If you would like to use GIStemp, that’s your problem, not mine. And yes, the way GIStemp hides the truth of cooking the thermometer record by hiding the spike in winter temperatures in their odd “homgenizing” process is worth complaining about. (But not to me, I’m one of the folks tossing rocks at GIStemp.)
Andrew (12:16:58) :
E.M.Smith (10:18:42) : “Um, that was in response to “Andrew (11:22:26)”, not you, so I still don’t see why you are hot under the collar about it.”
Wow, you couldn’t even figure out that we are the same person? Really?
Now you expect me to keep track of all the pseudonyms you troll under? Really? Look, you want to hide under varying names that’s your problem, not mine, and I don’t need to “figure it out”. I have much more interesting things to work on than that.
You missed the point about the satellites. Whatever.
Didn’t miss it at all, was glad to ignore it as irrelevant.
Your point about migration of stations: can you also show stations move south within grids?
Yes. Though it doesn’t really matter. First step is STEP0 where data are fabricated out to 1000km if the USHCN / GHCN merger has an issue it wants to fill in. Pre-grids. Move a reference thermometer and you change the result. Could be 1000km away, might be just 10 km away, but move it to a warmer place, the “Reference Station Method” fill in will create a warmer data point.
Second step is STEP1 that does a homogenizing step with fill in out to 1000 km (that may be looking at a data point that was itself fabricated from 1000 km further away).
Third step is STEP2 that does a ZONE process. This uses 6 latitude bands for the whole globe (way too few) and some more fill and reach. It starts the ‘anomaly’ process and uses 1000 km (again, IIRC, the swapping from 1000 km to 1200 km is an amusing bit of cherry pick in the code but hard to keep straight). Now this may be using a data point that was fabricated based on a data point from 1000 km further away that was based on a data point another 1000 km away; so you could have a “data point” created from up to 3000 km away.
All if this is before the Grid and Box steps.
Now if you moved some thermometers further south, they can be still spreading their warmth up to 3000 km north. In the same box, grid, or whatever, or not. Makes no difference.
Forth step is STEP3. It does the grid, box et. al. step. But an interesting artifact here is that it reaches out to surrounding grid boxes and “fills in empty grids” based on another 1200 km reach. Ok, this is on top of the prior reaching, so a box with a temp from 3000 km away could create a box a further 1200 km away. That’s 4200 km.
No, I don’t think it happens “often” that the reach is that far. But there is no metric for just how much reaching is done. (It is “a lot”). I’m still working out benchmark code for this buggery.
And yes, empty boxes can (and frequently are) made up from nothing. Especially the empty oceans around islands. (See the “islands in the sun” link). Remember that at this point GIStemp is still “all land all the time”. The Hadley SST map gets blended in in STEP4_5 after GIStemp has fabricated temperature grid boxes for the empty seas around it’s island stations (that are nearly universally located at hot airports). So a single island airport patch of tarmac can warm a surface area of ocean about 1/2 the size of the U.S.A. lower 48 states. And yes, that happens. Log files are in the posting from a run of GIStemp. There are a lot of island airports in the worlds oceans…
Because it is NOT an effect of stations migrating south if it is seen in specific grids.
You really have never looked at the code and what it does, have you. You are stating a rampant belief as though it had first principle meaning.
The code has done so much data fabrication and smearing over distances before you ever get to the “box and grid” step that any change of thermometer location is already smeared all over the place. Heck, just the UHI “adjustment” in STEP2 reaches out to any distance up to 1000 km regardless of micro climate and smears the data around. So “Pisa” gets a backward UHI adjustment based on Hohenpeisenberg on the lower Alps in Germany. Put another thermometer in a hot place near or south of Pisa and it will “warm” Pisa in this step. Delete a cold one further north and it will “warm” Pisa. I can even show you what stations are used to “correct” Pisa from the convenient “cherry pick log” so you know exactly what thermometers to delete.
You point seems to be that you think that the lack of data at higher latitudes later in the record is causing a spurious winter warming effect over the hemisphere as a whole.
Well, at least you got that part straight. And It isn’t so much that I “think” it as that I’ve measured and demonstrated it.
But I’m not talking about the hemisphere as a whole, I can show the same effect in individual bands!!!
Great. Good for you. No surprise at all, though. You ought to be able to demonstrate it on a station by station basis from inspection of the STEP2 log files and the STEP3 log files and comparison of stations used over time in the v2.mean file. Haven’t done that bit of work yet, but it is very doable. (Had to save my cat from toxic commercial cat food and that sucked down a couple of weeks finding what was poisoning the cat. Yes, I have postings up on that too.)
It is all just a matter of how much work you want to put into the analysis to show the effect of thermometer change as a function of latitude (and potentially altitude too) on whatever scale you wish to observe. From the single station through boxes, grids, zonal bands, hemispheres, and the globe as a whole. All it takes is programming time.
Basically, we use a “composite thermometer instrument” to measure the globe; except the parts keep changing and moving around and a whole bunch got deleted. At the end of the day there is no way to properly calibrate ‘the instrument” and it has an essential bias based on the migration of thermometers to warmer places over time. A bias that can not be removed by the Anomaly, Zone, Grid, or Box steps.
http://chiefio.wordpress.com/2009/10/18/the-northern-hemisphere-what-warming/
http://chiefio.wordpress.com/2009/10/19/how-to-cook-a-temperature-history/
I’ve often wondered if other weather stations use the same (sloppy) method for calculating the daily average temperature as the one located near me. Several years ago, after becoming suspicious of the accuracy of their temperature reports, I emailed the Ithaca Climate Report folks at Cornell University in Ithaca, NY, and asked them how they calculated their daily average temperature. I was expecting that they sampled the temperature at least once every hour. Much to my surprise, in their reply they said that the daily average is the sum of the daily high plus the daily low divided by two! In addition, all reported temperatures (raw data) are rounded off to the nearest degree F. It is easy to realize that with only 2 daily data points, that on some days their calculated daily average can be in error by several degrees. Garbage in, Garbage Out. B.T.W., Ithaca, NY has many adherents to the church of Al Gore.
http://www.nrcc.cornell.edu/climate/ithaca/