WUWT readers may remember last year that we had an early outbreak of Tornado season, and media opportunist Senator John Kerry immediately jumped at the chance to blame the weather event on “global warming” as we reported here on WUWT:
Kerry appeared on MSNBC on February 6 to discuss storms that have killed at least 50 people throughout the Southeastern United States. So, of course, Kerry used the platform to advance global warming alarmism.
“[I] don’t want to sort of leap into the larger meaning of, you know, inappropriately, but on the other hand, the weather service has told us we are going to have more and more intense storms,” Kerry said. “And insurance companies are beginning to look at this issue and understand this is related to the intensity of storms that is related to the warming of the earth. And so it goes to global warming and larger issues that we’re not paying attention to. The fact is the hurricanes are more intensive, the storms are more intensive and the rainfall is more intense at certain places at certain times and the weather patterns have changed.”
See the original WUWT report here.
So, this year is a little bit different. We have a late and slow start to tornado season. Always a good thing. That being said, this report from Joe D’Aleo discusses why its been slow, and debunks a recent Weather Channel claim that the current deficit of tornadoes has something to do with “global warming”. Seeing how global warming causes both individual tornado events and decreased tornado events, I’ve apparently terribly underestimated its omnipotent power to influence weather. 😉

Graph from NWS/NOAA. Smaller (F1) tornadoes seem to be on the increase, but not larger ones.
Even though tornado reports seem to be on the rise, the larger damaging tornados, F2-F5 don’t seem to be. There are some good reasons for this, and it might be a good primer for readers to revisit this report I made about the issue of tornado reporting:
Increasing tornadoes or better information gathering?
BTW, if anyone wants a really cool weather radar program for tracking severe storms, please see my StormPredator program here – Anthony
Tornado Season So Far Not as Bad as 2008
By Joseph D’Aleo, CCM, on Intellicast
After another La Nina season with again a lot of snow and precipitation in the north central, another relatively active tornado season was expected and so far it has delivered on that promise. However given the La Nina was not as strong and the rebound in the Pacific towards El Nino is a month earlier than last year, the number of storms so far, have been less. It looks like May will fall well short of last May’s 461 tornadoes.

Cedar Hill, Texas, Photo credit Pat Skinner, TTU
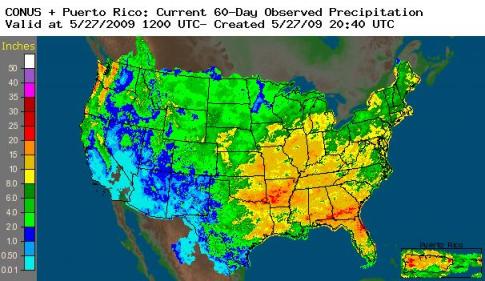
The annual summary to date can be found here. The tornadoes so far in 2009 have been in the southeast quadrant of the nation. Climatologically, that is where the season normally begins.

See larger image here.
In 2008, the tornadoes when all was said and done, were found in all but 4 of the lower 48 states.

See larger image here.
As we move into summer, expect the activity to shift north with the jet stream. The march of the season – climatology of tornadoes normally follows this depiction (source here).
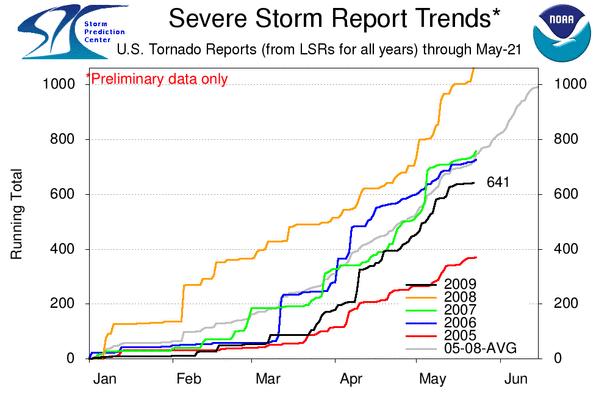
We are below the 5 year average for tornadoes for the season to date, below all but 2005.

See larger image here.
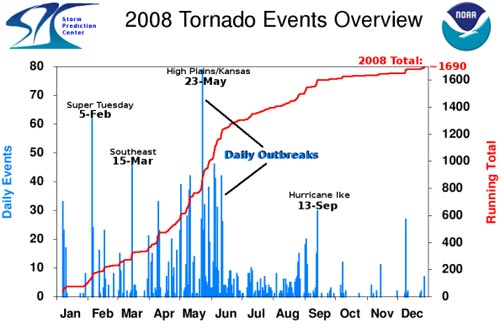
The activity was as usual concentrated in what is called tornado alley in the plains, Midwest to the Gulf. You can see in 2008 that the daily events peaked in May with the biggest day on the 23rd of May before falling off in summer as El Nino like conditions developed in the eastern Pacific. That is occurring a month earlier this year and perhaps, that explains the quieter May.

See larger image here.
The activity was as usual concentrated in what is called tornado alley in the plains, Midwest to the Gulf.

The reason that this region is most vulnerable is that this is where the combination of moisture from the Gulf of Mexico, dry air in mid levels from Mexico, a strong jet with cold air aloft coming out of the Rockies and a boundary between still cool air to the north and the warm humid summer like air in the south all come together. Read more and see some useful links here.
By the way, last year, the alarmist media blamed the increase in tornados on global warming. Well guess what this year, stormchasers across Tornado Alley have been frustrated this spring by what seems to be a lack of tornadoes and severe weather. Indeed, VORTEX2, the largest tornado field study ever, has been running for more than two weeks now and has not seen one twister. Last week, Weather Channel Senior Meteorologist Stu Ostro speculated that global warming was the cause. Of course this is the normal, mother nature has a perverse sense of humor – projects to study east coast storms had no east coast storms that winter, just one passing front. You just knew that VORTEX2 would lead to a lack of storms to study. We need them to schedule a massive study of hurricanes and we will surely have a dud season.
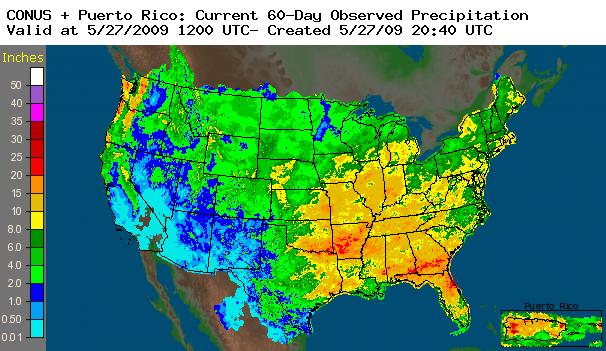
As to Stu’s reasoning, a big ridge would lead to heat and dryness across the central states. Instead the region has been hit hard with a steady stream of progressive troughs with heavy rainfall and very little warmth (fuel for storms). These storms brought more toirnadoes in April 2009 than in April 2008.
See larger image here.
The real issue may instead be that the El Nino like conditions that came in late May last year shutting off severe weather activity in June 2008 came on a month earlier this year and severe weather activity has diminished in May.
Eyeballing the first graph, it appears the increased incidence of stronger F2-F5 tornadoes coincides with the approximately 1950-1980 period of _global_cooling_!
I guess the alarmists are right, it is all about _climate_change_.
Wow!
More tornadoes=global warming .
Less tornadoes=global warming.
As someone who lives in tornado alley, I’ll take fewer. It’s not that long ago that a big one headed NE right up the Kansas Turnpike.
We had some rock-n-roll thunderstorms here in Kansas this year, there was a funnel cloud (no tornadoes) that went right over our neighborhood early on in the season and we had a springtime deluge and a derecho (severe wind storm).
The forecast right now looks to be dry, it was only in the 60’s all afternoon today because the sun was late in coming out, it’s supposed to be around 90 during the weekend before cooling down again though.
Also, one interesting observation I might point out is the stratosphere temps. on the UAH daily temps. website, there might end up being a major upset in the very cooling trend the IPCC and friends say is supposed to happen as a result of CO2 caused climate change which is the cooling trend in the stratosphere. However the mid-year stratosphere cooling has nearly stalled and is starting to be warmer up there than in recent years.
An interesting report. Nice to have all the charts and links. Thanks.
I’ve read the quote of John Kerry. I can’t claim to understand it but that is not new – I hardly ever understand him. What does this mean?:
“. . the larger meaning of, you know, inappropriately, …”
and this?:
“And so it goes to global warming and larger issues . . .”
In the first line – In fact, I don’t know the meaning. Except that something large is on his mind. What? The next line also includes “larger issues” that we are not paying attention to. Such as what? Isn’t global warming the largest issue confronting Earth according to Kerry and colleagues? He and Joe Biden would have made for an interesting administration.
I went to a weather observer training session here in Kansas a few weeks ago. Average annual number of tornados here is 55. Last year we had 185 according to the folks presenting.
To me it’s obviously better detection and reporting rather than actual increases in events. Same with Hurricanes.
This one just jumped off the page and bit me — “Seeing how global warming causes both individual tornado events…” — I’m assuming you meant to say “increased” rather than “individual”.
Speaking of storms. Here are
Atlantic Basin Hurricanes – Majors
http://nofreewind.com/atlantic_hurricanes.jpg
Atlantic Basinc ACE – Accumulated Cylcone Index – “energy”
http://nofreewind.com/atlantic_ace.jpg
Global Cyclone Index at rock bottom!
http://www.coaps.fsu.edu/~maue/tropical/global_running_ace.jpg
Sorry, this is OT. Wish there was another way to suggest OTs.
Secretary of Energy Steven Chu claims:
“If you look at all the buildings, and if you make the roofs white, and if you make the pavement more of a concrete type of color rather than a black type of color, if you do that uniformly, that would be the equivalent of . . . reducing the carbon emissions due to all the cars in the world by 11 years — just taking them off the road for 11 years,“
p.s. I don’t know if the claim is true or not. Is it?
The ultimate Weather Forecasting Excuse: Whatever happends today will be a result of Global Warming. If it’s freezing, it’s Global Warming Cold. If it’s like an oven out there, it’s Global Warming Heat.
Today’s High will be Global Warming Maximum, and the Low tonight will be Global Warming Minimum.
Tomorrow will be Global Warming Fair with a High between Global Warming 0 to 120, and a slight chance of Global Warming thunderstorms.
Have a nice Global Warming Thursday.
A note about the bar graph.
I noticed a couple of outstanding features.
First – from the mid-50’s to the mid-70’s the level of F2-F5 tornadoes was higher than in more recent years. Is it possible that in those higher years the measuring was less refined than now and what today would be more easily measured as an F1 might have been marked as an F2? It’s a thought.
Second – the increasing number of tornadoes might just represent the increasing sophistication of radar (esp. doppler rader) and that other new creature – the storm chaser. What was the coverage of rader & its sophistication in the 50’s & 60’s? And I bet there weren’t too many storm chasers around back then.
We need to keep all that data on file in context and remember that we’re seeing more things now that we might have missed 40 or 50 years ago.
The long term trend since 1850 suggests there has been an increase in hurricanes over the last 30 years but the level is still lower than at other times.
http://www.climatedata.info/Impacts/impacts.html
and click on “Tropical cyclones”.
So, this year is a little bit different. We have a late and slow start to tornado season.
Storm Chaser and meteorologist, Heidi Farrar over at TornadoVideos.net was saying a similar thing. They’ve had limited chasing oportunities so far this May.
I like to think ahead to what the next “alarm” might be.
I read elsewhere that the switch from La Nina to El Nino creates a shifting jet-stream which increases the (slight) possibility of tornadoes in the Northeast.
(Situations occur where a blast of hot and dry air comes over-the-top, as hot and humid air comes up-the-coast, and these two streams are met by a lobe of cold air back-dooring the northeast.)
Judging from the past, if there is any up-tick of tornadoes in the Northeast it will not matter that there are far fewer in the rest of the country. We will read about how the tracks of tornadoes have moved north, which is proof of Global Warming. We will read nothing about the F-4 Worchester Tornado which hit New England in 1953, which was the last time the AMO was like it is now.
Tornados larger than F-1 are very rare in New Hampshire, but we actually had one last summer, moving south to north. Should we have another this summer, the Alarmists will likely burst blood vessels.
Scott in Minnesota
You are right on about cooler weather affecting the the number of tornadoes but especially the f3 -f5 size or the larger and more severe ones . The period 1955 -1975 had the highest number of these more severe tornadoes and especially 1965 -1975, with 1974 being the worst with about 116 such severe tornadoes. This was a period[1964-1976] when PDO and AMO were both negative and cooler and there were more La Nina conditions . La Nina conditions are especially likely to produce more sever tornadoes like in 1974. We are in similar cool PDO or AMO levels like in the 1970’s but La Nina conditions only existed briefly in late 2007 to early 2008. If La Nina conditions return, the risk for more severe tornadoes also increases in my opinion as PDO and AMO are both negative and declining creating ideal conditions for more severe tornadoes.
matt v. If La Nina conditions return…
La Nina never went away, it’s here!, As I told before: She just went to the toilet to arrange herself and I see her now coming back..
OT:Where to find enough warmed waters for this NOAA forecast?:
NOAA Projects Near-Normal Atlantic Hurricane Season, Encourages Preparedness
If we were to believe in these yellows and reds:
http://www.osdpd.noaa.gov/PSB/EPS/SST/data/anomw.5.28.2009.gif
That go from 0.5 to 1.5 °C of anomaly, chances are that they should and must disappear and turn into blue during the SH winter(*), so…she (La Nina) just went to the toilette..
(*) if not receiving convenient orders from “above”
I know there’s been a push to associate periods of increased severe thunderstorms with La Ninas, but I think the jury is still out. If one can still find it, the old USAF TR200 written by the late Col RFC Miller and Major Fawbush formally classified the major synoptic patterns over North America that lead to major severe thunderstorm activty. Dr Charles Doswell’s classic texts on Mesoscale meterology goes even deeper. As far as I know Dr Doswell is now retired. I don’t know if any further research has been done which can coorelate borad synoptic weather patterns that lead to severe weather outbreaks with any kind of climate analogues. It would be a very interesting subject if not an exhausting one.
JP
The correlation between La Nina’s and the severest tornadoes[ f3-f5] is a little more apparent if you look at these two web pages together especially during 1970-1976
http://www.ncdc.noaa.gov/img/climate/research/2008/ann/ann-F3-F5tornadoes08.png
http://www.cpc.ncep.noaa.gov/products/analysis_monitoring/ensostuff/ensoyears.shtml
Adolfo Giurfa
This may be of interest to you.
http://www.bom.gov.au/climate/enso/
There is also a correlation between the simulatanous occurence of both negative PDO and negative AMO[ like today] and the severest tornadoes[ f3-f5] . The period 1964-1976 clearly shows this when both AMO and PDO were both negative and at extremely low values . The AMO index for 1974[ the record year for severe [f3-f5] tornadoes was the lowest ever on an annual basis[-0.405] and on monthly basis hit [-0.495 ]which is the second lowest ever next to [-0.563] during 1913. The PDO went down to [-1.29] on an annual basis.Currently AMO is at[- 0.078] and the PDO is [-1.65] on a monthly basis
It would appear that if AMO/ PDO both continue to decline and stay negative , the risk for severe tornadoes will also increase [ like it seemed to do during 1950-1976] . The threat seemed to diminish after 1976 when both indices went positive and the number of severe tornadoes seemed to decline . See the graph below [also repeated on above post]
http://www.ncdc.noaa.gov/img/climate/research/2008/ann/ann-F3-F5tornadoes08.png
Slightly off topic, but any of the moderators read the report described in:
http://www.telegraph.co.uk/earth/environment/climatechange/5406487/Climate-change-kills-300000-every-year.html
I suspect it’s yet another ‘this is the message we want, now lets fit the figures to justify it’, but I don’t know.
Has anyone read it/critiqued it/picked holes in the arguments?