From ICECAP
By Joseph D’Aleo CCM, AMS Fellow
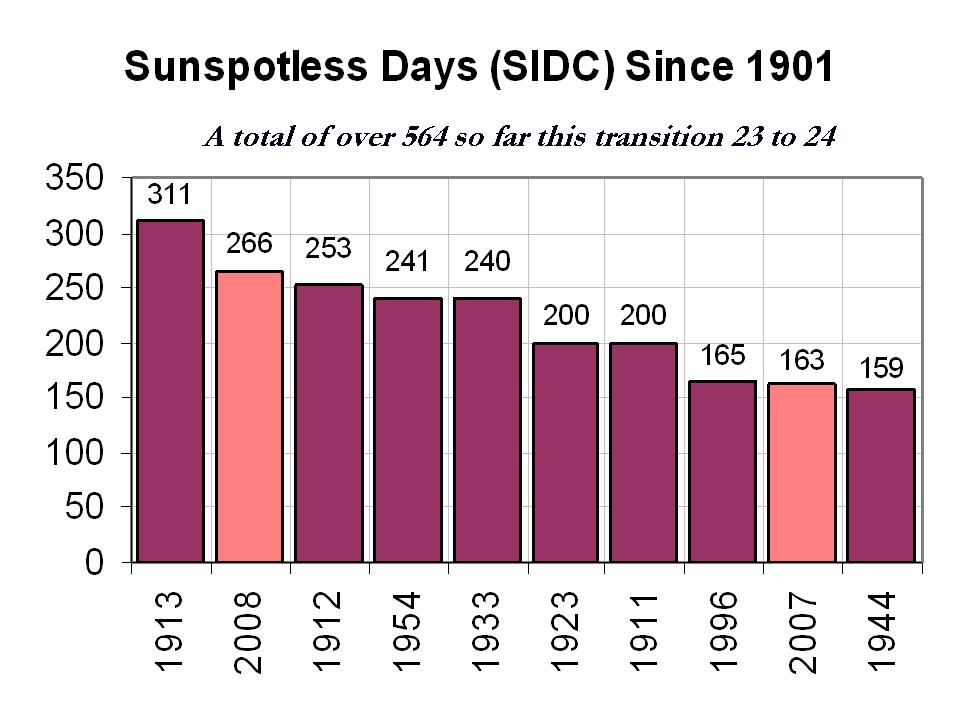
2008 will be coming to a close with yet another spotless days according to the latest solar image.

This will bring the total number of sunspotless days this month to 28 and for the year to 266, clearly enough to make 2008, the second least active solar year since 1900.

See larger image here.
The total number of spotless days this spolar minimum is now at around 510 days since the last maximum. The earliest the minimum of the sunspot cycles can be is July 2008, which would make the cycle length 12 years 3 months, longest since cycle 9 in 1848. If the sun stays quiet for a few more months we will rival the early 1800s, the Dalton Minimum which fits with the 213 year cycle which begin with the solar minimum in the late 1790s.

See larger image here.
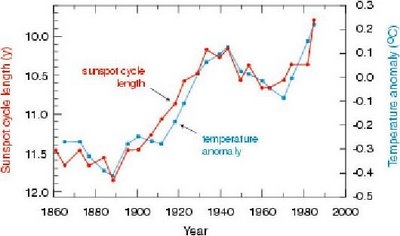
Long cycles are cold and short ones like the ones in the 1980s and 1990s are warm as this analysis by Friis-Christensen in 1991 showed clearly.

See larger image here.
In reply to the arguments made that the temperatures after 1990 no longer agreed with solar length, I point out that it was around 1990 when a major global station dropout (many rural) began which led to an exaggeration of the warming in the global temperature data bases. Also the length from max to max of 21 to 22 was 9.7 years and cycle 22 length min to min 9.8 years, both very short suggesting warm temperatures in the 1990s. The interval of cycle 22 max to cycle 23 max centered in the mid 1990s began to increase at 10.7 years and the min to min length of cycle 23 is now at least 12.3 years.
With the Wigley suggested lag of sun to temperatures of 5 years and Landscheidt suggested 8 years, a leveling of should have been favored around 2000-2003 and cooling should be showing up now. Looking ahead, put that together with the flip of the PDO in the Pacific to cold and you have alarming signals that this cooling of the last 7 years will continue and accelerate.
Please ignore this article and continue investing money in Al Gore’s green fund and paying him huge speaking fees. We need the money to pay for our huge electric bills.
Thanks – Tipper
That can’t be right, because the British Met Office says we’re in for warming, and they’re always right. Yes, that is sarcasm – and thoroughly deserved sarcasm at that. Hope you’re reading, Met Office! I know a lot of people won’t agree with me, but I actually really hope that we’re in for cooling. Because I just want to see so many people being shown up as complete idiots. There was a time when I hoped my warming scepticism was wrong, as no one could wish for a colder climate. But I’ve had enough of the Warmists, and I’ve had enough of the leftist green movement too. Here’s hoping for a freeze! [my apologies to all those who still hope they’re wrong – and a happy new year].
Steve
I’m pretty sure that 2008 is the most spotless year since 1900 by far. Did we have the instruments we have now to monitor the sun back in 1913? Was there the same interest in counting the spots in 1913 that exists now? No on both. Back then only a few astronomers and some amateurs would do that. Now everybody seems to be doing it. Why, some people would count bad pixels as spots if the could get away with it.
and what does the Sun have to do with heating the Earth?
Drudge links this story to a Investors Business Daily editorial: The Warm Turns
“this cooling of the last 7 years will continue and accelerate.”
No need to worry, John Philip notes in the Pielke thread that 7 years is just weather so warming will continue as unabated as it has.
Can someone point me to a good paper (good = readable by a layman + plausibly true) on the dynamics of solar cycles, and what might contribute to it’s cyclical behavior? It will make interesting reading while I freeze my tucas off here in Saskatchewan.
Maybe we’ll get low solar activity also next year, and SC24 ramps up at late 2009 or 2010. This diagram was published in the solarcycle24.com forum:
http://farm4.static.flickr.com/3213/3146817105_af25c0ca5f_o.jpg
(The important difference between this cycle and the one ending 1913 is that SC23 is the longest since late 18th century, before the Dalton Minimum, or?)
—
BTW, and offtopic: An snapshot of the current status on the AGW side, which is best analyzed with a couple of glasses of champagne.
Thanks Magnus. A great laugh to round off 2008. No-one did it better than Monty Python, Peter Cook, Rowan Atkinson et al. Where are the comedians today to take the p**s out of AGW like they did? Any volunteers?
It’s actually pretty scary. I really don’t want to see a little ice age in my lifetime and it’s starting to look more possible. We’re all going to be hoping the AGW guys are right.
On another topic I just did a post on the practicality of algae biodiesel, if you’re interesed.
http://noconsensus.wordpress.com/2008/12/31/what-about-algae-biofuel-hype/
I suggest you replace the erroneous graph by Friis-Christensen (1991) by the corrected one, the original contains some ‘convenient’ arithmetic errors!
The corrected graph doesn’t have the the impressive agreement since 1980, quite the contrary.
http://stephenschneider.stanford.edu/Publications/PDF_Papers/DamonLaut2004.pdf
From the Sun to the Earth. This is OT a bit, and not related to sunspots (as far as I have ever heard), but I thought that this was interesting. What it portends I cannot say. I’d like to say it’s unsettling too, but it may not even be that big of a deal. Looks like we may have a movement of magma in some shape given the cluster of quakes, but it might also be steam driven. I haven’t done much looking into it since I am on my way to work soon, but I thought I would post it for others to investigate. The strongest of the temblors looks like a 4 on the scales. Anyway, take a look for yourselves.
The Druge Report headline says: Earthquake swarm continues beneath Yellowstone…
Here is the Link: http://www.seis.utah.edu/req2webdir/recenteqs/Maps/Yellowstone.html
Steve Berry wrote:
“There was a time when I hoped my warming scepticism was wrong, as no one could wish for a colder climate. But I’ve had enough of the Warmists, and I’ve had enough of the leftist green movement too. Here’s hoping for a freeze!”
I agree with you Steve. I don’t want AGW to be proved “true”, whether it is or not, as I don’t want to have our economy ruined (more than it is now) by activists who know not, what they will have wrought. But, on the other hand, I don’t want to live through a drastic, or “Little Ice Age” type global cooling scenario.
Either way, human beings will be harmed.
Nothing like a good old Dalton or Maunder Minimum to gag forever the likes of Hansen, Gore, Mann and company. The hubris of these so called scientists (Gore, excepted) is breath taking. They should all be crawling under rocks and never be heard from again.
Looking at the 10 most sunspotless days that were noted in the post above and using CRUTEM 3 annual global surface temperatures I note that 6 of the 10 years mentioned were colder than the previous year, 4 were warmer.
O f the 4 that were warmer, strong El Ninos from 1911 to 1912 and moderate El Nino of 1913 -1914 seem to over-ride the apparent cooling of the higher sunspotless days of the years 1913 and 1912. The year 1944 was neutral but still warmer than 1943. Perhaps the lower number of spotless days[159 and the lowest of the 10 years noted] may be insufficient to cause cooling. The year 2007 was a mix of La Ninas and neutral and the warming was very slight from 0.654 to 0 .679 C [ year 2006 to 2007]
It would appear that the oscillations of both the sun and earth together need to be considered unless there are sustained number of consecutives years with low sunspot years like the Dalton, Maunder and Sporer minimum periods
The year 2008 [ mostly ENSO neutral] is good case to illustrate that for significantly more spotless days, the lower the global surface temperature is lower[ like 1933]
Phil,
While the original may contain errors, I really don’t have the experience with this yet, the link you reference uses temp curves from Mann98 as well as references to papers by Mann 99.
It is hard for me to trust anything by that guy or his group. A scientist who would reference it as recently as 2004 is in question to me as well. Are there cleaner articles available?
Phil:
I wonder if there are any graphs comparing suns cycle length and “global temperature” (whatever that is) that go past the year 2000? I always find it suspicious when I am being presented with a graph that proves a point one way or another when it conspicuously omits current or recent data.
The PDF you linked to goes on a length about the arithmetic errors in the previously presented graph, but doesn’t say what the error was other than the data used was improperly “filtered”. I’m confused on this point – the length of a cycle seems like a pretty straightforward thing to measure – and the corrections have the cycle lengths reduced dramatically in favour of their “no correlation” stance (disregarding the striking correlation in the other 80% of the graph). But these cycle lengths have been reduced why, and by what means?
The article then goes on to discuss political and sociological implications of the “incorrect” graph rather than merely discuss the matter in a purely scientific / mathematical manner. Sorry, but for me, this paper (already 4 years old) doesn’t pass the sniff test. Also, what was the response from Friis-Christensen to this questioning of their methodology and conclusions? Have there been any more recent papers or graphs from either side to prove or disprove correlation?
This is an incomplete picture, for me.
Phil. the paper you link too looks pretty dramatic except for the fact the data ends in early 2001 or 2002.
I think Friis-Christensen are redeemed by the recent cooling.
Thanks Magnus:
“Not quite the conflagration we’d been banking on”. Ha ha ha.
It’s not just the PDO. The AMO looks to have achieved maximum and is now starting to decline. The AMO decline/negative PDO look to be about in the same alignment as they were around 1950. The difference between that period and now is that 1950 was the last hurrah of lower solar activity and while AMO/PDO plunged in the following periods, solar activity increased. Right now, as AMO/PDO plunge, we look to be in the early stages of lwoer solar activity.
I addressed these observations in a post on my site:
http://digitaldiatribes.wordpress.com/2008/12/23/a-look-at-the-atlantic-multidecadal-oscillation-amo-index/
Personally, I want global warming back, I’m getting too old for prolonged cold, much as I’d like to see Hansen et al with egg on their faces.
DaveE.
Mr. Hastings-Trew — The website http://www.co2science.org has a subject index that includes papers on solar-terrestrial effects. Some of the papers have a short abstract (‘what it means’) by the Idso team of climate scientists here in Arizona.
The Idso site deserves more mention here; it is very good on biological topics such as growth stimulation by CO2, which they study. Planktonic dimethylsulfide production may be a strong negative feedback, for example, and means that biologic factors can be a major factor in world temperature.
Right now, the CO2 science site home page has a submission to the EPA which gives the skeptical case on that matter.
Re:Steven Hill (09:55:46) :
This should be interesting, Gore and Hansen will look like morons.
Eventually perhaps, but not in the near-term. We have to keep in mind that the AGW hysteria has never been about climate or science in the first place, but about foisting a new social agenda upon America. The Hansens and the Gores see themselves as so close to the brass ring now that they won’t allow a silly thing like reality to stand in their way. Any cooling in the short-term will simply be brushed off as noise in the overall warming signal. Take a look at the GISS global temperature trend graphs. It will take many years of deep cooling before a trend line, no matter how it is averaged or smoothed, can no longer maintain a positive aspect. Unfortunately, I think we will be suffering the AGW fools for many years to come.
Solar irradiance also correlates well with sunspots: click
Notice that global warming and increased solar irradiance both ramped up beginning in the early 1900’s, when even rich countries were still mostly agrarian and therefore produced very little carbon dioxide compared with current levels. Today, CO2 continues to rise — but now the planet is beginning to cool.
It is clear that CO2 is [if at all] a very minor player in climate dynamics. But if the warm mongers continue to insist that “carbon” [meaning CO2] is the primary culprit, then the obvious way to counter global cooling is by encouraging the use of fossil fuels.
The fact that this straightforward solution to planetary cooling is never mentioned is more evidence that the AGW hypothesis is based on a political agenda, not on objective science.
Phil. (11:08:02) : [provided a link to Stephen Schneider’s home page at Stanford]The corrected graph doesn’t have the the impressive agreement since 1980, quite the contrary.
I wonder, is this the same Stephen Schneider who said in Discover magazine, OCT 1989:
???
If he is, I wonder, why should he be trusted? Interestingly, the PDF paper at the link has a section entitled “Public Impact of Misleading Information”.
“what was the response from Friis-Christensen to this questioning of their methodology and conclusions?”
One at least from 2004:
http://www.spacecenter.dk/research/sun-climate/Scientific%20work%20and%20publications/comment%20to%20EOS_28_Sept_04.pdf
DAV:
The name Stephen Schneider sounded familiar. Thanks for jogging my memory with that memorable quote.
Is it the same Steven Schneider, Phil.?
James Hastings-Trew (11:40:06) :
Phil:
I wonder if there are any graphs comparing suns cycle length and “global temperature” (whatever that is) that go past the year 2000? I always find it suspicious when I am being presented with a graph that proves a point one way or another when it conspicuously omits current or recent data.
It’s difficult to write a paper in 2004 including data for the cycle length of the current cycle which had not yet ended!
Jeff Id (11:39:10) :
Phil,
While the original may contain errors, I really don’t have the experience with this yet, the link you reference uses temp curves from Mann98 as well as references to papers by Mann 99.
Which has nothing to do with the point in question, that the graph shown by D’Aleo from 91 had already been corrected by the authors in 95 and even that graph still had errors. I’m sure that Leif could supply a correct curve?
Phil:
I can’t remember the last time I read such a biased and politicised article as that you link to. What the hell is a filtered cycle length?
Question:
Is there a lag between Solar Irradience/spotless days/ other factors and the mean temperature on earth?
Or, to restate the question: Does it take several years or months for the earth to lose the energy that is stored in heat sinks, and once that energy is depleted, would lower mean temperature result because of lower irradience and sunspots?
I am trying to phrase the question well enough for others understand my question, but I feel I may not be successful.
thanks
Mark my words, Al and his buddies will explain this cooling due to the economic slowdown ( ie. factories producing less CO 2 etc. ) in the world over the last couple of months and actually this slowdown started around the beginning of 2007. Thus AGW is alive and well still. Yes , idiots will believe him or should I say the mainstream media.
Brent in Calgary
Dav,
It’s hilarious that Schneider defended what he said by claiming that *all* scientists face the same “dilemma”, or in his words, a “bind”, and morphed his original statement of “need” to “forced to do media clips”. While at the same time being “unusually forthright”, no less:
http://stephenschneider.stanford.edu/Publications/PDF_Papers/DetroitNews.pdf
“On the one hand, as scientists we are ethically bound to the scientific method, in effect promising to tell the truth, the whole truth, and nothing but – which means that we must include all doubts, the caveats,
the ifs, ands and buts. On the other hand, we are not just scientists but human beings as well. And like most people we’d like to see the world a better place, which in this context translates into our working to
reduce the risk of potentially disastrous climate change. To do that we need to get some broad based support, to capture the public’s imagination. That, of course, means getting loads of media coverage. So we have to offer up scary scenarios, make simplified, dramatic statements, and make little mention of any doubts we might have. This “double ethical bind” we frequently find ourselves in cannot be solved by any formula. Each of us has to decide what the right balance is between being effective and being honest. Ihope that means being both.”
“It is strange that The News should accuse me of trying to hide scientific uncertainty through this quote, when by the very nature of explaining the dilemma I am being unusually forthright in trying to show how
all scientists face a bind when forced to communicate in short sound bites in the media what the essence of a controversial complex problem is.”
I’d like to hear Leif’s comments on this paper…
The best part of all of this is the sun is cooperating on testing solar cycle hypothesis. We have an anomalously long cycle which should lead to cooling according to the hypothesis (potentially quantifiable – Hathway I believe is calling for a 2.1 deg C decrease, if I recall correctly). We need testable hypotheses to move climate science ahead. Of course, those with purely political agendas will never acknowledge this, but the public will recognize what’s going on (via observable changes in the weather) & those with purely scientific agendas will be shown to the credible sources of information.
“It’s so cold that Al Gore is burning tires to keep warm”
~Larry The Cable Guy
http://www.cookevilleweatherguy.com
The plot of solar cycle length versus temperature from
Length of the Solar Cycle: An Indicator of Solar Activity Closely Associated with Climate
E. FRIIS-CHRISTENSEN 1 and K. LASSEN 1
is very interesting.
However, how does this correlation plot look up to 2008 inclusive? Is it available?
Logan, Glenn,
Thank you.
Man I love this site. 🙂
Glenn (12:38:09) : *all* scientists face the same “dilemma”, or in his words, a “bind” … While at the same time being “unusually forthright”, no less:
Ah, yes! The old “Honestly, I’m a liar!” trick! The only “bind” is determining when he is and when he is not.
Hastings-Trew
You might read up on Cosmoclimatology developed by Henrik Svensmark.
Roughly, Svensmark’s thesis is that sunspots modulate the earth’s magnetic field which affects the cosmic rays that get through, which change the nucleation rate of clouds which affects the Total Solar Irradiance that is reflected vs absorbed.
Intro:
A brief summary of cosmoclimatology Danish National Space Center
Detailed paper:
‘Cosmoclimatology: a new theory emerges’, Henrik Svensmark, Astronomy & Geophysics, Vol. 48, Issue 1, pages 1.18-1.24, February 2007
Phil,
You said
“Which has nothing to do with the point in question,”
You are right, but if these people who found the math error can’t see the simple rubbish in Mann how can I trust them. BTW, I don’t disagree with your link as I don’t know the data. I just was hoping for a better source.
Diatribe guy
You have great web page. You have obviously done a lot of excellent research.
I found the ENSO INEX also useful http://www.cpc.ncep.noaa.gov/products/analysis_monitoring/ensostuff/ensoyears.shtml
You will note that 18 of the last 33 years had an El Nino of at least 2 months or more . 15 had an El nino of 3 months or more . Record temperatures can clearly be seen with prominent El Ninos and cooling during La Ninas.
Glad to be reminded of that quote from Schneider. Lovely!
Have we got any logicians around the place that can deconstruct that for us? If I read it right: We are scientists and therefore we have to be honest and include all the doubts in what we publish but even if we have doubts global warming is so important that we don’t need to include them on this subject.
But if you have doubts surely there is a possibility that global warming is less important than you are trying to claim and therefore you ought to include your doubts in the published literature.
Or am I being naive, here?
Phil
When citing critics, recommend that you also include the reply of those criticized. Following up on Glen’s post, see:
Comments on the Forum article : ”Patterns of Strange Errors Plagues Solar Activity an Terrestrial Climate Data, by P. E. Damon and P. Laut E. Friis-Christensen and Henrik Svensmark
Danish Space Research Institute, Juliane Maries Vej 30, DK-2100 Copenhagen Ø, Denmark
Comments on Peter Laut’s paper: Solar Activity and terrestrial climate: an analysis of some purported correlations, Journal of Atmospheric and Solar-Terrestrial Physics 65 (2003) 801-812
Phil: “It’s difficult to write a paper in 2004 including data for the cycle length of the current cycle which had not yet ended!”
What *data* did they include of the then current cycle? Explain this statement of yours. Did you read the original? Do you consider the results of techniques such as “filtering”, “smoothing”, “adjusting” as “data”?
http://www.friendsofscience.org/assets/files/documents/Solar%20Cycle%20-%20Friis-Chr_Lassen-.pdf
This is a NASA meeting from earlier this month. What amazes me in this is that Hathaway’s TSI number is a change from max to min of 2W/m2(page 5). And if you look at the overall trend in sun spotpage 25) number it trends are very similar (overall) to GISS trends from 1880, if you look since the MM it fits proxy trends well too. I am not saying that it matches GISS bump for bump just the trend. Then match this trend to CO2 and again it is close but CO2 lags. I think what we see is that the oceans act like a battery and charge up over time from the sun, after all the sun is the input of energy into the system and the argument is how much it varies. Then release the energy into the system as climate. Oscillation will occur and you get the PDO and AMO, while simplistic it does make you think. Many parts of the atmosphere are related and there has been an observed link between the ionosphere and the troposphere, the upper troposphere and lower stratosphere. The sun does effect the upper to layers and varies with the solar cycle.
NASA Meeting
http://sprg.ssl.berkeley.edu/RHESSI/napa2008/talks/MonI_Hathaway.pdf
Ionosphere
http://www-star.stanford.edu/~vlf/palmer/palmer.htm
http://www.pnas.org/content/94/20/10512.full
http://www.berkeley.edu/news/media/releases/2006/09/14_weather.shtml
Further to Friis-Christensen 1991 paper see:
The cause-and-effect relationship of solar cycle length and the Northern Hemisphere air surface temperature
The cause-and-effect relationship of solar cycle length and the Northern Hemisphere air surface temperature Richard Reichel, Peter Thejll, Knud Lassen
apparently the Church of England has invested 250 million quid in the AGW Al Gore rhythm, Is Al Bore the next Benny Madoff?
For variety, here is a 2007 paper claiming the opposite:
Recent oppositely directed trends in solar climate forcings and the global mean surface air temperature
MIKE LOCKWOOD, CLAUS FROHLICH
However, they make no mention of the Pacific Decadal Oscillations etc. which may invalidate their conclusions.
‘And like most people we’d like to see the world a better place…’
So did Lenin.
Getting back to the C of E, a once noble institution which is now on its deathbed–death by anemia– if they sign on to something, it’s the Titanic redivivue.
Magnus!
Thank you for the Youtube video!
The context you established for it has me smiling broadly.
Happy New Year all!
Stay cozy chicks :0)
David Archibald has plots from specific regions/stations that show a correlation of sunspot cycle length and temperature
http://www.warwickhughes.com/agri/Solar_Arch_NY_Mar2_08.pdf
figs 4 and 5
I had not seen a global temperature chart before the figure above..
A bit of poetry from the Dalton Minimum:
ST. AGNES’ Eve—Ah, bitter chill it was!
The owl, for all his feathers, was a-cold;
The hare limp’d trembling through the frozen grass,
And silent was the flock in woolly fold:
Numb were the Beadsman’s fingers, while he told 5
His rosary, and while his frosted breath,
Like pious incense from a censer old,
Seem’d taking flight for heaven, without a death,
Past the sweet Virgin’s picture, while his prayer he saith.
–John Keats
Jeff L (12:40:29) :
(potentially quantifiable – Hathway I believe is calling for a 2.1 deg C decrease, if I recall correctly)
… wait – that was Archibald, not Hathaway ( I didn’t recal correctly) :
See link at Icecap:
http://icecap.us/images/uploads/fyingtheUSAgriculturalProductivityResponsetoSolarCycle24.doc
‘It will make interesting reading while I freeze my tucas off here in Saskatchewan.’
Where in Saskatchewan did you acquire that glorious NewYork Yiddishism?
How sad! Catching the typo just as the message has been irrevocably launched into cyberspace!
Reply: Fixed! ~dbstealey, mod.
“However, they make no mention of the Pacific Decadal Oscillations etc. which may invalidate their conclusions.”
So may their dependence also on global temperature data of the last 30 years.
How can anything that scientist Schneider publishes or says be trusted based on his statement quoted above? The only way is if he clearly and thoroughly explains his assumptions, methods, and data so they can be replicated.
Perhaps scientists that make statements like this or who perform what might be fraudulent work (like the hockey stick) need to be put on probation by their colleagues or on a special scrutiny watch list by all journal editors and reviewers.
Happy New Year from Western NY!
After a couple days with temps in the 60’s, all the snow we had (1-2 feet) melted. Now that the last of the flood warnings are ending, there’s another 10″ of that global warming on the ground waiting to be shoveled, with temps diving toward single digits, though quite warm compared to Fairbanks.
All this solar inactivity ought to translate into quite a few nasty winters in the next couple decades. Just what I’m not looking forward to…
Somewhat related story in Saturday’s National Post (Canada) about the Vendee Globe around the world single handed yacht race. The 30 boat fleet has been hit by the worst weather in the 19 year history of the race. Huge storm systems have battered the boats now for two weeks straight. 13 sailors have dropped out. One boat has been lost completely. The remaining yachts are currently south of Tasmania heading easterly. Happy New Year to all.
David L. Hagen (13:24:51) :
Thanks for the links. I see that the replies are not linked from Dr. Schneider’s site. Perhaps this is in keeping with his dilemma between honesty and effectiveness? Or perhaps he is simply awaiting a timely response from D&L — after all, it’s only been four years.
Maybe we should start a contest to come up with a name for the expected deep freeze . . . . a la the Maunder Minimum.
How about:
The Barak Ball Chiller
The Hansen Holy Crap it’s Colder’n a Witch’s Left Tittie
or ??
I hate to break in to your Holiday thoughts but Tamino’s last post calls Mr. Watt stupid and/or a Liar. He also implies that all readers of wattsup are stupid also.
What a ~snip~ head Tamino is!
A low energetic Sun plus the “hot water bottle effect” (http://co2sceptics.com/news.php?id=1487) seems logical to me.
The following question: what makes the Sun lower its activity?, we know it has two answers: One from the Sun´s internal dynamo, the other (heretical) that of the barycentric movements (see: http://www.giurfa.com/charvatova.pdf)…For a naive,guileless, ingenuous, credulous, gullible and susceptible layman, it seems to me that both will coincide in the future by means of a field of forces we do not yet detect, and that will remind us again the “music of the spheres”.
Jim Arndt (13:40:08)
I reckon the time constant of the oceans, in response to a step change in insolation, is around 60 years. That means that solar cycles would have to be stronger over several, 5-6 11 year cycles, to have an impact; the current low cycle, if that is what it is, will only have long term effect if it is repeated for a few more cycles.
But regarding the oceans as giant accumulators, with their own resonant frequencies, is, I think, the right approach.
There are many intereacting cycles here: The solar cycles; the oceanic thermal “resonant frequencies”; the Earth’s orbit; cloud formation; jet stream motion. With so many intereacting variables, no wonder the planet’s “climate” appears chaotic, but slow but sluggish (no rapid changes).
Things will get really cold with a succession of weak cycles coinciding with la Ninas and -ve AMOs (if I have the terminology right).
Note to the above:
The term “thermal resonant frequencies” I threw in there is the best way I can describe the idea of warm and cold water sloshing around in an oceanic basin.
Yellowstone sits a top of a thin crust spot and at the end of a series of faults that stretch from southern Cal, thru Utah and Idaho to Yellowstone. The last time this fault line had activity here in Idaho it effected Yellowstone and dropped part of our landscape about 5 feet in one area. There has been increased activity all along those fault lines but usually thats a good thing in small doses because in the world of earthquakes a bunch of little ones let off pressure rather than letting stress build up and cause a massive one.
http://earthquake.usgs.gov/eqcenter/index.php
This site lets you watch animations of earthquakes by area or even over the entire world. Its pretty cool to do the 7 day you can get a bit of an idea how the earth releases the stress of continental plate movement. While some would say , nothing to see here move along, I think with the recent eruptions along the ring of fire we might be seeing our plate movements a bit more dramatically over the next few years. Depending of course on what our lovely Earth has in store for us.
“The earliest the minimum of the sunspot cycles can be is July 2008, which would make the cycle length 12 years 3 months, longest since cycle 9 in 1848.”
Note above quote from the article. How will the end of the minimum be determined? The above statement looks back to July as the earliest it could be. Does this mean that after every month of solar activity data the we look back six months to see if the minimum has been achieved?
Also, is the 213 year cycle referred to related to the cycle of solar inertial motion?
As much as I like the sunspot duration/temp graph, it’s old. The last data is 1980. We now have 28 more years of data. Why hasn’t that graph been updated?
Richard deSousa (11:34:47) :
Nothing like a good old Dalton or Maunder Minimum to gag forever the likes of Hansen, Gore, Mann and company. The hubris of these so called scientists (Gore, excepted) is breath taking. They should all be crawling under rocks and never be heard from again.
I would expect at least an ongoing attempt to morph to “Man Made Emissions of CO2 Cause Extreme Climate Change Events”. Which would allow for either Warming or Cooling scenarios.
Then if/when it cools, they can claim a successful prediction.
The key point is to keep hyping the fear, maintain control and get the $$$ rolling in.
So no gag – sorry. What will gag them is to be roundly and publically discredited which hasn’t yet happend.
Arthur Glass (13:47:07) :
‘And like most people we’d like to see the world a better place…’
So did Lenin.
As do all Tyrants (and associated Psychopaths) – it’s better if it conforms to their personal vision of what is better.
Unfortunately for the rest of us – their visions are our nightmares.
Speaking of Tamino, can someone deconstruct this graph for me: http://tamino.files.wordpress.com/2008/12/5yr.jpg?w=489&h=361 . I thought that 1934 was the hottest year in the last century, yet this graph shows that this year, one of the coldest in recent memory, was far hotter. What’s up?
Fred from Canuckistan . . . (14:37:29) :
“Maybe we should start a contest to come up with a name for the expected deep freeze . . . . a la the Maunder Minimum.
How about:
The Barak Ball Chiller
The Hansen Holy Crap it’s Colder’n a Witch’s Left Tittie
or ??”
The new “Maunder Minimum” already is named after Dr. Theodore Landscheidt and it’s called the Landscheidt Minimum which will have it’s Maximum by 2030.
“THE RECOGNITION OF SCIENTIFIC COMMUNITY
Elected member of the American Geophysical Union, the New York Academy of Sciences, the European Science and Environment Forum, the European Academy of Environmental Affairs, and the Wittheit zu Bremen. Director of the International Committee for Research in Environmental Factors of Brussels University. In 1992 recipient of the. Award of the Edward R. Dewey Institute of Cycle Research, California, in recognition of “outstanding accomplishments in the field of Solar Cycle Research”, and for “many contributions to the study of solar-terrestrial cycles.” According to an offer of the group of geophysicists-climatologs from different countries the period of minimum of solar activity forecasted by Dr. Landscheidt around 2030 will be identified as “Landscheidt Minimum”.”
Source:
http://bourabai.narod.ru/landscheidt/
Our best wishes for all the “greenies” in the next “warmest year of the century”, if they succeed removing all the CO2…they will surely die.
By the way, has anybody noticed the big,big contradiction in GW´rs beliefs which promote a decrease in CO2, and, at the same time, an increase of forests?
I believe the correct statement is “the second least active solar year since 1901. There were 287 spotless days in 1901. Or you could almost say “since the first year of the 20th century” (which was, contrary to popular misconception, 1901.)
Happy New Year and a hearty Nov Shmoz ka Pop!
I keep looking for this cycle to get off of the SC4-5 plot, but it refuses:
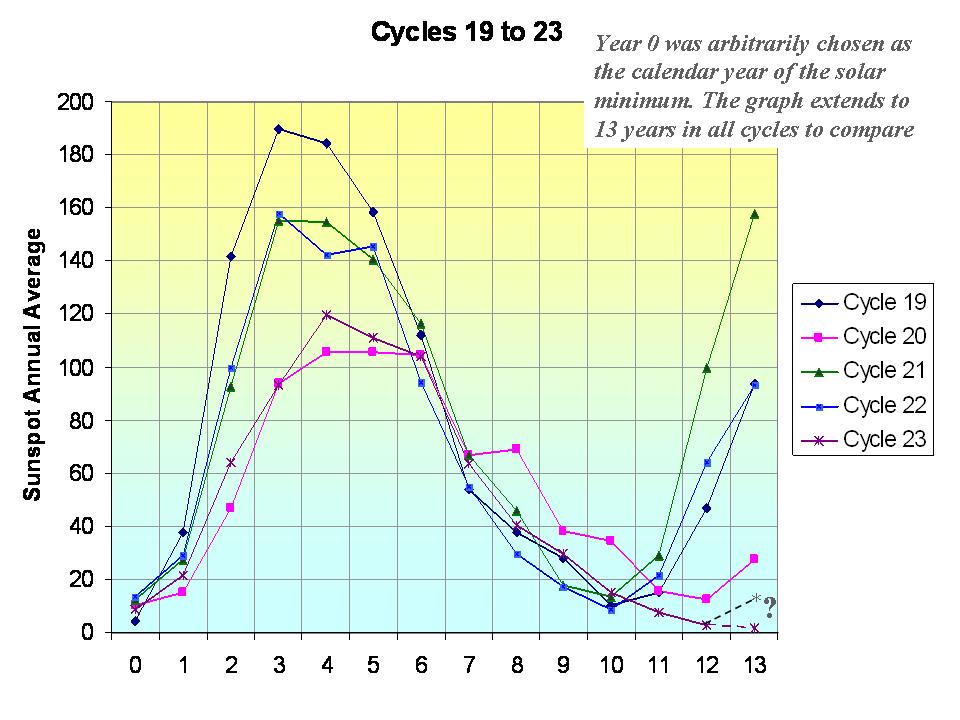
http://www.robertb.darkhorizons.org/DeepSolarMin.htm
If 2009 lies as flat as a pancake, we’re there.
What exact shape will SC24 then take?
I’m guessing the opposite of SC5, or not the double hump.
No science, just pattern matching.
SC24 max = 50 +_10 in 2014.
If the shoe (cycle) fits, wear it.
The Stephen Schneider paper refuting the Friis and Christensen paper didn’t use the “actual” solar cycle length data – they used a variation based on the 22 year Hale solar cycle versus the more common 11 year Schwabe cycle.
Friis and Christensen’s conclusions continue to stand.
You can do your own math here – although this page has solar cycle 24 starting in January 2008 when it is still not clear when and if solar cycle 23 has ended yet (probably July or August 2008 though).
http://en.wikipedia.org/wiki/List_of_solar_cycles
Joseph (12:04:45) :
Your correct, I keep forgetting that politics is the opposite of truth and logic.
WOW, 273 earthquakes in the past 7 days!
CO2 causing this as well? Call Hansen, Gore and Obama asap.
The Laut paper was discussed in passing by Nir Shaviv here:
http://www.sciencebits.com/CO2orSolar
To the solar experts –
It is often argued that TSI has not changed enough to explain global temperatures. Of this Total Solar Irradiance, is there a component of it (perhaps a few wavelength bands) that does vary, plus others that make up the total, such that the oscillations of the more important bands are varying but the total is not much? i.e., is there a component that is mostly reflected that doesn’t matter much, but another that is absorbed that does? – and what are the oscillations of these components?
Thanks… And Happy New Year!
Warren over at climate skeptic has a good article about the same thing except he has added ocean circulation.
Isn’t it strange that if man is controlling the climate, why can he only sit and watch what will be. Shouldn’t we be doing something other than sit here and freeze? Warm is far friendlier to mankind.
Communism and it’s brethren, from socialism to outright skull crushing tyranny, killed by some estimates, between 100-125 million people in the 20th century. I doubt that any worst case scenario of AGW or a natural ice age either, can top that mark. Man seems to have his own ways. I note, isn’t it warming that we don’t know how many millions died, because of socialism/Communism, to better than +-10 million?
Rather than trying to control the uncontrollable, maybe man should try to control what he can — His own lust for power and ruthless domination of others.
May I suggest to this extraordinary site an idea?
Make the following experimental test, which could be seen through a live cam:
Build two crystal boxes, put a plant (or several) in each box. Remove all CO2, continuously, from one box, circulating the air through a Lithium Hydroxide filter, and connect the second one to a CO2 cylinder, keeping CO2 concentration above 5000 ppm or more. Then name the first one: Al´s world, and the second one: Human´s world.
Everybody will watch how life decays in Al´s world and flourishes in Human´s world.
A cool cold next year for all of you!!
David L. Hagen (13:45:07) saith: “For variety, here is a 2007 paper claiming the opposite: ‘Recent oppositely directed trends in solar climate forcings and the global mean surface air temperature’ –MIKE LOCKWOOD, CLAUS FROHLICH”
Very interesting. On first reading, I see no obvious flaws, and it’s well written. Definitely worth another read or three, and a thread. Thanks for the link! Anybody else read it?
anna v (13:53:52) wrote
David Archibald has plots from specific regions/stations that show a correlation of sunspot cycle length and temperature
http://www.warwickhughes.com/agri/Solar_Arch_NY_Mar2_08.pdf
Thank you for the link to this paper Anna. He states his case quite succinctly, but I really, really, hope he is wrong.
MattN (15:58:54) :
As much as I like the sunspot duration/temp graph, it’s old. The last data is 1980. We now have 28 more years of data. Why hasn’t that graph been updated?
It has been but the newer versions don’t fit D’Aleo’s story so he chose to use the old discredited one!
Cary (14:37:31) : I hate to break in to your Holiday thoughts but Tamino’s last post calls Mr. Watt stupid and/or a Liar. He also implies that all readers of wattsup are stupid also.
Says more about Tamino, I think. The high road obviously isn’t his usual route.
I liked the comment there from TCO’s alter ego which Tamino has left unanswered: “how many years decline or plateau would be sufficient to make you decide major problem with AGW” Of course, Tamino’s whole post was that every year this century has been the hottest on record so he would be in a real bind to answer it.
And, while railing about misleading statistics, he stops at 2001 with his 5-year and 10-year averages claiming insufficient data for those following. I guess he feels that “stupid” people won’t notice anyway there is no real need to start on a year divisible by 10 although one commenter did point it out. Tamino’s response: “I started with 1880 because that’s an even multiple of 10, and that’s when GISS data begin. I suspect that anything else would compromise the ‘keep it simple’ principle.” — not to mention it might contradict his argument.
Nor does he see anything wrong with allowing one exceptional year to be propagated to the surrounding years. He has a LOESS curve but neglects to tells us how he got it (although implies he used the annual averages). What he should have used instead was monthly data and even then, it may not be enough data. The last thing anyone should do when using LOESS is eliminate local structure. Here are some thoughts from NIST on using it. Read the section regarding pitfalls.
http://www.itl.nist.gov/div898/handbook/pmd/section1/pmd144.htm
One is the general caution regarding outlier affect on regressions and another is “LOESS needs good empirical information on the local structure of the process in order perform the local fitting”.
His methodology almost completely eradicates the cooling trend from 1940 until almost 1980. A trend which caused nearly as great alarm then (among fear-mongers, that is — one of them named James Hansen — though not as much media attention then) as the trend at the end of the last century has.
So, who is using misleading statistics on the unwary?
REPLY: Ask Tamino about Ian Joliffe, and why no other scientists and contributors guest publish on “Open Mind”, like they do on WUWT. The answer will help you decide. – Anthony
Thank you Google Books. Here’s a month-by-month account of Philadelphia weather from 1790 to 1847. First surprising bit of info: in January 1790, the temperature reached 70, and boys were seen swimming in the Delaware River.
http://books.google.com/books?id=yXkWAAAAYAAJ&pg=PA9&lpg=PA9&dq=temperature+philadelphia+1790&source=web&ots=kDcJ9xhG8H&sig=ocb5JfGI5A8j5ApWfBacyRyY2pY&hl=en&sa=X&oi=book_result&resnum=3&ct=result
Robert Wood: Do you have any references for the 60-year ocean time constant you mentioned?
The latest version of the Southern Ocean SST (ERSST.v3b) has it rising for 75 years from ~1920 to ~1995, before it started its decline.
http://i44.tinypic.com/2uen29u.jpg
But in the earlier version (ERSST.v3), the rise lasts until the early 1980s, making it approximately 60 years, hence my question.
http://i35.tinypic.com/s3djds.jpg
Michael S (17:21:31) saith: “To the solar experts – It is often argued that TSI has not changed enough to explain global temperatures. Of this Total Solar Irradiance, is there a component of it (perhaps a few wavelength bands) that does vary, plus others that make up the total, such that the oscillations of the more important bands are varying but the total is not much?”
I’ve studied astrophysics and orbital mechanics at school, but I’m surely no expert. What the heck, why should that stop me?
Yes, there is another solar ‘component,’ I believe. Pick one: u.v. radiation, x-rays, and magnetic flux. UV flux has dropped by about 1/2 lately; x-rays are down by 10000:1; magnetic flux varies by about 3:1 over a solar cycle. There is also the interplanetary magnetic field, which has dropped off by 10:1 since July of 2003 (peak value 35 –> 3.5). TSI is a constant; these others are wild-ass variables, as you can see.
Read that Lockwood & Froehlich paper referred to above for some good stuff. What’s really happening? Nobody knows. My favorite is this: {woo-woo ON} Moving a conductor in a magnetic field produces current. The Earth core and oceans are both conductors, one strong, one weak. As the Earth orbits the Sun, electricity flows from core pole to core pole via the ocean, warming it. The oceans store this heat and give it up periodically, according to laws that we know not.
Another candidate is raising of the blackbody temperature of the night-time sky by refracted uv/x-rays/cosmic radiation. {woo-woo OFF}
Does this help?
jorgekafkazar (18:00:20) :
The Earth core and oceans are both conductors, one strong, one weak.
I’m not so sure the ocean as a conductor would be considered weak. Resistance should increase with distance linearly, but decreases with area of the conductor linearly as well. It’s a long distance but also a huge area. Just guessing here but I would be inclined to think that current would flow very easily through the oceans especially if you consider all the possible paths of the circuit… Has anyone published anything on this concept? Looking up the conductivity of ocean water…
Anyone know where to find examples of the cyclical nature Jorge mentions?
Long cycles are cold and short ones like the ones in the 1980s and 1990s are warm as this analysis by Friis-Christensen in 1991 showed clearly.
Certainly not in all cases, perhaps his graph needs to go back further. Assuming extra activity=more temperature….we have had several long cycles (over 11.9 yrs) with varying modulation strengths SC5 & 6 are a product of Grand Minima so are controlled by outside forces, SC4 & 23 (could be the 2 longest) were strong cycles that were/are precursors to Grand Minima. SC9 was a medium strength leaving SC13 & 14 which were low activity (expected at the time of lowest angular momentum)
Ron de Haan (16:40:07) :
The new “Maunder Minimum” already is named after Dr. Theodore Landscheidt and it’s called the Landscheidt Minimum which will have it’s Maximum by 2030.
Landscheidt doesnt predict the next grand minimum to start at SC24, he infact states less than 80 SSN with most of the action around 2030…so who will it be named after if it starts now?
‘nobwainer (19:16:10) :
SC4 & 23 (could be the 2 longest) were strong cycles that were/are precursors to Grand Minima. ‘
Sure is shaping up that way.
They already do.
He should call it Open Skull, because the cold air is definitely getting in.
James Hastings-Trew (11:40:06) saith:
“Phil: …The article then goes on to discuss political and sociological implications of the “incorrect” graph rather than merely discuss the matter in a purely scientific / mathematical manner. Sorry, but for me, this paper (already 4 years old) doesn’t pass the sniff test….
I, too, smelled a rat as I read the Damon & Laut paper, probably based on the grotesque, insulting and unprofessional phrasing. On re-reading it, I kept wondering if I sensed the hand of at least one unlisted author. It took a while to notice that M. Mann was one of the referenced data sources.
Anyone else notice that a couple of those low spot years occured at, or around, the time of intense cold in Europe? Times that saw alot of people freeze to death? Specifically World War I, The Ukranian Famine of ’32-33 and World War II. Correlation may not be causation, but it sure as heck is concidental.
I was going to refer to this before, but some time ago I did a correlation analysis to HadCrut anomaly changes versus the length of time elapsing since the min/max antecedent to the most recent min/max (among other correlation analyses I did).
The study I did generally agrees with the relationship of solar cycle length versus temperature change. The reason for the above correlation study was that the temperature is positively correlated with time elapsing since the most recent min/max with time, but as the successive cycles lengthen, there is a definite negative correlation. These two effects will somewhat offset, but as the cycles lengthen, the negative correlation dominates. Multiple lengthy cycles will drive temperatures down.
The full study I did is here:
http://digitaldiatribes.wordpress.com/2008/10/07/solar-cycle-length-sunspot-count-and-temperature-an-insurance-pricing-analysis/
The specific charts that show the negative correlation are here:
http://digitaldiatribes.files.wordpress.com/2008/10/parameter22.jpg
http://digitaldiatribes.files.wordpress.com/2008/10/parameter42.jpg
I hope to build on this study. I am currently compiling the Ocean Index data, Carbon Dioxide data, as well as the sunspot data. Through a similar correlation and minimum bias analysis, I hope to improve on eliminating cross biases and painting a truer portrait of what elements truly have a significant impact on temperature.
jorgekafkazar,
here is an interesting way for the sun to transfer energy to earth:
http://science.nasa.gov/headlines/y2008/30oct_ftes.htm
haven’t seen any articles on how much difference this might make!! With the sun at a low phase, they may be seeing a rather low level of effect!!
The older I get the more the Plasma Universe guys seem to have a better handle on “things”. The Plasma guys say they can explain the universe without the modern day Phlogiston called dark matter and energy!!
http://en.wikipedia.org/wiki/Phlogiston_theory
http://www.holoscience.com/synopsis.php
http://plasmascience.net/tpu/TheUniverse.html
http://plasma.lanl.gov/
http://www.thunderbolts.info/home.htm
In the Tertiary, after 25 million years of global cooling, there was a slight warming trend, in the mid-Miocene, from 17.5 to 15 mya. Rainfall increased, too, called the Miocene pluvials. Forests were everywhere in North America, coast-to-coast, the Caribbean to the Arctic.
The warm bump is associated with the incredible outpouring of molten rock known as the Columbia River Flood Basalts. There is some debate as to what caused them, meteor impact, thinning continental crust, mantle plume, or all three. Whatever it was, it was big. The Earth cracked from Washington to Nevada, and a lava lake formed in eastern Oregon. It overflowed within hours and liquid rock flooded into the Columbia River Basin, filled it up, and turned it into the Columbia River Plateau.
The lava, so hot, so liquefied, and seemingly unending, flowed all the way to the Pacific Ocean, 600 kilometers to the west. It pushed the ancestral Columbia River 200 km north to the Okanogan. Over 164,000 square km were flooded by molten rock, in places over 2 km deep.
The original lava lake became a recumbent volcano, so-called because when one blows, it explodes with such fury that it destroys its own mountain. The terrain is blasted flat and bathed in floods of hot lava that spread over thousands of square miles. Over the next few million years the Columbia hot spot erupted again and again, spewing out dozens of monumental lava floods. In volume, the Columbia River Basalts contain over 175,000 cubic km of rock.
The single cause theory is suspect because at nearly the same time the Steens Mountain Basalts also flooded a vast region, apparently bursting from a different hot spot 400 km south. Two meteor impacts? Multiple hot spots? Plate thinning over there, too? The Steens hot spot vent moved east as the NA continental plate drifted west. Subsequent eruptions then may have formed the Snake River Plain Basalts. The problem with this theory is that the Snake River basalts are evidently somewhat older. The geology is confusing. At any rate, the Steens hot spot, or one of them, is under the Yellowstone recumbent volcano now, and due for another big blow. When it does, the lava will run for hundreds of miles, and the atmosphere will receive a healthy dose of carbon dioxide.
Miocene flood basalts warmed the climate nicely for two million years or so, a respite from the inexorable Big Chill. But then in the Oligocene global temperatures started plunging again. In the Pliocene, about 4 mya, global temps dropped past the Point of No Return. Our planet has not been that warm, or rainy, or forested, or productive, or biologically rich and diverse, ever since.
Leif has been very clear that the difference in average energy coming from the sun within the sunspot cycles is too small to directly affect the climate.
Nevertheless, the little pendulum site he pointed us to http://www.maths.surrey.ac.uk/explore/michaelspages/Coupled.htm gave me another image.
Imagine how many coupled “pendulums” the climate is” PDO etc ocean currents, clouds, storm systems, etc that I do not know. One of these pendulums is the change in local insolation during the day/night and the year. Day/night, though enormous, seem to me too fast to be seen in the system, but winter/summer, which on overage may be 7% but between poles again it is enormous, certainly surface currents, storm systems and cloud systems can be coupled to these oscillations and have resonances appear and disappear.
Within this framework, the small difference in energy between solar maximum and solar minimum, might be the straw that broke the camel’s back at certain points where the coupled system is either on an upswing or a downswing, similar to the the way that close to a metastable state, a very small change in parameters can push a system one way or another.
It is good that Anthony does not discourage speculations :).
James Hastings-Trew (16:28:08).
I believe that graph is for Mars, James. Odd how these boffins forget the simple things, isn’t it.
I wished that the following paper gets more attention:
Solar activity and its influence on climate by Prof C. de Jager
Free abstract can be found on http://www.njgonline.nl/index.html
Prof de Jager is an eminent scientist with impeccable credentials. See http://www.cdejager.com/about/
According to de Jager the Sun’s polar activity (as opposed to the equatorial activity) has always been neglected in Sun-climate studies. In this paper he does take account of the polar magnetic fields.
He also makes a prediction for cycle 24: ” These analyses, together with observations of the polar magnetic fieldstrength during the past few years, in combination with considerations of the long-term and short-term components of solar variability enable us to forecast the maximum strength and time of maximum of the next solar cycle #24 (de Jager and Duhau, 2008). We predict a maximum sunspot number of 68 +/- 17 in 2014.”
On the climate-sun relationship: “In a preliminary investigation, that is presently repeated and improved, we found that about half of the Sun’s equatorial magnetic fields and one third of the Sun’s polar fields contribute to tropospheric temperature, with in addition a small gradual temperature increase.”
I hope Leif could explain to us why he never mentioned the polar fields in his posts and whether he thinks they are of any importance.
phil.
This isn’t Anthony’s document, so I don’t think he can switch graphs.
Also you didn’t mention the reply by Svensmark [1]. The document by Laut you link is just a stupid rant (which complete its stupidity by “proving” CO2 is the main climate force with the hockey stick graph).
It was no error with Svensmarks graph. That was the official numbers proper to use when the document was released. (Laut didn’t had correct values to defend his criticism either, which you can see here below, in Svensmarks anwer, and Lauts answer on that [2]).
Laut actually recieved money from the government to humiliate Svensmark, and Laut recieved gratitudes for this by the former chairman of IPCC. Read it here (in Danish; I suggest you to use a good translator) :
http://www.berlingske.dk/article/20071215/danmark/712150037/
—
[1]
http://www.dsri.dk/getfile.php3?id=290
[2]
http://stephenschneider.stanford.edu/Publications/PDF_Papers/Laut2003a.pdf
—
Q about The Real Issue: How can we come through in the media and political world with the facts that AGW is junk science — from the accumulation oof CO2 in the atmosphere to the totally unlikely positive feedback, which also are large?
My link to the answer by Svensmark was wrong. This one will hopefully work:
http://www.spacecenter.dk/research/sun-climate/Scientific%20work%20and%20publications/Comments%20on%20Peter%20Lauts%20paper.pdf
Phil. (17:38:12) : “It has been but the newer versions don’t fit D’Aleo’s story so he chose to use the old discredited one!”
You rely on this old poor accusation from Laut? In fact a positive argument: Palle et al in this peered document shows a correlation betwen CR and low level clouds at a significance rate at 99.5 percent:
http://www.arm.ac.uk/preprints/433.pdf
Palle et al has also showed that ~5 percent less clouds between 1993 and 2001 dedreased the albedo with ~2 percent (during temperature increase) :
http://solar.njit.edu/preprints/palle1266.pdf
They writes: “a surface average forcing at the top of the atmosphere, coming only from changes in the albedo from 1994/1995 to 1999/2001, of 2.7+-1.4 W/m2 (Palle et al., 2003), while observations give 7.5+-2.4 W/m2. The Intergovernmental Panel on Climate Change (IPCC, 1995) argues for a comparably sized 2.4 W/m2 increase in forcing, which is attributed to greenhouse gas forcing since 1850”
–
Other scienetist (mentioned by Svensmark have also showed a CR cloud correlation, and Sloans and Wolfendales critics was poor with an obvious error:
http://climatesanity.wordpress.com/2008/09/05/applying-monte-carlo-simulation-to-sloans-and-wolfendales-use-of-forbush-decrease-data/
Spotting the solar signal in the temperature date is easy if you average it over 1/3 of the cycle length. This example shows 1950-2008 detrended to remove positive PDO, Phil Jones effect etc.
Here’s the link: :o)
http://www.woodfortrees.org/plot/hadsst2gl/from:1950/mean:43/detrend:0.5/offset:0.6/plot/sidc-ssn/from:1950/scale:0.0015/mean:12
nobwainer (Geoff Sharp) (19:33:04) : “Landscheidt doesnt predict the next grand minimum to start at SC24, he infact states less than 80 SSN with most of the action around 2030…so who will it be named after if it starts now?”
The temperatures we have now isn’t a grand Minimum (or even a little one).
You’re right about Maunder Minimum conditions 2030 [1], but due to Landscheidt a substantial drop in temperature will start 2014, after the maximum of SC24 [2].
[1] http://landscheidt.auditblogs.com/archives/17
[2] http://landscheidt.auditblogs.com/archives/44
“The relative positions of U,S,J,E and V start to fall into diminished configurations from late 2013/early 2014, leading to a lower sunspot count in second half of the cycle. This will be accompanied by increasingly lower global temperatures from 2014 to 2020.”
Maunder Minimum conditions (no sunspots) from now on I don’t think anyone believe in, but already 2015 we may see if Landscheidt is right. (He’s right about the El Nino 1998, or? Interresting times…)
Chris Schoneveld (02:01:27) : I hope Leif could explain to us why he never mentioned the polar fields in his posts and whether he thinks they are of any importance.
http://www.leif.org/research/Polar%20Fields%20and%20Cycle%2024.pdf
Thought I’d save Leif another posting of this site as he just sent me there a couple of days ago:)
Mike D. (00:23:37) :
Glad you brought the flood basalts up. The vulcanologists aren’t sure whether an ‘effusive’ eruption like this would chuck enough into the atmosphere to affect world wide climate.
Seems to me that a few degrees of solar heating over a few hundred sq. miles sets off pretty respectable hurricanes. Would anyone care to speculate as to the weather system that would build up over 100s,000 sq miles with a ground temp of > 100C say.
Surely it would dominate weather world wide?
I’m seeing some kind of hyper-hyper-hurricane probably spinning off very respectable storm systems in their own right?
Magnus (03:13:47) :
The temperatures we have now isn’t a grand Minimum (or even a little one).
Its not about temps although we seem to be heading south quickly, its about the Sun falling into grand minimum( my view is less than 50SSN). I am predicting SC24 will be the start of the next grand minimum which is happening now even though its early days and will will prob start to climb out around 2030. The positions are very good right now and will be at full force at Feb 2010. Expect SC25 to be the same.
Maunder Minimum conditions (no sunspots) from now on I don’t think anyone believe in
We wont get Maunder Min conditions this time around…perhaps even less than Dalton conditions I think, more likely 2 low cycles followed by a recovery, the J+S positions are now weakening and this might be the last grand min for some real distance into the future….we are on the tail end of a truly golden era.
BTW you are quoting links from the site I manage….see my theory here. http://landscheidt.auditblogs.com/archives/58
Landscheidt has done some great work, but I believe what Carl Smith has extracted might go further.
keith (09:36:33) :
“and what does the Sun have to do with heating the Earth?”
and what does my boiler have to do with heating my home?
Concerning Yellowstone:
http://www.telegraph.co.uk/earth/environment/4032098/Yellowstone-Park-shaken-by-hundreds-of-earthquakes.html
My own simple calculations (using data from relatively remote temperature stations with long, unbroken histories) indicate temperature tracks the sunspot cycles (with a physically based delay of a few years). Credible scientists, like Leif, indicate changes solar energy cannot be the “basis”. Thus, I assume there is some other mechanism. However, not knowing the mechanism (yet), does not make the phenomenon disappear, I think.
Is that a spot down there?
http://sohowww.nascom.nasa.gov/data/realtime/mdi_mag/1024/latest.html
Shame – that IBD article starts out with a statement that misinforms the public:
When the sun is active, it’s not uncommon to see sunspot numbers of 100 or more in a single month.
Folks just starting to pay attention will read that and see a feeble start as back to business as usual.
Magnus: Geoff is probably aware of what Landscheidt said (since he runs the website you link to), but it should be noted that Landscheidt’s predictions based on planetary alignment considerations should be reconsidered in the light of Ching Cheh Hungs paper which considers V,E,J to be sufficient to account for most of the effect. This shows the syzurgies going out of phase earlier, around 2004.
I can’t get Leif Svalgaard to comment on Hung’s paper despite many attempts, he always dismisses anything to do with the planets effect on the sun as ‘Astrology’ despite the successful predictions of solar flares and the substantial correlation presented, and despite Ching Cheh Hung’s status as a published NASA scientist. Leif is adamant that gravity is too weak, and electromagnetism is too ‘WOO WOO’ to be considereed.
I think he is wrong to dismiss the interesting and as yet unfalsified theoretical and hypothetical mechanisms on offer.
New Little Ice Age Instead of Global Warming?
by Dr. Theodor Landscheidt
http://www.schulphysik.de/klima/landscheidt/iceage.htm
Let’s see, we are starting off 2009 with the possibility of a grand minimum and Yellowstone is rocking like crazy. Interesting times we live in.
I am curious, how does 2012 affect the sun, I understand the earth is at the center of the galaxy or something?
Those values from max to max of 21 to 22 of 9.7 years and cycle 22 length min to min 9.8 years were based on the data not the graph. They fit the original graph. They both are very short suggesting warm temperatures in the 1990s. The interval of cycle 22 max to cycle 23 max centered in the mid 1990s began to increase at 10.7 years is nearere normal and the min to min length of cycle 23 now at least 12.3 years is well above normal.
Also all the arguments/questions (Phil et al) seem to focus on the cycle length plot but not with the global temperatures. Remember all the other posts here showing the warming in the global data bases is likely exaggerrated for a number of reasons including bad siting, lack of urban adjustment, station dropout. This exaggerration may be 50% (at least 5 peer review papers suggest values 30-50%).
pkatt (03:27:33) :
Many thanks for Leif’s PDF link
:Issued: 2009 Jan 01 0927 UTC
:Product: documentation at http://www.sidc.be/products/ri
#——————————————————————–#
# MONTHLY REPORT ON THE INTERNATIONAL SUNSPOT NUMBER #
# from the SIDC (RWC-Belgium) #
#——————————————————————–#
Provisional International monthly mean Sunspot Number for
December 2008 : 0.8 (zero point eight)…
I’ve wondered often about “harvesting the crop” that is raised, tended and matured on so many threads here.
Phil’s request for the “faulty” graph of Friis-Christensen to be replaced has flushed out the questionable antics of Schneider and the scurrilous behaviour of Damon and Laut: but has Phil taken this in, let alone checked it? And though no much-desired update to Friis-Christensen has appeared, TallBloke rose to the occasion with a graph at WoodForTrees. Both TB and WFT are examples of citizen science at its best IMHO. I plan to add TB’s graph to my Climate Science Primer – TB as you ok with that?
James Hastings-Trew has been helped by various readers and has expressed appreciation. Magnus has been in great form with a funny U-tube and serious comments. Leif’s absence is noticed – but his “double pendulum” image for multiple cycles is working away in people’s minds! We’re reminded that the coming minimum deserves to be – or has been – named after Landscheidt whose pioneering solar work is inspiring many scientists to take the solar cycles seriously as climate drivers.
My high spot of learning was from jorgekafkazar: UV flux has dropped by about 1/2 lately; x-rays are down by 10000:1; magnetic flux varies by about 3:1 over a solar cycle. There is also the interplanetary magnetic field, which has dropped off by 10:1 since July of 2003 (peak value 35 –> 3.5). TSI is a constant; these others are wild-ass variables.
I feel, as do many others no doubt, that though TSI has remained too constant to explain our climate variations, the longer-term variety HAS to go back to the Sun – somehow – and if TSI won’t do it, then it must be factors as yet not spotted, or not correlated, or not shown as reasonable cause-and-effect, or not demonstrated as amplifiers of weak signals.
I ponder the sad degradation of Climate Science that has happened, and what can little me do when there should be thousands of university students, PhD graduates, professors, and Nobel Prizewinners up in arms about this. I remember the story of the Emperor’s New Clothes. I ask for help from Source.
There is far, far more than I can name or appreciate. We all keep on working at it all.
Michael S (19:08:32) said:
“jorgekafkazar (18:00:20) :
‘The Earth core and oceans are both conductors, one strong, one weak.’
“I’m not so sure the ocean as a conductor would be considered weak. Resistance should increase with distance linearly, but decreases with area of the conductor linearly as well. It’s a long distance but also a huge area. Just guessing here but I would be inclined to think that current would flow very easily through the oceans especially if you consider all the possible paths of the circuit… Has anyone published anything on this concept? Looking up the conductivity of ocean water…
Anyone know where to find examples of the cyclical nature Jorge mentions?”
Michael-san: Yes, the oceans are a dandy conductor, though probably not as good as the Earth’s core. I’m not sure how to quantify any of this, as yet. It’s also possible that the Earth’s crust also is an effective conductor on this scale.
I’m not aware of this particular speculation having been proposed anywhere else or by anyone else, though it seems a rather obvious place to look for explanations of a connection between solar cycles and terrestrial heating. I should point out that if this terrestrial dynamo exists, we may be in for some significant geological effects. Moving a conductor (the oceans or Earth’s core, in this case) in a magnetic field creates forces. As the solar flux dissipates, any stresses built up in the Earth’s crust since the last solar-magnetic reversal would now have the lid taken off, so to speak.
Chris Schoneveld (02:01:27) :
Leif’s SC 24 prediction is based on the solar polar field, he just draws the
line between that (and most other things solar) and temperatures on Earth.
Anthony’s reply to DAV (17:46:36) :Ask Tamino about Ian Joliffe, and why no other scientists and contributors guest publish on “Open Mind”, like they do on WUWT.
I remember that. Joliffe demanded an apology from Tamino — and got it — but then Tamino effectively said Joliffe was full of it ; leaving it all in the comments section without altering the main post. Posting at Tamino’s is an exercise. in futility. A perhaps more appropriate title for his blog: “Closed Mind.”
I wonder if Tamino is aware of the irony in his oft repeated refrain: “you *know* your amateurish claim is bullshit, but you’re *counting* on readers not having the expertise to catch your lie.”
Mike D., thanks for the overview of the Columbia River Flood Basalts, of special interest to me since I live in that vacinity – there’s lava all over the place, helping to create some giant canyons as well as plateau, etc. – and for the interesting lava flow-climate connection. I still don’t quite believe that the Earth’s core/sub-mantel heat energy has nothing significant to do with climate or that it can instead be considered as some kind of stable background given.
I have been mulling over the “driver” question. It has occurred to me that I have not considered an enormous source of heat. Is the earth itself not a magma filled balloon? The earth’s crust is not very thick ( relatively speaking) compared to the huge volume of molten rock and metals within. It is also a huge dynamo ( magnetic field and liquid metal core). The dynamo would also be affected by the suns magnetic field which varies as well. We clearly do not have all the pieces of this puzzle. Purely speculation on my part, but one that I find interesting. Comments? Keep the abuse to a minimum, please !! :^)
“though no much-desired update to Friis-Christensen has appeared, TallBloke rose to the occasion with a graph at WoodForTrees. Both TB and WFT are examples of citizen science at its best IMHO. I plan to add TB’s graph to my Climate Science Primer – TB as you ok with that?”
Fine by me Lucy, just make sure the detrending is clearly labelled. The purpose of the graph was to show the clear solar signal in the temperature data. It doesn’t update Christensen as such, but I’d have thought any competent statistician could do that accurately anyway, having made suitable adjustments to the temperature data to allow for the Jones/Hansen effect. Given the bucket adjustment fiasco for postwar sea surface temps and the overblown post 1975 warming figures, I’d say the solar signal is stronger in relation to the other longer term oscillations than has been estimated, maybe around .2C for an average cycle. This leaves us with the question of how the extra effect arrives in the earths climate. Clouds, geomagnetic effects, the interplanetary magnetic field. All these things need much more research money putting in to them.
Also, there is the question of how much energy from successive strong cycles ends up ‘stored’ in the oceans, contributing to longterm trends in the PDO etc.
More like Benny Hill.
No, wait, I liked Benny Hill…
Lucy Skywalker (08:24:34) :
Phil’s request for the “faulty” graph of Friis-Christensen to be replaced has flushed out the questionable antics of Schneider and the scurrilous behaviour of Damon and Laut: but has Phil taken this in, let alone checked it? And though no much-desired update to Friis-Christensen has appeared,
Yes I have checked it and unlike you I read past the ad hominem whining. F-C acknowledged that the point about the mixing of filtered data and unfiltered data was correct but that he shouldn’t be criticized for it because he said that’s what he’d done in the paper. “For the last two extrema [two solar minimum and two solar maximum values], the available data do not allow full smoothing. Therefore we filtered the second to last extrema by estimating the next extremum (because this is included in the filtering with a weight of one-eight only), the last extrema express the unfiltered epochs.” In other words they used a guess which is responsible for that sharp up-tick on the graph used by D’Aleo. My objection the the use of such graphs out of context is that the caveats made in the paper are left behind, had D’Aleo presented the original graph with its caption the mixed data would have been apparent.
In fact as I said above F-C did publish a later paper in which they point out “LFC showed that until 1985, corresponding to the last published data point in the FCL 1991 paper, the solar activity as calculated by the cycle length was indeed increasing in parallel with the temperature. But they also specifically stated that after this date the Northern Hemisphere Land surface temperature variations did no longer follow the solar activity variation expressed by the solar cycle length.” So F-C explicitly states that the agreement “showed clearly” in the 91 graph doesn’t hold past 85 (and that data point relied on a guess).
F-C also disclaimed responsibility for the miscalculation of the period lengths, the “trivial arithmetic error” because it did not come from the Lassen & Friis-Christiansen paper, but from a paper by Thejll and Lassen (yes the co-author of F-C).
So D’Aleo used a graph whose authors admit hasn’t been relevant for more than 20 years without the caveats that those authors saw fit to include in the figure caption when they produced it originally.
Damon & Laut are not the only ones to have taken issue with this data, for example: M. Lockwood and C. Frӧhlich “It should be noted that the solar cycle length L presented here does not appear as similar to the inverse of the global temperature anomaly as has been reported elsewhere ( Friis-Christensen & Lassen 1991).”
David Ball: Yes, the Earth is rather molten down there. A cooling and thereby shrinking crust might crack. Or it could shrink non-uniformly and let a bunch of shallow magma out. We have been fooled by geologic time scales before, no reason to expect we won’t again.
This is an article stating that many scientists are looking for ways to back out from the AGW hoax without damaging their careers!
The wall is falling…
Now it’s the turn for our politicians.
http://www.calgaryherald.com/Cooling+global+warming+hysteria+just+story/1128586/story.html
Tallbloke (06:46:33) :
I can’t get Leif Svalgaard to comment on Hung’s paper despite many attempts, he always dismisses anything to do with the planets effect on the sun as ‘Astrology’
Leif and I had long discussion re Hung and also Desmoulins here (starts about half way through)
http://wattsupwiththat.com/2008/12/14/even-quieter-on-the-solar-front-another-all-quiet-alert-issued/
The recumbent volcano beneath Yellowstone is the tip of a mantle plume. It not some dinky Mt. Saint Helens; it is a major hole in the mantle ala the Hawaiian Islands. It has erupted 3 times
in the past 2 million years, two of those among the largest eruptions known to have occurred on Earth. The last big one was ~600 kya and caused ash flows to the Mississippi. As much as 20 feet of airborne ash was deposited as far away as Texas. The entire continent was impacted in one way or another.
When (not if) the Yellowstone “hot spot” erupts again, it will be devastating to any civilization that exists here. And undoubtedly global climate will be affected, although whomever survives in NA will probably not notice it that much, given the enormity of the direct destruction from the eruption.
Still and all, it will not cause the seas to boil, proof being that previous eruptions did not induce the Venus Effect. That particular Creation-ending phenomenon will be caused by SUV’s, cow flatulence, and coal-fired power plants according to the exploding climate models of eminent NASA “scientists” and Algorites.
Phil thanks for replying. I am already pretty well aware of everything you said – but didn’t spell it out. What I meant originally was, have you taken heed that Damon & Laut were out of order? (and there are a few others). I found out about the limits of Friis-Christensen’s graph, and what he said in acknowledging this, when I discovered a Wikipedia article that mentioned D&L but signally omitted the reply that one would expect, and had other issues that all made me smell a rat – so I did some in-depth research. It’s because I am aware of the limits of the F-C graph that I want to make use of TallBloke’s graph which is uptodate and shows the ongoing correlation that essentially upholds the validity of Friis-Christensen’s original observation of correlation.
Thanks TallBloke. I’m not a statistician but trust I can recognize enough of the difference between good/relevant data and bad/irrelevant data.
Jeff L (12:40:29) :
Your observations are correct.
The lab experiment continues with a lazy sun as you point out.
In addition, CO2 will continue to climb as the Chinese and Indians will NOT do anything to slow their production of cheap energy, via coal burning plants. My understanding is the Chinese are bringing a coal plant every week. Both countries understand economic growth is dependent upon cheap and reliable energy. Both countries are poor and they are really not too concerned about liberals in this country think about their programs.
So the great experiment will continue with not only a lazy sun but growth in CO2, putting the AGW hypothesis in a double test.
All of this will take a few years to work out, so sit back and relax.
The only question is, how much financial muscle will be put behind the AGW theories? My personal opinion, and it is only that, is Obama is too pragmatic an individual to sacrifice an economic recovery on the altar of AGW. To be sure, there will be a lot of lip service to AGW mantras, but when push comes to shove, there will be no carbon tax schemes.
Just imagine how the American public would react to any moves resulting in an increase of 50% on utility bills or a dollar per gallon gas tax. If Obama is silly enough to attempt such a thing, there will be a violent political reaction to such a miscue.
Al Gore is pushing this agenda as we type. His is a pure economic motivation. A carbon tax or cap and trade scheme will benefit his investments. Simple enough to understand. Hansen is out there for ego and pride. Perhaps there are some economic incentives as well.
Both will be disappointed.
Just imagine a carbon tax proposal as the snow flies, temperatures drop, and poor people can’t pay their utility bills.
Don’t even want to contemplate such a scenario.
Anybody catch the new ‘energy czar’s’ commission she’s on?
Carol Browner is on the Socialist International’s ‘Commission For A Sustainable World Society.’
http://www.socialistinternational.org/viewArticle.cfm?ArticleID=1845&&ModuleID=34
Here’s what this group stands for:
(1) To design and put forward proposals for democratic forms of global goverance as the foundation for building a peaceful and sustainable world society overall;
(2) To map out the ways in which social imbalances and economic inequality can be redressed through new forms of governance;
A principal task of new global governance must be to ensure that the benefits of global economic growth and the opportunities for economic development are distributed fairly
Too many people in different regions of the world are being left behind, exacerbating social divisions, cultural differences and inequality within and among nations.
http://melbourne.indymedia.org/news/2006/12/133110.php
If I’m reading the above right, this commission she’s on wants a world government and one of the things this government is going to do is address world economic disparity.
Ric Werme (09:33:41) :
My knowledge of sunspots is limited but I have never come across posts that make the distinction between equatorial and polar solar activity. Admittedly, I am not a very regular visitor and may have missed it. Generally, when solar activities are discussed one always refers the visible manifestations, namely the “sunspots”, which I always thought were the equatorial features (up to 35 degrees latitude). They show this typical butterfly pattern between 35N and 35S latitudes.
Michael S and jorgekafkazar.
I too have been thinking of “offbeat” mechanisms to explain the apparent correlation between sunspots and temperature over the last couple centuries. I wonder about gravitational forcing. I.e. energy from gravitational distortions of the earth resolving as heat or somehow increasing heat flow from the core — distortions caused by the same mechanism that causes sunspots — i.e. its not the sunspots themselves, rather the common cause — perhaps the change in the sun’s orbit around the solar system center of mass.
As you suggest, why not energy from magnetic field interactions also adding perceptibly to the planet’s stored heat?
However, I have not tried to calculate the magnitudes of energy involved; so, I do not know if the above mechanisms are plausible — i.e. could possibly explain a few tenths of a degree of global temperature change.
Perhaps its the additive effect of multiple mechanisms having a common cause.
Fred from Canuckistan . . . (14:37:29) :
Al Gore Minimum.
‘Ron de Haan (14:11:49) :
This is an article stating that many scientists are looking for ways to back out from the AGW hoax without damaging their careers! ‘
Oh, no problem there. Let me demonstrate how to do this:
All you have to do is say that we believe that in times of Great Solar Activity, CO2 has been implicated as having a distinct possibility of adding insult to injury factor when it comes to overheating our beloved Planet Earth.
But in times of Miniscule Solar Activity, it’s the pollution and toxins factor from buring fossil fuels that becomes the major source of irritation.
In either case, we are concerned with making our finite supply of fossil fuels last as long as we can make them, and at the same time, take care of our home.
That do it?
Need more?
What to name the Grand Minima if it occurs?
Badalyan had a 50 for SC 24 in 2000.
Svalgard has a 70 for SC24 in 2005.
And Cliverd has a 42 for SC24 in 2006.
Depends on where we land.
Lucy Skywalker (14:51:10) :
Phil thanks for replying. I am already pretty well aware of everything you said – but didn’t spell it out. What I meant originally was, have you taken heed that Damon & Laut were out of order? (and there are a few others). I found out about the limits of Friis-Christensen’s graph, and what he said in acknowledging this, when I discovered a Wikipedia article that mentioned D&L but signally omitted the reply that one would expect, and had other issues that all made me smell a rat – so I did some in-depth research. It’s because I am aware of the limits of the F-C graph that I want to make use of TallBloke’s graph which is uptodate and shows the ongoing correlation that essentially upholds the validity of Friis-Christensen’s original observation of correlation.
So you knew that F-C’s graph that D’Aleo used was dodgy so why don’t you support my position that it’s inappropriate to use it? Just because F-C and Laut don’t like each other is no reason to ignore the flaws in the use of that graph.
You do realize that Tallbloke’s graph is not an update of the one under discussion, it plots a different variable? In fact it disproves F-C’s original thesis since it is detrended.
Mike D.:
When (not if) the Yellowstone “hot spot” erupts again, it will be devastating to any civilization that exists here. And undoubtedly global climate will be affected, although whomever survives in NA will probably not notice it that much, given the enormity of the direct destruction from the eruption.
Hilarious! That, and the rest of your post certainly shows the intellectual value of applied sarcasm. Thanks, again.
Eddy Minimum.
==========
“Leif and I had long discussion re Hung and also Desmoulins here (starts about half way through)”
http://wattsupwiththat.com/2008/12/14/even-quieter-on-the-solar-front-another-all-quiet-alert-issued/
Thanks Geoff, waded through that. It’s obvious from Leif’s comments that he still hasn’t read the Hung paper properly, and is getting the mercury link to solar flares mixed up with the syzygy’s of V,E,J and their correlation with sunspot cycle intensity, after rejecting the V,E,J,M correlation.
Oh well, his loss.
Anyway, I’ve read your stuff on the Landscheidt repository site, great progress, and all the best for 2009. I’m looking more to lgl’s suggestions about resonance, and wave modulation in spin tanks to get a handle on how the planetary motions produce cancelling and amplifying patterns in solar activity.
Leif wants nice clean numbers, he obviously never had to do studies in fluid dynamics involving perturbatory flows. Still, scientists tend to leave that sort of nitty gritty to engineers…
Phil
The data points on the solar cycle length extending the FC plot forward are clear now with length from max to max of 21 to 22 (mid 1980s) 9.7 years and cycle 22 length min to min 9.8 years (centered arounf 1990), both very short supporting warm 1990s and much in line with the 1991 FC plot. The interval of cycle 22 max to cycle 23 max centered in the mid 1990s is also known at 10.7 years but the min to min length of cycle 23 is still TBD but at least 12.3 years.
What is not clear is the surface temperatures which because of station dropout around 1990 http://icecap.us/images/uploads/Stationdropout.jpg and other factors http://icecap.us/images/uploads/DataIntegrity.doc is likely exaggerrated. Instead of thinking temperatures proving the solar connection incorrect, maybe we should use the long term solar correlation to prove the Hadley/NOAA/NASA temperatures are faulty. I chose the FC chart that ended at 1990 before most of the temperature issues arose.
In other news, globaloney hits Malibu!
Feel the envy:
Magnus and others
Thank you for your links to the two Landscheidt’s documents. It answers my earlier question (15:32:55) regarding the 213 year period and solar inertial motion. You are likely aware of the Richard Mackey presentation of Rhodes Fairbridge’s work on SIM http://www.griffith.edu.au/conference/ics2007/pdf/ICS176.pdf
I’m curious as to your take on the relationship between the two.
I am still also interested in a brief explanation of how the end of the minimum will be established. Can you or fellow expert provide such?
Mark (15:14:04) :
You think that’s bad, we finally have it from the horse’s mouth – the real purpose behind the AGW myth, redistribution of wealth: (letter from James Hansen to Barack Obama).
http://newsbusters.org/blogs/noel-sheppard/2009/01/01/nasas-hansen-obama-use-global-warming-redistribute-wealth
QED.
Robert Bateman (16:04:40) :
What to name the Grand Minima if it occurs?
Badalyan had a 50 for SC 24 in 2000.
Svalgard has a 70 for SC24 in 2005.
And Cliverd has a 42 for SC24 in 2006.
Depends on where we land.
There’s a big difference in proposing a next low min based on precursor methods or whatever and predicting a full solar grand minimum…how many have done that?
Tallbloke (16:44:49) :
Anyway, I’ve read your stuff on the Landscheidt repository site, great progress, and all the best for 2009.
Thanks…might be an interesting year
Ron de Haan (16:40:07)
‘The new “Maunder Minimum” already is named after Dr. Theodore Landscheidt and it’s called the Landscheidt Minimum which will have it’s Maximum by 2030.’
Darn, I was hoping for the name Gore’s Minimun.
If we do go into a mini ice age (which I hope we don’t), It should be named Gore’s little ice age.
Folks, attendance to family matters [I was a Santa Claus impostor] has left me off the keyboard for while. It has been fun to see the unbridled speculations that apparently can thrive when left alone. I do have a few general comments:
1) use of polar fields [deJager]: he said polar ‘activity’ not polar fields, and I have no idea what he is taking about.
2) F-C&L was a poor paper. It is usually considered inadmissible [or just plain wrong] to mix filtered and unfiltered data. If the effect was present for the last few of the unfiltered data points, it should also have been present in the unfiltered data as a whole, so the need to ‘jack up’ the correlation by filtering over several cycles is a severe weakness. In addition, the ‘length’ of a solar cyle is a somewhat artificial concept [that the Sun doesn’t really know about. A cycle typically lasts ~15 years overlapping with previous and next cycles.
3) Re Hung’s paper: I don’t known what a ‘proper’ reading of a paper is. My main objection to his claim is that if the planetary tides [or positions] can trigger major flares, they should be even more effective for triggering smaller flares [of which we have thousands]. People looking at flare statistics [myself included] have not observed any clear periodicities in the occurrence. Hung also notes that the syzygies and the solar cycles are getting out of sync [with the sun leading!]. His conclusion is that the solar cycle is not caused by tidal forces, but only weakly modulated. Yet some people that claim Hung as supporting evidence ascribe the cycle itself to tides of ‘angular momentum’ and such. The various ‘planetary’ theories are not mutually coherent and are [as Hung notes] energy challenged.
It is every scientists dream to overthrow the standard paradigm, so papers [well, it was only a ‘report’] like Hung’s are often studied to see if there might be something there. Scientists quickly learn to separate the wheat from the chaff, and I have seen precious little wheat, and chaff is not something anybody wants to spend time refuting, because it is not necessary: chaff advertises itself as such.
nobwainer (Geoff Sharp) (17:50:25) :
There’s a big difference in proposing a next low min based on precursor methods or whatever and predicting a full solar grand minimum…how many have done that?
My seven-year old grandson [Peter] for one. I was looking at http://sidc.oma.be/html/wolfaml.html and he looked over shoulder and commented: “it sure looks like the next one will be small as the three drawings look pretty much alike”.
Interesting SC24 presentation from Hathaway on solarcycle24.com for those who havent seen it.
http://sprg.ssl.berkeley.edu/RHESSI/napa2008/
Here’s a controversial graph showing the past grand minima going back 11,000 yrs from Usoskin. It only shows major grand minima (misses the Dalton etc) but it certainly shows some very big gaps in between. All the blue troughs line up with Neptune/Uranus conjunctions but do start to drift out as the records get older….perhaps the conjunctions could be used to re calibrate the carbon dating process?
Here’s a controversial graph showing the past grand minima going back 11,000 yrs from Usoskin. It only shows major grand minima (misses the Dalton etc) but it certainly shows some very big gaps in between.
All the blue troughs line up with Neptune/Uranus conjunctions but do start to drift out as the records get older….perhaps the conjunctions could be used to re calibrate the carbon dating process?
http://users.beagle.com.au/geoffsharp/previousgrandminima.png
That grandson of yours is very observant, Leif. When you look at all those cycles squished down into tiny shapes, it makes it hard to pick out the patterns amidst all the data clobbering.
And when I split and rejoin that graph the result is mind blowing.
http://users.beagle.com.au/geoffsharp/11000c14.jpg
Check the background curve that is now easy to see…far from something a random number generator could do, I bet its the angular momentum curve that controls when we have Grand Minima as well as the strength of each solar cycle.
nobwainer (Geoff Sharp) (21:04:28) :
Check the background curve that is now easy to see…far from something a random number generator could do,
And even further from a periodic orbit-driven generator. But, actually, the spacing of minima has a random character with both large and small gaps. If they were more equally spaced they wouldn’t be random. And the Sun has ‘persistence’: low groups often go together and high groups often go together, but the transition between them is pretty unpredictable. The Earth’s dynamo has similar randomness.
Joe D’Aleo (17:00:30) :
Phil
The data points on the solar cycle length extending the FC plot forward are clear now with length from max to max of 21 to 22 (mid 1980s) 9.7 years and cycle 22 length min to min 9.8 years (centered arounf 1990), both very short supporting warm 1990s and much in line with the 1991 FC plot.
Oh really did you apply the same filtering?
Also if you’re going to post figures from papers it’s considered good form to include the caption.
So you used dodgy data from a paper which had been repudiated by its authors who said “Northern Hemisphere Land surface temperature variations did no longer (since 1985) follow the solar activity variation expressed by the solar cycle length” as support for your title “Portends Cooling”.
I chose the FC chart that ended at 1990 before most of the temperature issues arose.
And yet the MSU data agree with the surface data as far as the trend since that time is concerned. Basically you cherry-picked a graph that fitted your prejudice and used it regardless of the science.
Leif Svalgaard (22:38:53) :
And even further from a periodic orbit-driven generator.
That would depend on the period i would think…how long does it take for the solar system take to come back to exactly the same positions? if someone has worked that out, “that would be the orbit period”….and the C14 graph and matching 10Be graph are probably in tune with J+S+N+U most aligned days.
Sounds like a great job for our friend Jean-Pierre Desmoulins.
Leif Svalgaard (22:38:53) :
But I suspect that the “orbital period” will be around 100,000 yrs just like the Milankovitch cycle that controls our own orbit shape around the Sun…..and you know that cycle is caused by Jupiter, Saturn, Neptune & Uranus.
Usoskin work is only an estimate and should be considerd with great deal of reservation. Although cosmogenic isotope intensity depends inversely on solar activity, there are number of other variables about which there is no certainty. Geomagnetic shielding factors, field intensity and GM equator position are only estimates, the last one being particularly unreliable. Main factor of uncertainty is the intensity of galactic and intergalactic cosmic rays over the period considered, it can not be assumed to be constant, having in mind events such as supernova explosions etc.
It is odd that during the period of 10000y, three least active solar periods took place at 1300-1700. Record of cosmogenic isotope deposited over the period, could be only a rough indicator, not a reliable guide.
“Hung also notes that the syzygies and the solar cycles are getting out of sync [with the sun leading!]. His conclusion is that the solar cycle is not caused by tidal forces, but only weakly modulated.”
I agree with Hung that the solar cycle is not caused by tidal forces.
A beat resonance effect between V,E,J syzygies and another effect (yet to be determined) which gives the sun a ~10 year rhythm seems to be what is modulating the solar cycle intensity.
Given that the tidal forces are small, and given Hungs successful prediction of large solar flares (electrical events par excellence) occuring at locations on the sun where a planet is overhead, and bearing in mind how much stronger electromagnetism is compared with gravity, it seems likely that this would be a more fruitful line of enquiry for those who don’t avert their eyes from demonstrably good correlations for lack of a sufficient theoretical mechanism acceptable to the current paradigm.
It’s great to have stalwarts like Leif to act as reliable touchstones and keepers of solid data. It’s also great to have pioneering spirits like Geoff sharp to head out into unexplored waters on a voyage of discovery. Accusations of haunted demonology and astrology aren’t necessary or warranted IMO. This is a blog for all, not the preserve of published peer reviewed science.
Thanks Tallbloke…but isnt it a great time to be alive and aware. This is all new ground for me…but the further i dig the better it looks.
“You do realize that Tallbloke’s graph is not an update of the one under discussion, it plots a different variable? In fact it disproves F-C’s original thesis since it is detrended.”
HJere’s the non-detrended graph:
http://www.woodfortrees.org/plot/hadsst2gl/from:1950/mean:43/offset:0.6/plot/sidc-ssn/from:1950/scale:0.0015/mean:12
The solar signal in the data is still obvious (as are the effects of the major solar activity events of 1998) , and the key question becomes;
How much of the rising temperature trend is due to a succession of comparatively strong short solar cycles leading to additional oceanic heat storage via a loss of cloud cover, and how much is due to the 30-50% inflation (according, allegedly, to some peer reviewed papers) of the temperature data due to the Hansen/Jones selectivity of station reports, non-adjustment for UHI etc.
In either case, my graph doesn’t disprove Christensen at all. One thing we do know from established science is that given the dropping humidity, is that the temperature rise isn’t due to greenhouse gases.
For a look at how the events of 1998 caused a ‘step change’ in temperature of around 0.2C, have a look at the linear trends in the satellite data:
http://www.woodfortrees.org/plot/uah/to:1997.2/trend:1980/plot/uah/plot/uah/from:1997/to:2008.5/trend/plot/uah/from:2002/trend
vukcevic (02:21:36) :
Usoskin work is only an estimate and should be considerd with great deal of reservation.
My thoughts too, but suspect there is an underlying truth to it…the patterns there, but perhaps needs tightening. A lot of people (incl Leif i think) think that if its all affected by planets it should be the same every 179 yrs…but they fail to see that the positions are similar but different, and its not a random event as it follows a curve relative to the strengths of the alignments .1280 till now is an extraordinary time, but it was very different during the MWP and huge slabs of time around 2000BC….the alignment records certainly concur with that.
I tend to ignore “magnetic ” models and their influence on climate. We each have our biases.
Today, January 2, I saw a formation of geese over Athens, Greece, going south. This is very unusual at this time of the year. October, November, yes. They were too high for me to ask whether they were leaving the north of Greece or coming from further up from the Balkans :). In any case they foretell a tough winter from now on. Considering how sensitive migrating birds are to magnetism it is not out of the question that they are reading the magnetic fields and deciding from that, that it will get bitterly cold. ( that is if we exclude ESP and other metaphysics). That they have not stopped at our northern lakes means they foresee a freezing.
nobwainer (Geoff Sharp) (03:13:25) :
the patterns there, but perhaps needs tightening. A lot of people (incl Leif i think) think that if its all affected by planets it should be the same every 179 yrs…
I believe there is a strong magnetosferic factor (feedback hypothesis) and its relationship to the strength of the heliosphere, which beside level of the solar activity depends on the intensity of the galactic and intergalactic cosmic rays pressure, which we cannot assume to be constant. I believe that 1300-1700 type periods are more frequent than Usoskin’s graphs suggest.
Phil
No point arguing with you. The paper link to the graphic was provided just before the graphic.
The authors were not aware that of the dodgy nature of the temperature data and I believe backed off too soon. Yes the trend in the MSU has been similar but much smaller than the surface station data sets and all data sets are showing cooling since 2001.
I would love to replicate their analysis. We have good data on cycle length now through 2000 and soon 2008/09 when minimum is finally agreed on. But the only trustworthy temperature data is MSU and it only goes back to 1979. The errors in the other data sets increase after 1990.
How is the mood these days at Hadley?
There is now an opdate to the “Evolution of spotless days in SC23-24 and comparison with other cycle transits”. We now have 510 spotless days.
http://users.telenet.be/j.janssens/Spotless/Spotless.html#Evolution
Observe how the SC24 spotless days curve appears to grow rapidly still. The minimum could be very late.
SIDC ISSUES “ALL QUIET ALERT”
Issued: 2009 Jan 02 1215 UTC
:Product: documentation at http://www.sidc.be/products/quieta
#——————————————————#
# From the SIDC (RWC-Belgium): “ALL QUIET” ALERT
#—————————————–#
START OF ALL QUIET ALERT …………………..
The SIDC – RWC Belgium expects quiet Space Weather conditions for the next 48 hours or until further notice.
This implies that: * the solar X-ray output is expected to remain below C-class level, * the K_p index is expected to remain below 5, * the high-
energy proton fluxes are expected to remain below the event threshold.
Leif Svalgaard (19:12:16) :
My seven-year old grandson [Peter] for one. I was looking at http://sidc.oma.be/html/wolfaml.html and he looked over shoulder and commented: “it sure looks like the next one will be small as the three drawings look pretty much alike”.
Absolutely!
I hope that young Peter one day may also agree with this one,
http://www.vukcevic.co.uk/extrapolation.gif
despite his highly respected grandfather is most categorically refusing even to consider possibility.
Assuming we are heading for a major minimum, I know there has been some discussion of how deep it could be. A Maunder- or Sporer-like minimum would be serious, but surely temperatures weren’t that badly depressed during the Dalton Minimum? I seem to remember that from a recent discussion here.
What were the ocean cycles doing during the Dalton minimum? Recent analyses posted here or in comment links, don’t go back that far, I assume due to unreliability of data. My curiosity is mostly to counter a few AGW believer friends who give the usual ‘global warming will resume when the sun wakes up again’ answer.
anna v (04:48:47) :
Nice observation by the way.
I wish he would throw in the cycles previous to 10 to see how they stack up.
Scotty, I need more data.
Joe D’Aleo (05:46:31) :
Phil
No point arguing with you.
Not if you continue to justify sharp practice.
The paper link to the graphic was provided just before the graphic.
Indeed to a pay site which most of your readers would not be able to access, all the more reason you should include the caption. A graph without its caption is meaningless.
The authors were not aware that of the dodgy nature of the temperature data and I believe backed off too soon.
At issue was the dodgy nature of their period data.
Yes the trend in the MSU has been similar but much smaller than the surface station data sets and all data sets are showing cooling since 2001.
Not true see here for example: MALWARE SITE DELETED
I would love to replicate their analysis. We have good data on cycle length now through 2000 and soon 2008/09 when minimum is finally agreed on.
And as shown by Lockwood and Frӧhlich it doesn’t show the correlation that F_C&L claimed.
http://publishing.royalsociety.org/media/proceedings_a/rspa20071880.pdf
But the only trustworthy temperature data is MSU and it only goes back to 1979. The errors in the other data sets increase after 1990.
I suggest you look at the graph I referenced above.
How is the mood these days at Hadley?
How would I know?
Ellie in Belfast and Robert Bateman
I created this graph to show Hadley CET and sun spot activity back to 1750 in order to see if there were any correlation. The closer to the bottom the green line goes the colder it was. There was about a 70-% correlation but I was told that the electro magnetic activity showed a better fit than sunspots.
I was intending to insert pdo’s, the trade winds and various other information.
If someone will give me a link to the digital data I’ll have a go at graphing it-alternatively people are welcome to use the information in this clickable excel sheet.
http://cadenzapress.co.uk/download/sunspots_mencken.xls
TonyB
vukcevic (07:38:54) :
I hope that young Peter one day may also agree with this one,
http://www.vukcevic.co.uk/extrapolation.gif
I don’t think he will, as it is clear that the two curves are not that well correlated.
despite his highly respected grandfather is most categorically refusing even to consider possibility.
To quote Hathaway [quoting Yogi Berra]: “If I hadn’t believed it, I wouldn’t have seen it”.
Ellie in Belfast (08:13:53) :
but surely temperatures weren’t that badly depressed during the Dalton Minimum?
The cold that there was was mostly due to major volcanic activity.
TonyB, interesting.
I’ve tried looking at the Armagh data. Having read Leif’s posts that TSI does not vary enough, I was looking for influences during the Dalton minimum in Ireland, since there’s already been a correlation proposed for Armagh temps and the NAO, but later in the series. There is slight warming over the Dalton min period, but the most interesting data are seasonal trends (milder Fall and Winter; cooler Spring and Summer), which point either to cloud (Svensmark) or ocean influence.
Would be interesting to compare the CET and Armagh data. I’ve avoided the ability to publish on a personal web page til now, but I’ll get on to it so i can post a link.
Leif, I haven’t gotten to as far as thinking about volcanic influences yet, but i will – thanks.
“My curiosity is mostly to counter a few AGW believer friends who give the usual ‘global warming will resume when the sun wakes up again’ answer.”
Oh, the irony. 🙂
nobwainer (Geoff Sharp) (02:58:38) :
“Thanks Tallbloke…but isnt it a great time to be alive and aware. This is all new ground for me…but the further i dig the better it looks.”
What a puzzle! And we certainly live in interesting times. just a thought, have you tried comparing the magnitude of the historical minima with the position of the U+V+J+S alignment with respect to the solar 7 degree axial inclination? I have reason to believe the effect may be more pronounced when the planetary alignment occurs in a position closely aligned with the direction of the suns tilt. The rate of solar precession is very similar to earth’s, about a degree every 72 years.
vukcevic (07:38:54) :
I hope that young Peter one day may also agree with this one,
http://www.vukcevic.co.uk/extrapolation.gif
Leif Svalgaard (11:51:31):
I don’t think he will, as it is clear that the two curves are not that well correlated.
He might like to look at this one as well.
http://www.vukcevic.co.uk/combined.gif
Solar cycles are a bit like my telephone bill; paid last day of the month, may be 28thor or 30th or 31th or even 29th , but different amount every time.
For the waveforms equations look at:
http://www.vukcevic.co.uk and select LANL link
Tallbloke (13:33:17) :
What a puzzle! And we certainly live in interesting times. just a thought, have you tried comparing the magnitude of the historical minima with the position of the U+V+J+S alignment with respect to the solar 7 degree axial inclination? I have reason to believe the effect may be more pronounced when the planetary alignment occurs in a position closely aligned with the direction of the suns tilt. The rate of solar precession is very similar to earth’s, about a degree every 72 years
Sounds interesting. I suspect if it showed a trend it would be small, but will look into it. What I have noticed is, that its the positions of only 2 planets at the end of the day. N+U always come together the same (naturally) but its the quality of how J+S are lining up at the time that really matters. From 1280 till now (now is getting a lot weaker) was a window thats starts to strengthen after the MWP and continues for 700 or so years. I have gone back 3000 years with Angular Momentum graphs as well as solar system viewers and its pretty clear how unusual this past period has been. I might have a go at the most aligned days project…I see that Desmoulins offers his program on his website.
Leif Svalgaard (11:51:31) :
The cold that there was was mostly due to major volcanic activity.
If memory serves me correctly there were 2 major eruptions during that period (1 unknown) that would have had an impact. But these impacts are mostly over in 1 yr and some effects might linger for 3 yrs as recent temperature movements in pinatubo, krakatoa suggest (they also show a very small cooling that fits amongst the normal fluctuations). Claiming 40 yrs of cooling by volcanoes is probably stretching it a bit.
Leif Svalgaard (11:51:31) :
Ellie in Belfast (08:13:53) :
but surely temperatures weren’t that badly depressed during the Dalton Minimum?
The cold that there was was mostly due to major volcanic activity
So did any major volcanic outbreaks happen just before 1812? The famous Minard diagram shows how how Napoleon’s army was decimated in October-December 1812 by extremely cold weather (-38C at worst) during retreat from Moscow
http://www.math.yorku.ca/SCS/Gallery/minard/minard-odt.jpg
The Tambora outbreak didn’t happen until 1815
http://en.wikipedia.org/wiki/Mount_Tambora
Phil:
Not true see here for example: MALWARE SITE DELETED
There is nothing AT ALL of interest at that site. I question virtually everything on it, and the motive of the author(s). Linking to that graphic was completely pointless.
I DON’T BELIEVE IT.
Find another.
890m.com
Red Verdict Image
In our tests, we found downloads on this site that some people consider adware, spyware or other potentially unwanted programs.
Are you the owner of this site? Leave a comment
Contact information: Popularity
A few users
Automated Web Safety Testing Results for 890m.com
e-mail tests for 890m.com:
Download tests for 890m.com:
Downloads we found on this site:
Download Analysis
mario.exe
BackDoor-CEO trojan
Unlocker 1.8.7 (unlocker1.8.7.exe)
006-Garage.zip
008-WINDOWS.zip
009-SouljaBoy.zip
Phil.
Please do not provide links to malware sites such as “cc890m”
Doing so again will result in permanent loss of your posting privilege here.
Fair warning. No second chances. I don’t tolerate this sort of thing at any level.
Anthony
Ouch! My detectors were silent on that site… but looking through the logs, I see the problem.
Sorry for quoting it!
Carsten Arnholm, Norway (17:56:39) :
So did any major volcanic outbreaks happen just before 1812?
The Tambora outbreak didn’t happen until 1815
You may safely assume that statements I make are based on evidence of sorts, e.g.:
“Ice core evidence for an explosive tropical volcanic eruption 6
years preceding Tambora” Authors: Dai, Jihong; Mosley-Thompson, Ellen; Thompson, Lonnie G.
Publication: Journal of Geophysical Research (ISSN 0148-0227), vol. 96, Sept. 20, 1991, p. 17,361-17,366.
Abstract
High-resolution analyses of ice cores from Antarctica and Greenland reveal an explosive volcanic eruption in the tropics in A.D. 1809 which is not reflected in the historical record. A comparison in the same ice cores of the sulfate flux from the A.D. 1809 eruption to that from the Tambora eruption (A.D. 1815) indicates a near-equatorial location and a magnitude roughly half that of Tambora. Thus this event should be considered comparable to other eruptions producing large volumes of sulfur-rich gases such as Coseguina, Krakatau, Agung, and El Chichon. The increase in the atmospheric concentration of sulfuric acid may have contributed to the Northern Hemisphere cooling observed in the early nineteenth century and may account partially for the decline in surface temperatures which preceded the eruption of Tambora in A.D. 1815.
—–
There is further strong evidence in the 10Be flux [which is distorted by sulfuric acid aerosols] around that time of major volcanic activity, see e.g. the Figure on page 2 of http://www.leif.org/research/TSI%20From%20McCracken%20HMF.pdf as well as around Krakatoa in 1883 and Hekla around 1700.
—–
Lastly, one should not make too much of a single Russian winter. 1942 was a bad one too and no sunspots or volcanic activity to blame…
CodeTech (18:30:52) :
Phil:
Not true see here for example: MALWARE SITE DELETED
There is nothing AT ALL of interest at that site. I question virtually everything on it, and the motive of the author(s). Linking to that graphic was completely pointless.
I DON’T BELIEVE IT.
Find another.
Your personal incredulity is irrelevant, here’s another plot of the same data, I’m sure you’ll find it just as unpalatable: http://atmoz.org/blog/2008/02/27/4-global-temperature-anomalies-say-the-same-thing/
nobwainer (Geoff Sharp) (15:01:38) :
linger for 3 yrs as recent temperature movements in pinatubo, krakatoa suggest (they also show a very small cooling that fits amongst the normal fluctuations). Claiming 40 yrs of cooling by volcanoes is probably stretching it a bit.
Several comments: Volcanoes differ extremely in how much sulfuric acid they produce. The 10Be-record distortions suggest that the effects lasted of the order of a decade, both for the 1800s and for Krakatoa. The Dalton minimum [such as it was] didn’t last 40 years but only about half that from 1799 to 1824 and the cooling didn’t last 40 years only, but perhaps only a decade or less [ see e.g. http://www.leif.org/research/cet2.png for Central England Temperatures or http://home.casema.nl/errenwijlens/co2/europe.htm for Central Europe]
Claiming 40 yrs of non-existing cooling on Uranus being in the House of Aquarius is probably stretching it quite a bit.
wattsupwiththat (18:45:24) :
Phil.
Please do not provide links to malware sites such as “cc890m”
Doing so again will result in permanent loss of your posting privilege here.
Fair warning. No second chances. I don’t tolerate this sort of thing at any level.
Anthony
Sorry if it caused problems, I was unaware of any problems with the site, it’s hosted on WordPress as this one is, I would have thought they’d have counter measures?
I’ve notified the owner.
Reply: Point of information Phil (and Anthony). That site uses WordPress software, but is not hosted on WordPress.com. It appears to be a hosting company under a private address. Probably not all sites hosted there contain malware, but the top level domain has been reported for such behavior by commercial security companies, which means some (perhaps all) of the sites hosted below that top level domain do, and are tolerated by the host. The owner of the blog may want to move to a less problematic host.
~ charles the moderator
Leif Svalgaard (20:38:24) :
This link to the met office shows Hadley temp at that timescale, there is a 40 year cool period from around 1790-1830 which no doubt has some influence from eruptions….
http://www.metoffice.gov.uk/research/hadleycentre/obsdata/cet.html
but it was already cold and as we can see by the giss records Krakatoa “maybe” reduced the temp by .1degC after 1883, 3 yrs later it was on the way up. Such a minor movement could be caused by many other factors as well. Not very convincing. I still think your overplaying the volcano factor. 10Be records are also affected by reduced solar activity.
http://data.giss.nasa.gov/gistemp/graphs/Fig.A2.lrg.gif
The Dalton was certainly no badboy in grand minima terms, but was right on schedule with its timing and modulation, just like the 3 previous minima and like the one we are in now….lucky this one will be even weaker.
New Dalton ?
http://www.vukcevic.co.uk/extrapolation.gif
(periodicity only – blue , amplitude – red )
For the waveforms equations look at:
http://www.vukcevic.co.uk LANL link
New Dalton ?
The above link should be:
http://www.vukcevic.co.uk/combined.gif
Phil, I see your make-believe alarmist fabricated graph, and raise with some actual data:
http://www.junkscience.com/MSU_Temps/MSUvsRSS-m.html
You misunderstood. I don’t find your data “unpalatable”, I find it’s BS.
Not surprisingly, the actual data doesn’t even resemble what you exhibited.
Geoff Sharp
“Sounds interesting. I suspect if it showed a trend it would be small, but will look into it. What I have noticed is, that its the positions of only 2 planets at the end of the day. N+U always come together the same (naturally) but its the quality of how J+S are lining up at the time that really matters.”
Yes, that’s what I was getting at but didn’t make it clear enough. I meant N+U not V+U (silly mistake), but also that it’s the J+S alignment with the suns axial tilt that may have a strong effect. See this discussion for why: (it descends into argument after page 1, but the last page is worth a look where Carl contributed some graphs.)
http://www.bautforum.com/against-mainstream/72665-explaining-planetary-alignments-relationship-sunspot-cycle.html
nobwainer (Geoff Sharp) (22:30:57) :
Hadley temp at that timescale, there is a 40 year cool period from around 1790-1830 which no doubt has some influence from eruptions….
As per your own link, there was no 40-year cool period at that time. There is cold generally until ~1920. The cold is punctuated by several pronounced decadal additional coolings. The first one coinciding with two of the largest solar cycles in the record. The second one with the major volcanic eruptions 1809-1815. The 1820s and 1830s were the warmest decades until the 1930s rolled around.
I still think your overplaying the volcano factor.
Lean and Rind [ GEOPHYSICAL RESEARCH LETTERS, VOL. 35, L18701, doi:10.1029/2008GL034864, 2008 ] find that volcanism is the largest ‘natural’ driver of climate. “[16] Natural influences produce as much as 0.2 K warming during major ENSO events, near 0.3 K cooling following large volcanic eruptions and 0.1 K warming near maxima of recent solar cycles”
10Be records are also affected by reduced solar activity.
But much more by volcanic eruptions. The best example is Krakatoa for which we have good solar data.
The Dalton was certainly no badboy in grand minima terms, but was right on schedule with its timing and modulation.
is invalid circular reasoning: it has to be this way because it fits the scheme.
It is interesting to compare the inverse albedo shape
http://www.leif.org/research/albedo.png
with the temperatures either atmoz http://atmoz.org/blog/2008/02/27/4-global-temperature-anomalies-say-the-same-thing/
or junkscience ihttp://www.junkscience.com/MSU_Temps/MSUvsRSS-m.html
I used the toy model at http://junkscience.com/Greenhouse/Earth_temp.html to turn albedo to temperature and got much greater swings in amplitude ( not surprisingly).
Normalizing on the atmoz anomaly of 2005, I get, starting from 1984, (accuracy not so hot, estimated by eye)
-1.3 C 1984
-1.46
-0.80
-0.63
-1.13
-0.47
-1.17
-0.15
-1.13
-0.01
0.44
2.69 1998
0.83
0.83
0.83
0.5
1.15
-0.96 2004
0.35 2005
It would be very interesting to see the values of albedo since 2005.
Why is there no albedo from satellites?
Tallbloke (02:52:46) :
I read that thread the other day…..the moderator needs an attitude adjustment i think, but remember it all looked a bit suss. Some people get way too lost in the detail.
Leif Svalgaard (02:57:20) :
As per your own link, there was no 40-year cool period at that time.
If you want to get pedantic about it it clearly shows a cooling from late 1770’s to late 1820’s…thats more than 40 years. But as usual we end up quibbling over ridiculous stuff. Your evidence of volcanic influence on climate is weak and I think its time for you to leave a small door open that there might be a possibility that the Sun just might influence our weather.
I have had a private email pointing that my equations
http://www.vukcevic.co.uk/combined.gif
do not work prior to 1810. For any other enthusiast before plotting the equations take note of following:
a) In the cycle periodicity equation prior 1810 the COS functions should be changed to SIN functions (see
http://www.vukcevic.co.uk/
LANL link bottom of page 1)
b) For the amplitude equation, unfortunately this was omitted in the article, so here it is: prior 1810 the COS function should be changed to SIN function, for the second factor only.
For those less enthusiastic you can see extrapolation prior to 1810 on:
http://www.vukcevic.co.uk/combined1650.gif
You notice that equations do not show zero values at time of Maunder minimum. According to Carbon14 data it is more than obvious that solar magnetic activity during Maunder minimum was proceeding as normal without large number of sunspots visible i.e. sunspot activity was suppressed to a minimum.
http://www.vukcevic.co.uk/1600-1700.gif
I believe that a regularly appearing Dalton was forced to the Maunder minimum, by a sudden change in the intensity of galactic and intergalactic cosmic rays pressure reaching the heliosphere , drastically altering relationship between strength of the heliosphere and the planetary magnetospheres, thus in turn affecting intensity of the heliospheric feedback.
Leif Svalgaard (02:57:20) :
The cold is punctuated by several pronounced decadal additional coolings. The first one coinciding with two of the largest solar cycles in the record. The second one with the major volcanic eruptions 1809-1815.
You have been around a long time…and know that there is more than one factor that controls climate. Is there PDO, AMO, NAO or ENSO records available for that era?
And you still havent shown how the almighty 10Be spike from Krakatoa affected our temperature records…the evidence is weak.
I have had a private email pointing that my equations
http://www.vukcevic.co.uk/combined.gif
do not work prior to 1810. For any other enthusiast before plotting the equations take note of following:
a) In the cycle periodicity equation prior 1810 the COS functions should be changed to SIN functions (see
http://www.vukcevic.co.uk
LANL link bottom of page 1)
b) For the amplitude equation, unfortunately this was omitted in the article, so here it is: prior 1810 the COS function should be changed to SIN function, for the second factor only.
For those less enthusiastic you can see extrapolation prior to 1810 on:
http://www.vukcevic.co.uk/combined1650.gif
You may notice that equations do not show zero values at time of Maunder minimum. According to Carbon14 data it is more than obvious that solar magnetic activity during Maunder minimum was proceeding as normal without large number of sunspots visible i.e. sunspot activity was suppressed to a minimum.
http://www.vukcevic.co.uk/1600-1700.gif
I believe that a regularly appearing Dalton minimum was forced to the Maunder minimum by sudden change in the intensity of the galactic rays pressure reaching the heliosphere , drastically altering relationship between strength of the heliosphere and the planetary magnetospheres, thus in turn affecting effectivness of the heliospheric feedback.
I came across this paper from Paul D Jose “Sun’s motions and Sunspots” from 1965 and when I googled it I got the following link:
http://www.scribd.com/doc/8684342/Jose-PD1965Suns-Motion-Sunspots-8-p
If Livingston and Penn are right and 2015 is a key date then a 180 year cycle (~8x Hale or ~2x Gleissberg) would give us the following historical dates:
2015
1835
1655
1475
1295
1115
which compare with
Dalton 1790-1830
Maunder 1645-1710
Spoerer 1420-1530
Wolf 1280-1340
Oort 1010-1050
Reasonable correlation except for Oort but then ‘Oort – Wolf’ was the time of the Medieval Max so maybe things got distorted a bit.
I know things move ahead at a pace and no doubt Leif will tell me why this cycle is irrelevant (notwithstanding the astronomy link) – but it caught my interest at least. I see nobwainer (Geoff Sharp) mentioned the cycle 179 yrs earlier as well.
Geoff and Leif
Hadley does tend to oversmooth. This is raw data and unadjusted from 1660.
http://cadenzapress.co.uk/download/mencken_hobgoblin.xls
http://cadenzapress.co.uk/download/menken_hobgoblin.jpg
The first link includes all the Hadley data and is clickable, the second is a jpeg (some people have trouble opening excel) the temperature was up and down like a yo yo in Britain during that time but from the period 1790 onwards we had our second warmest summer ever in 1826 and our eigth ever warmest in 1781-our third warmest winter was in 1833. THere was a notable cold spike around that time howecver as wqell-our coldest ever winter was 2.3 and third coldest in 1807 so you are both right!
Manyt of the years from 1770’s onwards were generally pretty warm and culimated in many whalers from our fishing villages (incluiding mine) reporting ‘unprecedented’ melting of the Arctic which after three promptings over 30 years finally caused the president of the Royal society to take notice and agree to mount an expedition to go look in 1817. Ironically that was just after the year without a summer when soot from the volcano may have caused additional warming. This phenomenen was also reported in the 1850’s and as you know some say causes arctic melt even now as brown soot blows over from China.
Volcanoes are fascinating but how much influence they have on the climate I’m not expert enough to say so I follow your debates with interest. I’m prepared to be persuaded either way!
TonyB
nobwainer (Geoff Sharp) (05:15:24) :
“As per your own link, there was no 40-year cool period at that time.”
If you want to get pedantic about it it clearly shows a cooling from late 1770’s to late 1820’s…thats more than 40 years.
The CET average for 1750-1777 [late 1770s] was 9.036C, for 1778-1828 [late 1820s] it was 9.101C, and for 1829-1860 is was 9.071C. Pedantry clearly shows that your 40-year period was warmer than the intervals before and after it. One can argue that the errors may be larger than the differences, but that cuts both ways: From the CET there is no evidence of a 40-year cooling. The same conclusion can be drawn from the Central Europe Temps at http://home.casema.nl/errenwijlens/co2/europe.htm in fact, a warming is indicated.
But as usual we end up quibbling over ridiculous stuff.
Taken the above into account, who is quibbling and how ridiculous is it? I think it is time for you to leave the quibbling behind and accept the data: The Dalton ‘minimum’ was not a time of cooling, and whatever severe cooling there was [“the year without a summer”] was largely due to volcanic eruptions.
Your evidence of volcanic influence on climate is weak and I think its time for you to leave a small door open that there might be a possibility that the Sun just might influence our weather.
The very careful analysis by Lean and Rind that I referred to summarizes the best of modern data and analysis technique and concludes:
“[16] Natural influences produce as much as 0.2 K warming during major ENSO events, near 0.3 K cooling following large volcanic eruptions and 0.1 K warming near maxima of recent solar cycles”
marking volcanoes as the largest of the natural influences.
the possibility that the Sun just might influence our weather
As I have always said, there is decent evidence at and below the 0.1K level of solar influence.
nobwainer (Geoff Sharp) (05:46:01) :
And you still havent shown how the almighty 10Be spike from Krakatoa affected our temperature records…the evidence is weak
The key to the puzzle is that the 10Be data shows that the effect lasts several years, not just one. This graph of CET and 10Be derived HMF shows this clearly: http://www.leif.org/research/CET%20and%2010Be.png
For more on volcanic forcing see pages 16-20 of http://lasp.colorado.edu/sorce/news/2008ScienceMeeting/doc/Session4/S4_03_Crowley.pdf [ignore some of the CO2 nonsense before and after the volcanism pages]. Let me repeat: Volcanic forcing is the strongest climate driver on time scales up to a decade or two. You can avoid a lot of ridiculous quibbling by acknowledging this fact right now.
I believe that we are looking at minor perturbations in the Earth’s temperature over the past century and only need to find minor perturbations in the souce – the Sun’s radiated energy.
TSI does not fluctuate more than 0.1% according to the “experts”. However, without the Sun, Earth would cool precipitously and then more gradually until all the energy in the core is radiated into space. Earth’s temperature would approach absolute zero, or -273 Kelvin (-273C). We would be a frozen cinder adrift in space.
Since Earth’s mean temp is about +14C, the Sun (with a contribution from the heat in the core) warms the Earth by 277C. A +/- 0.1% flutuation in total energy input should result in +/- .28C or about 0.5C.
So why do the “experts” consider TSI variance insignificant?
One reader pointed out that my equations for graph
http://www.vukcevic.co.uk/combined.gif
do not work prior to 1810. For any other enthusiast before plotting the equations take note of following:
a) In the cycle periodicity equation prior 1810 the COS functions should be changed to SIN functions (see http://www.vukcevic.co.uk/ LANL link bottom of page 1)
b) For the amplitude equation, unfortunately this was omitted in the article, so here it is: prior 1810 the COS function should be changed to SIN function, for the second factor only.
For those less enthusiastic you can see extrapolation prior to 1810 on:
http://www.vukcevic.co.uk/combined1650.gif
You may notice that equations do not show zero values at time of the Maunder minimum. According to Carbon14 data it is more than obvious that solar magnetic activity during Maunder minimum was proceeding as normal without large number of sunspots visible i.e. sunspot activity was suppressed to a minimum.
http://www.vukcevic.co.uk/1600-1700.gif
I believe that a regularly appearing Dalton minimum was forced into the Maunder minimum by sudden change in the intensity of galactic cosmic rays pressure reaching the heliosphere , drastically altering relationship between strength of the heliosphere and the planetary magnetospheres, thus in turn affecting effectiveness of the heliospheric feedback.
For more details on the heliospheric feedback hypothesis see: http://www.vukcevic.co.uk/
Solar Current link.
Bill Yarber (10:19:54) :
A +/- 0.1% flutuation in total energy input should result in +/- .28C or about 0.5C.
So why do the “experts” consider TSI variance insignificant?
Because of Stefan-Boltzmann’s law that says that the energy goes with the fourth power of temperature, or inversely: the temperature goes to the one-fourth power, i.e 0.1% energy gives 0.1/4 = 0.025% temperature. And 0.025% of 277K is 0.07C. And you can safely remove the quotation marks on “experts”.
nobwainer (Geoff Sharp) (05:00:41) ::
http://www.bautforum.com/against-mainstream/72665-explaining-planetary-alignments-relationship-sunspot-cycle.html
I read that thread the other day…..the moderator needs an attitude adjustment i think, but remember it all looked a bit suss. Some people get way too lost in the detail.
Sure, but I think Ray Tomes is onto something important all the same. Worth picking through his posts in that thread, and taking note of the tables of relative weightings of the planet’s, and the Fourier transformation showing the periodicities of planet pairs and their relationship to sunspot count magnitudes.
CodeTech (01:40:41) :
Phil, I see your make-believe alarmist fabricated graph, and raise with some actual data:
http://www.junkscience.com/MSU_Temps/MSUvsRSS-m.html
You misunderstood. I don’t find your data “unpalatable”, I find it’s BS.
Not surprisingly, the actual data doesn’t even resemble what you exhibited.
And of course you lose! No fabrication at all, the same data used in each case.
Try looking at the direct comparison of the two graphs below, time for you to visit the opthalmologist I think.
http://i302.photobucket.com/albums/nn107/Sprintstar400/CompT.jpg
REPLY: Those graphs don’t have the same vertical scale, so the “opthamologist” (eyeball) comparison is invalid due to the scale difference, which makes one appear to have a steeper rate of trend with time than the other. Magnification effects of scale can be misleading. But that happens on both sides of the debate.- Anthony
“Natural influences produce as much as 0.2 K warming during major ENSO events, near 0.3 K cooling following large volcanic eruptions and 0.1 K warming near maxima of recent solar cycles”
marking volcanoes as the largest of the natural influences.”
Leif, I tried to post this for you on your CA solar blog but had an image problem. This graph appears to show a roughly 0.2K solar signal in the temperature data. Please would you comment?
http://www.woodfortrees.org/plot/hadsst2gl/from:1950/mean:43/detrend:0.5/offset:0.6/plot/sidc-ssn/from:1950/scale:0.0015/mean:12
PaulHClark (06:34:59) :
It is a 210 year cycle that is pronounced.
there is a 100 year also. plus the normal 11,22,33,55- LOL oh ya and to add pdo 60-66?
I say it is some kind of magnetic or cosmic ray influence
these are not what you might like to be “exact” but 11-55 year cycles can be added or subtracted and it gets very close to a match.
1790+210 2000
1835
1655 1645+210 1855
1475 1420+210 1630
1295
1115
which compare with
Dalton 1790-1830
Maunder 1645-1710
Spoerer 1420-1530
Wolf 1280-1340
Oort 1010-1050
the thing is that there is so much interference (noise)
let’s make a list: AO,AMO,PDO,geological ,meteorite dust, planet wobble, deforestation, reforestation, Albeitrio , H2O GHG, oceanic flywheel.
This list is why AGW peps will never find a consensus.
What realy is a worry is the 11000 year cycle that we are at the limit right now.
we have at most a 3000year leeway.
vukcevic (10:31:57) :
I believe that a regularly appearing Dalton minimum was forced into the Maunder minimum by sudden change in the intensity of galactic cosmic rays pressure reaching the heliosphere
The 10Be record [see Figure on page 2 of http://www.leif.org/research/TSI%20From%20McCracken%20HMF.pdf shows that the galactic ray intensity during the Maunder minimum [1645-1690] was not substantially different from, say, 1900-1940. The sharp change in the 10Be precipitation around 1700 was most likely largely due to strong volcanism at that time. You may counter that McCracken’s reconstruction is faulty [and it is, but in a way that does not affect the conclusion] and that you believe in your speculation so strongly that that trumps what meager and uncertain data we have. If so, you are not alone.
Opps 110,000 +/- 11,000 LOL
http://www.warwickhughes.com/agri/Solar_Arch_NY_Mar2_08.pdf
do not read this unless you have a strong constitution LOL
uhm pg. 7
anna v (13:53:52) :
had this link up first.
David Archibald’s paper.
Tallbloke (11:49:06) :
This graph appears to show a roughly 0.2K solar signal in the temperature data. Please would you comment?
You don’t do this by eyeballing. One does this by detrending [if you like – it makes the correlation better 🙂 ], then making a scatter plot of dT versus SSN, then fitting a least squares line to the points. the slope of the line times the average sunspot maximum will be the approximate response to solar activity. Try it. Lean and Rind did essentially that but at the same time also took into account all the other known factors and used a much longer time base. Why did you start only in 1950, the data goes back a century before that?
“You don’t do this by eyeballing. One does this by detrending [if you like – it makes the correlation better 🙂 ], then making a scatter plot of dT versus SSN, then fitting a least squares line to the points. the slope of the line times the average sunspot maximum will be the approximate response to solar activity. Try it. Lean and Rind did essentially that but at the same time also took into account all the other known factors and used a much longer time base. Why did you start only in 1950, the data goes back a century before that?”
Thanks Leif, I knew there would be a proper way to do it. 🙂
I started in 1950 because the detrending facility on the woodfortrees site won’t cope with compound curves too well. It’s just an example, but I’ve tried other periods where the dT trend goes one way with similar results.
When you say Lean and Rind ‘took into account all known factors’ do you mean they removed known feedbacks to try to isolate the resultant temperature change due solely to TSI fluctuation over the solar cycle? If so, what are the other factors they were able to quantify?
Tim L (11:57:39) :
PaulHClark (06:34:59) :
It is a 210 year cycle that is pronounced.
I say it is some kind of magnetic or cosmic ray influence
Dalton 1790-1830
Maunder 1645-1710
Spoerer 1420-1530
Wolf 1280-1340
Oort 1010-1050
If look at
http://www.vukcevic.co.uk/GrandMinima.gif
you can see that the periodicity equation ( with 3 phase change of 90 degrees each, as mentioned in my previous post, at 1810, 1560, 1310 i.e. every 250 years) extrapolated for period 1000 – 2100, it does correctly indentifies beginning of all of the grand minima.
for more details see:http://www.vukcevic.co.uk solar current link
Svalgaard (12:12:11) :
The 10Be record [see Figure on page 2 of http://www.leif.org/research/TSI%20From%20McCracken%20HMF.pdf shows that the galactic ray intensity during the Maunder minimum [1645-1690] was not substantially different from, say, 1900-1940.
Dr. Svalgaard
In my conception of heliosphere (which may be wrong) that is not possible to prove. If heliosphere is exposed to greater GCR pressure it will contract, the gradient of intensity of the internal heliospheric magnetic field will increase proportionaly; hence greater resistance to the GCR penetration: result no change in the count.
By the way thanks for looking at the website. I hope it is a bit warmer in Petaluma than in London, just now we could do with a bit of global warming.
Ellie in Belfast, TonyB: Reconstructed SST data is available from 1850 to present. For many portions of the globe, the data becomes questionable as you go back in time due the minimal number of samples. Example: Areas such as the equatorial Pacific weren’t traveled regularly before the opening of the Panama Canal in the early 1910s. So how reliable is the NINO3.4 data prior to then? I believe they’ve caught the trends and the major events from 1850 to 1910. The accuracy improves afterwards.
People have looked for correlations between solar and SST indices for decades, and they’ll keep looking. But most don’t understand that the ENSO cycle only gives up a portion of its heat during El Nino events; the rest is recycled.
http://bobtisdale.blogspot.com/2008/11/recharging-pacific-warm-pool.html
So how does one isolate and differentiate between new and recycled warm water collecting in the Pacific Warm Pool for the next ENSO event? And how much of an El Nino was suppressed by the volcanic eruption that also occurred then? The example most often cited is the 1982 El Nino and the El Chichon eruption, but the Mount Pinatubo eruption severely dampened a multiyear ENSO event at that time. (And right after the Mount Pinatubo aerosols subside, Arctic temps skyrocket. I’m working on a post on just that subject.)
Tony, PDO data is available from 1900 to present here:
http://jisao.washington.edu/pdo/
Most people don’t understand what the PDO represents. It’s not SST. It’s also not a simple SST residual.
http://bobtisdale.blogspot.com/2008/06/common-misunderstanding-about-pdo.html
Is the PDO an aftereffect of ENSO? The curves of the raw data are very similar. Sometimes the NINO3.4 data leads the PDO and at other times the PDO leads:
http://bobtisdale.blogspot.com/2008/06/chicken-or-egg-pdo-or-enso.html
Check out the link to the paper at the end of that post. It says that the PDO is dependent on ENSO, not vice versa as most people understand.
Long-term (1871-2007) NINO3.4 SST anomaly data is available here:
ftp://ftp.cgd.ucar.edu/pub/CAS/TNI_N34/Nino34.1871.2007.txt
Or you can create your own SST data sets through the NOAA NOMADS system. Instructions:
http://www.ncdc.noaa.gov/oa/climate/research/sst/ERSST-ts.txt
NOMADS website:
http://nomads.ncdc.noaa.gov/#climatencdc
Or, if you want to look at tons of graphs of SST subsets and read my dry interpretation of the data, I’ve done 60+ posts so far:
http://bobtisdale.blogspot.com/2008/06/smith-and-reynolds-sst-posts.html
In most of those posts, not all, I’ve suppressed my AGW skepticism and simply reported what I’ve seen.
Regards
Tallbloke (13:24:55) :
When you say Lean and Rind ‘took into account all known factors’ do you mean they removed known feedbacks to try to isolate the resultant temperature change due solely to TSI fluctuation over the solar cycle? If so, what are the other factors they were able to quantify?
The works. Read it for yourself here: http://www.leif.org/research/LeanRindCauses.pdf
vukcevic (13:42:26) :
In my conception of heliosphere (which may be wrong) that is not possible to prove. If heliosphere is exposed to greater GCR pressure it will contract, the gradient of intensity of the internal heliospheric magnetic field will increase proportionaly; hence greater resistance to the GCR penetration: result no change in the count.
Because the solar wind is supersonic, magnetic changes cannot propagate upstream [as we have discussed many times]. The modulation of cosmic rays does not depend on the ‘gradient’ [which by the way falls off at a fixed power of solar distance (second for radial component, first for azimuthal component), independent of the size of the heliosphere] and but on the number of interaction regions and CMEs. The former increases as the size of the heliosphere increases [a new one added for each rotation of the Sun], so a larger GCR pressure will mean fewer interaction regions and a higher GCR count.
Leif Svalgaard (12:12:11)
The modulation of cosmic rays does not depend on the ‘gradient’ [which by the way falls off at a fixed power of solar distance (second for radial component, first for azimuthal component), independent of the size of the heliosphere] and but on the number of interaction regions and CMEs.
I have to think a bit about that one. For the moment I think of the heliosphere as a balloon where internal pressure (with a falling away gradient) which is maintained by solar wind, against outside pressure of GCR. Possibly wrong, but it suits my way of seeing larger picture.
I wonder what you make of :
http://www.vukcevic.co.uk/GrandMinima.gif
……….and that you believe in your speculation so strongly that that trumps what meager and uncertain data we have. If so, you are not alone.
My confidence in my hypothetical speculations is inferior to the strength of scepticism of others. It is only a diversion from a daily routine and a quasi-intellectual exercise, sort of ‘brain aerobics’.
People have looked for correlations between solar and SST indices for decades, and they’ll keep looking. But most don’t understand that the ENSO cycle only gives up a portion of its heat during El Nino events; the rest is recycled.
Bob, Im sure you are right, I had to detrend the graph below by a factor of 0.5 to get a match between solar cycles and SST’s by a factor of 0.5.
http://www.woodfortrees.org/plot/hadsst2gl/from:1950/mean:43/detrend:0.5/offset:0.6/plot/sidc-ssn/from:1950/scale:0.0015/mean:12
My question to you is whether you believe the ocean managed to store more heat over the strong cycles postwar than in previous warming decades, and whether this fully accounts for the increased anomaly and the ’98 0.2K ‘step change’ following the El Nino. I have a feeling that the step change marks something else coming into the equation, like loss of ionospheric mass, or some electromagnetic factor we don’t know about yet.
Thoughts?
Leif Svalgaard (10:14:59) :
The very careful analysis by Lean and Rind that I referred to summarizes the best of modern data and analysis technique and concludes:
“[16] Natural influences produce as much as 0.2 K warming during major ENSO events, near 0.3 K cooling following large volcanic eruptions and 0.1 K warming near maxima of recent solar cycles”
marking volcanoes as the largest of the natural influences.
This is where your argument falls down. The outcomes of this reort are not repeated in any volcanic eruption after 1880. Here is a GISS graph blown up so we can see the effects clearly showing temp change straight after Krakatoa which had a very large sulfur dioxide content. No .3K reduction, in fact it would be hard to prove Krakatoa had any effect at all and if that small (less than .1K) dip is Krakatoa it didnt last longer than a couple of years and the temp rises quickly in 1885-6….the evidence remains weak.
http://users.beagle.com.au/geoffsharp/krakgiss.jpg
I am re-posting this from earlier because I am interested in why Hathaway shows a 2W/m2 difference in TSI from max to min on SC23? And the trends do fit fairly well but nothing is perfect.
This is a NASA meeting from earlier this month. What amazes me in this is that Hathaway’s TSI number is a change from max to min of 2W/m2(page 5). And if you look at the overall trend in sun spot(page 25) number it trends are very similar (overall) to GISS trends from 1880, if you look since the MM it fits proxy trends well too. I am not saying that it matches GISS bump for bump just the trend. Then match this trend to CO2 and again it is close but CO2 lags. I think what we see is that the oceans act like a battery and charge up over time from the sun, after all the sun is the input of energy into the system and the argument is how much it varies. Then release the energy into the system as climate. Oscillation will occur and you get the PDO and AMO, while simplistic it does make you think. Many parts of the atmosphere are related and there has been an observed link between the ionosphere and the troposphere, the upper troposphere and lower stratosphere. The sun does effect the upper to layers and varies with the solar cycle.
NASA Meeting
http://sprg.ssl.berkeley.edu/RHESSI/napa2008/talks/MonI_Hathaway.pdf
Ionosphere
http://www-star.stanford.edu/~vlf/palmer/palmer.htm
http://www.pnas.org/content/94/20/10512.full
http://www.berkeley.edu/news/media/releases/2006/09/14_weather.shtml
PaulHClark (06:34:59) :
I know things move ahead at a pace and no doubt Leif will tell me why this cycle is irrelevant (notwithstanding the astronomy link) – but it caught my interest at least. I see nobwainer (Geoff Sharp) mentioned the cycle 179 yrs earlier as well.
The 179 year cycle is just a guide, according to my theory there is a window of opportunity every 179 yrs but Jupiter and Saturn alignment control the intensity at the time. The J+S alignment strength lines up perfectly (timing and modulation) with every minima after the MWP. During the MWP J+S go thru a transition stage (very weak alignments). The Oort Min was caused by another pattern (N+U with J+S op). Its a bit hard to get across here…full report here if your interested.
http://landscheidt.auditblogs.com/archives/58
Svalgaard (12:12:11) :
the galactic ray intensity during the Maunder minimum [1645-1690] was not substantially different from, say, 1900-1940.
I was about to give it up for the day, when I remember your old country compatriot Tycho Brahe (my secondary geography teacher use to go on about him) in 1572 observed supernova explosion, and we know now that it is 7500 light-years from Earth. Since it is believed that most galactic cosmic rays derive their energy from supernova explosions, and if I assume high energy GCR travel at 99% of speed of light, it will take another 75 years (around 1650 start of Maunder) to reach the heliosphere.
TonyB (09:16:33) ;
Thanks for the data links – useful . Glad you mentioned it is raw CET.
I tried uploading my excel files on personal space in google.com (my first forray into any public file sharing) but graphs were not supported, nor MS2007. I have pasted the significant graphs (so far) into a webpage (link below). It has a sort of running explanation of what I was trying to do.
http://docs.google.com/Doc?id=dgxfh8sf_0fgg6rjqz
I usually manage to make silly mistakes when posting here (late by the time I get peace to get on to WUWT), so don’t expect too much. I did get what I hoped for that in there was no significant cooling – in fact UK temperatures warmed slightly during the Dalton Minimum. This is good for me scoring a point locally pro scepticism, but I am now hooked on further analysis.
Leif, Tambora shows up well (1816 – the year without a summer), but I’ll look for other volcanic influences.
Bob Tisdale (14:31:47) : I have looked at several of your posts, also in the last few months. Very interesting; doing my best to understand it better.
Bob Tisdale
Thanks for your great info which I will work my way through.
TonyB
Phil. (11:26:02) :
CodeTech (01:40:41) :
Phil, I see your make-believe alarmist fabricated graph, and raise with some actual data:
http://www.junkscience.com/MSU_Temps/MSUvsRSS-m.html
You misunderstood. I don’t find your data “unpalatable”, I find it’s BS.
Not surprisingly, the actual data doesn’t even resemble what you exhibited.
And of course you lose! No fabrication at all, the same data used in each case.
Try looking at the direct comparison of the two graphs below, time for you to visit the opthalmologist I think.
http://i302.photobucket.com/albums/nn107/Sprintstar400/CompT.jpg
REPLY: Those graphs don’t have the same vertical scale, so the “opthamologist” (eyeball) comparison is invalid due to the scale difference, which makes one appear to have a steeper rate of trend with time than the other. Magnification effects of scale can be misleading. But that happens on both sides of the debate.- Anthony
I disagree, my posting was to counter the accusation that the data I posted was fabricated, even with the small change in vertical scale it should be apparent to all but the most optically challenged that the MSU data in each graph is the same. For those I’ve rescaled the graph!
http://i302.photobucket.com/albums/nn107/Sprintstar400/CompT-1.jpg
nobwainer (Geoff Sharp) (15:56:57) :
No .3K reduction, in fact it would be hard to prove Krakatoa had any effect at all
The effect of Krakatoa lasted a full decade after 1883 as shown so nicely in your graph, and also in my graph and the 10Be data: http://www.leif.org/research/CET%20and%2010Be.png
vukcevic (16:17:11) :
If I assume high energy GCR travel at 99% of speed of light, it will take another 75 years (around 1650 start of Maunder) to reach the heliosphere.
Cosmic rays do not travel in straight lines, they are bend and twisted by the galactic magnetic field to the extent that we cannot see where they are coming from. It may be a million years before we see any from Tyge Brahe’s supernova.
Tallbloke: The oceans should have stored more energy with the increase in TSI since SC20 and, going back further in time, since SC14, but I can’t answer your question if it can account for ALL of the increases in SST anomalies. Changes in cloud cover would have an impact, as would the variations in volcanic aerosols.
I did post a video recently about the change in global SST and global temperature since the 1997/98 El Nino. It uses a JPL SSH animation in addition to graphs. It’s about 5 minutes long.
http://bobtisdale.blogspot.com/2008/12/lingering-effects-of-199798-el-nino.html
What I’m looking for is a high-resolution animation of Global SST or SSH since the 1970s. JPL has them as far back as 1992. With everything else I’ve found or created using the NOAA websites in earlier times, the resolution doesn’t work out.
Give me a day or two for a post that might help answer the rest of your question. I’ve segmented high latitude Northern Hemisphere TLT data (MSU AHU) and compared it to NINO3.4 and Sato Index data. ENSO and volcanic aerosols are known to cause changes in global and Arctic temperature and the correlations are quite good. The impacts on high latitude North America and North Atlantic are much greater than on Europe and Asia for example. Things you might expect. The preliminary graphs are done, but as I write a post, there’s always something that I think of that would help illustrate an effect better or emphasize a point.
Regards
Jim Arndt (16:02:02) :
I am re-posting this from earlier because I am interested in why Hathaway shows a 2W/m2 difference in TSI from max to min on SC23? And the trends do fit fairly well but nothing is perfect.
This is a NASA meeting from earlier this month. What amazes me in this is that Hathaway’s TSI number is a change from max to min of 2W/m2(page 5).
I was at that meeting [gave the talk just after Hathaway’s]. The change from min to max is about 1.3 W/m2 or 0.1%. The very low recent minimum values are likely due to a drift of the calibration of the instruments used for the PMOD composite. Here is the difference between PMD and the better calibrated SORCE [TIM] TSI series: http://www.leif.org/research/Diff-PMOD-SORCE.png . You can see it is steadily dropping. This is not a solar effect.
Many parts of the atmosphere are related and there has been an observed link between the ionosphere and the troposphere, the upper troposphere and lower stratosphere. The sun does effect the upper to layers and varies with the solar cycle.
The effects you link to [and many others] go in the other direction: the weather [thunderstorms etc] influencing the ionosphere.
Fred from Canuckistan . . . (14:37:29) :
Maybe we should start a contest to come up with a name for the expected deep freeze . . . . a la the Maunder Minimum.
The solar state gets one name, while the cold climate gets another, so…
The solar minimum ought to be the Landscheidt Minimum since he first predicted it… however the cold period I think ought to be:
The AlGore Cold Period to remind the world for all time about folly…
(Though I could be talked into the Hansen Cold Period…)
I have enjoyed reading the many thoughts on this thread. Tim L, GSharp, Vukcevic thanks for the pointers.
I was doing a little more to develop my understanding of the Gleissberg Cycle and came across this interesting paper which has some predictions that look to be coming to fruition.
http://virtualacademia.com/pdf/cli267_293.pdf
Bob Tisdale – I always enjoy reading your posts but I need to catch up on all you produce – the paper above seems to indicate a strong correlation to SST with the Gleissberg cycle – I think you have hinted at such a connection yourself – I thought you might be interested.
Interestingly we are at a minimum of the Gleissberg cycle now.
Michael S (17:21:31) :
To the solar experts –
I’m not an expert, but I can point you at some information on one of the wavelengths. UV. It creates (therefor modulates) the ozone in the upper atmosphere. It also drops more during sun cool periods. Why does ozone matter? Look under the ‘resources’ tab up top and look for ozone in the comments.
The short form is that O3 blocks the 9-10 micron IR band. Knock out ozone and you open an IR window, so heat leaves in a hurry.
Right now, ozone is down…
The second issue is that the magnetosphere becomes weaker. This lets more cosmic rays hit the air and makes more clouds. More clouds make us cooler by reflecting more sunshine away.
Put these two together: Less heat gets in as light, more leaves as IR, we get colder.
Nobwainer (Geoff Sharp): Why doesn’t Krakatoa show in your graph where you’ve marked?
http://users.beagle.com.au/geoffsharp/krakgiss.jpg
The green error bar might have something to do with it. And in my opinion, GISS is optimistic with their confidence.
Nobwainer (Geoff Sharp): A second thought, the reason why the El Chichon and Mount Pinatubo eruptions don’t have higher global temperature reactions is they were counteracted by El Nino events that occurred at or near the same time.
PaulHClark: Thanks for the linked paper. I’ll take a more detailed look after I’m done with the post I’m preparing, but at first glance, it appears in that 2000 paper Yousef is using a version of TSI that’s obsolete.
Bob Tisdale (07:02:43) :
t appears in that 2000 paper Yousef is using a version of TSI that’s obsolete.
I agree.
Leif: Happy and Healthy New Year to you and yours.
Bob Tisdale (05:35:42) :
Nobwainer (Geoff Sharp): Why doesn’t Krakatoa show in your graph where you’ve marked?
http://users.beagle.com.au/geoffsharp/krakgiss.jpg
The green error bar might have something to do with it. And in my opinion, GISS is optimistic with their confidence.
Thanks Bob, but I am still not convinced. The Hadley spreadsheet supplied by TonyB earlier allows accurately that the temps rose from 1883 and 1884 before falling back to the same level 1885 and if we look at the ice core details thru the Dalton the “unknown” and Tambora eruptions only show elevated sulfur dioxide readings for approx 3 yrs each. I am not denying there is an impact, but suspect its a lot lower than Leif suggests.
http://cadenzapress.co.uk/download/mencken_hobgoblin.xls
http://en.wikipedia.org/wiki/File:Greenland_sulfate.png
Bob Tisdale (17:39:15) :
Tallbloke: The oceans should have stored more energy with the increase in TSI since SC20 and, going back further in time, since SC14, but I can’t answer your question if it can account for ALL of the increases in SST anomalies. Changes in cloud cover would have an impact, as would the variations in volcanic aerosols.
I did post a video recently about the change in global SST and global temperature since the 1997/98 El Nino. It uses a JPL SSH animation in addition to graphs. It’s about 5 minutes long.
http://bobtisdale.blogspot.com/2008/12/lingering-effects-of-199798-el-nino.html
Many thanks Bob, great site, and brilliant animation video, really gives an insight into the dynamics of the world’s ocean circulation and climate. Look forward to your new article.
nobwainer (Geoff Sharp) (13:54:57) :
Laki (Iceland) 1783-84 shows up well in TonyB’s data. It had a major effect on the NH winter temperatures in 1784 in Europe and N America.
Also there’s a link below to a 2005 paper where Laki and Tambora affected growth of the Irish Oak.
http://star.arm.ac.uk/preprints/437.pdf
This site is comparable to the Pastafarians sarcastic t-shirt which shows global warming as a function of number of active pirates. It is what I will call bullshit.
As for the “global temperature database” you refer to; satelite data for global temperature variations has been available as well as ground data. You can see the latest measurements here: earthobservatory.nasa.gov