Old Radar Sites In Greenland Show Icecap Growth Over the Years
(And let’s not forget what we’ve learned about the temperature reporting from the DEW line Radar Stations – Anthony)
By Joseph D’Aleo, CCM, AMS Fellow
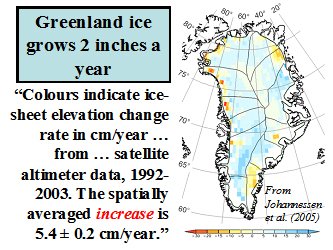
Though the ice may be melting around the edges of the Greenland Icecap in recent years during the warm mode of the AMO much as it did during the last warm phase in the 1930s to 1950s, snow and ice levels continue to rise in most of the interior. Johannessen in 2005 estimated an annual net increase of ice by 2 inches a year.

(Above: Recent Ice-Sheet Growth in the Interior of Greenland, Ola M. Johannessen, Kirill Khvorostovsky, Martin W. Miles, Leonid P. Bobylev, Science Express on 20 October 2005 Science 11 November 2005: Vol. 310. no. 5750, pp. 1013 � 1016, DOI: 10.1126/science.1115356)
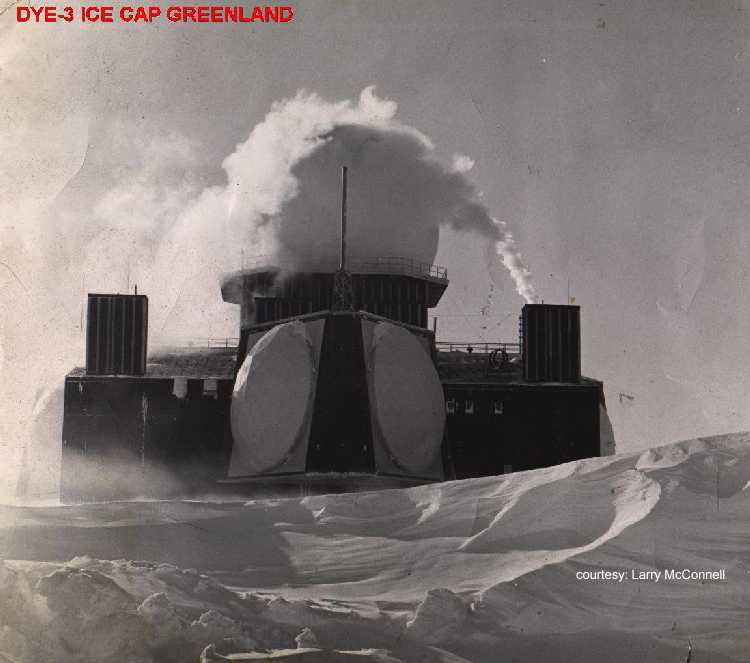
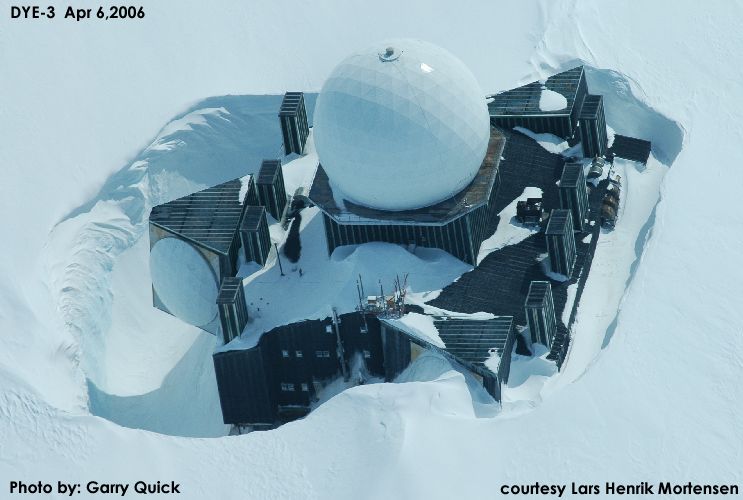
A Canadian Icecap emailer noted during the cold war there were two massive radar sites built on the Greenland icecap now abandoned. They are called Dye-2 and Dye-3. When built they sat high above the snow, recent pictures show how the snow is building up around them, proving the snow build-up in recent times. This demonstrates this snow accumulation over time.
Dye-2 and 3 were among 58 Distance Early Warning Line radar stations built by America between 1955-1960 across Alaska, Canada, Greenland and Iceland at a cost of billions of dollars. Their powerful radars monitored the skies constantly in case Russia decided to send bombers towards America. After extensive studies in late 1957, the USAF selected sites for two radar stations on the ice cap in southern Greenland. Dye-2 was to be built approximately 100 miles east of Sondrestrom AB and 90 miles south of the Arctic Circle at an altitude of 7, 600 feet, and Dye-3 was to be located approximately 100 miles east of DYE II and slightly south at an elevation of 8,600 feet.
The selected locations for the new radar sites were found to receive from three to four feet of snow fall each year. Since the winds were constantly blowing with speeds as much as 100 mph, this snow accumulation constantly formed large drifts. To overcome this potential problem, it was decided that the Dye sites should be elevated approximately twenty feet above the surface of the ice cap.
Dye 3 was built in 1960. From a distance the structure, with its onion-shaped dome, looks like a Russian orthodox church. Dye 3 was an ice core site and previously part of the DEW line in Greenland. (The Distant Early Warning (DEW) Line: A Bibliography and Documentary Resource List Arctic Institute of North America, Page 23). As a Distant Early Warning line base, it was disbanded in years 1990/1991. The Dye 3 cores were part of the GISP (Greenland Ice Sheet Project initiated in 1971) and, at 2037 meters, was the deepest of the 20 ice cores recovered from the Greenland ice sheet as part of GISP. Samples from the base of the 2km deep Dye 3 and the 3km deep GRIP cores revealed that high-altitude southern Greenland has been inhabited by a diverse array of conifer trees and insects within the past million years. (Eske Willerslev, et al. (2007) Ancient Biomolecules from Deep Ice Cores Reveal a Forested Southern Greenland Science 317 111-114)
The first image below is from 1972.

See larger image here.
Here it is in 2006.

See larger image here.
In looking back at the time the sites were abandoned, one console operator lamented “We were very busy during this time and I was sad to see it end. I remember thinking of all the waste,” he said. The site is slowly disappearing into the snow. Its outbuildings are no longer visible and drifting snow will consume it completely one day, but that day appears to be decades away.” Read more here.
posted on solar 24
“Solar activity continues at very low levels and the sun remains blank of sunspots. We are going through what has been a much longer than expected solar minimum.”
As every month passes… looks more and more like David Archibald’s prediction’ are coming to fruition LOL
Altimeter measurements are not definitive. They do not measure the mass of the ice. They measure its altitude, but can’t determine the density.
http://www.sciencedaily.com/releases/2007/03/070327122328.htm
“…Just a few years ago, the world’s climate scientists predicted that Greenland wouldn’t have much impact at all on sea level in the coming decades. But recent measurements show that Greenland’s ice cap is melting much faster than expected.
These new data come from the NASA/German Aerospace Center’s Gravity Recovery and Climate Experiment (Grace). Launched in March 2002, the twin Grace satellites circle the globe using gravity to map changes in Earth’s mass 500 kilometers (310 miles) below. They are providing a unique way to monitor and understand Earth’s great ice sheets and glaciers.
Grace measurements have revealed that in just four years, from 2002 to 2006, Greenland lost between 150 and 250 cubic kilometers (36 to 60 cubic miles) of ice per year. One cubic kilometer is equal to about 264 billion gallons of water. That’s enough melting ice to account for an increase in global sea level of as much as 0.5 millimeters (0.019 inches) per year, according to Isabella Velicogna and John Wahr of the University of Colorado, Boulder. They published their results in the scientific journal Nature last fall. Since global sea level has risen an average of three millimeters (0.1 inch) per year since 1993, Greenland’s rapidly increasing contribution can’t be overlooked. ..”
Sea level hasn’t risen for three years. If Greenland and Antarctica were melting, there would have to be an associated rise in sea level.
http://sealevel.colorado.edu/current/sl_noib_global_sm.jpg
Curious that the “world’s greatest climatologist” seems to have a different opinion, seemingly defying the laws of conservation of mass.
http://www.physics.utoronto.ca/news_repository/will-oceans-surge-59-centimetres-this-century-or-25-metres
a study led by James Hansen, the head of the climate science program at the National Aeronautics and Space Administration’s Goddard Institute for Space Studies in New York and a professor at Columbia University, suggests that current estimates for how high the seas could rise are way off the mark – and that in the next 100 years melting ice could sink cities in the United States to Bangladesh.
“That’s enough melting ice to account for an increase in global sea level of as much as 0.5 millimeters (0.019 inches) per year”
Eric,
At that rate, it will only take 2,000 years for sea level to rise another meter, on top of the 100 meters it has risen during the last 15,000 years. One meter is less than the difference between high and low tide on most beaches.
in the first photo, who is that guy in mukluks mooning us?
I think the truth is they are still calibrating Grace.
http://www.sciencedaily.com/releases/2008/12/081215091013.htm
Some ice melts, the bedrock rises. More ice acculumlates, the bedrock sinks and they have to guess what it all means.
I remember reading the Club of Rome reports. Rather scary at the time, but today we can see the fallacy of extending trends.
At least the Club of Rome had the good sense to use real trends. Hansen is using imaginary trends from computer models to make his predictions.
If Greenland is melting, why aren’t these old DEW line installations high and dry?
Why is it World War II planes left there 60 years ago are hundreds of feet down in the ice?
And these people are worrying about 2% of an inch rise in ocean levels per year?
Sometime in the future, and I don’t think it will be decades, people will simply laugh at this silliness.
The 1972 picture shows the snow already engulfing this building – it was originally built on stilts.
This very nice photo from ’67 shows the original construction…
http://www.firebirds.org/menu10/mn10_p29.htm
I do not know if these sites were built directly on the ice, but if so the structures will slowly sink into the ice, just by their weight. (ref the South Pole Station’s building history)
It also shows the local effect of albedo, if it is not sinking in the ice by its weight as somebody offered.
I would think though that building on stilts, which is usual in areas where there is no solid ground, makes it stable enough. Other wise, if it were sinking, it would have tilted, since certainly the weight is not equally distributed.
Why is it World War II planes left there 60 years ago are hundreds of feet down in the ice?
———————
Well, aside from the obvious snow, a bit of gravity maybe too ?? Which brings me to a similar layperson’s question:
I’ve lived in the East San Francisco Bay now for 30 years. For those who know it, I drive or walk the frontage road along the Bay between Emeryville and Berkeley frequently. As a photographer of wading birds, I have observed the mudflats many times at high tide, low tide and tides in-between. Now, although eyeballing may indeed be more accurate than getting your data from Hansen, I’m still wondering why the San Francisco Bay water level, by 30 years of eyeballing, looks like it’s lower. Is it:
a) because it is lower ?
b) because the seismic activity in the region is lifting the land mass ?
c) dredging of the mud has decreased ?
d) because Mr. Pauchuri thinks that I also believe that the earth is flat ?
e) through z) of other reasons ?
Anyone know ??
http://www.p38assn.org/glacier-girl.htm
WWII Bombers under ’25 stories’ of ice in Greenland… I’d guess that at 3 to 4 feet per year, more or less.
Gee, ice & snow accumulating in the interior and flowing to the edges where it melts near all the (relatively) warm water. Sounds like a normal glacier to me…
I think it was the History Channel had a film of the recovery and restoration of one of the P38 bombers. Amazing.
Does the ice pack on Greenland grow. One measurement over a long period of the 20th century, when “global warming” was supposed to be rampant, was measured with the aid of a Lockheed P-38 Lightning fighter aircraft.
A couple of B-17s and a gaggle of Lightning fighters were being ferried to England in 1942. They ran into heavy weather and had to put down on the ice in Greenland.
The crews were rescued; but it was concluded there was no reasonable way to get the aircraft off the ice again; so they were abandoned.
Many years later; around 2002 as I recall, the aircraft were discovered entombed in the ice (60 years after abandonment). Some of the planes got crushed by the ice on top of them, but at least one P-38 was considered to be sufficiently intact to be recoverable.
They dug down into the ice and removed the ice from around the plane nleaving a space, that enabled the plane to be taken apart and hauled to the surface. The plane was fully restored to flying condition, and a few years ago it took to the air somewhere ion Texas as I recall, after being entombed in the ice for 60 years.
Oh I forgot to mention; the P-38 was buried 262 feet under the ice, when it was discovered and salvaged.
And yes I am recounting this from memory; so all you doubters can google it up for yourself and correct my mistakes.
It is reasonable to conclude that the long term growth rate of Greenland ice in that part of the island is about 4.37 feet per year, so by the time we get that 10 deg C global warming rise in 100 years or so, and the oceans have risen 200 feet, the rest of those planes will be safely buried under about 550 to 600 feet of ice.
Jack Simmons (21:06:25) :
I remember reading the Club of Rome reports. Rather scary at the time, but today we can see the fallacy of extending trends.
Some of us can see the fallacy, others… Required reading in the Economics of Ecology class I took in the ’70s was “The Limits to Growth” by Medows et. al. (i.e. the Club of Rome stuff). The professor was very very good. Mr. Gustafson, I think it was. We had to read “Limits” for 2 or 3 weeks and he let us get up a good head of panic steam… then pulled the rug out.
We were then given a bibliography of the hundreds of works that had destroyed “Limits” and told to pick some percentage of them and report on them. We all felt suckered after reading the critiques… There is nothing like feeling “had” to turn you from the Dark Side 😉 In one swoop he created an entire classroom of new skeptics…
At least the Club of Rome had the good sense to use real trends. Hansen is using imaginary trends from computer models to make his predictions.
Um, I don’t think so. What “Limits” did was computer projections. The only major difference I can see between “Limits” and Hansen is that the models in “Limits” were far simpler (and still wrong). There was an attempt to say that they had not made predictions, only ‘projections’. More hog wash. When the book says ~”We are going to run out of natural gas in 10 years” that’s a prediction even if you wrap it in a disclaimer of ‘if all trends continue’.
The astute reader will notice that 40 years later we have record supplies of natural gas… “Limits” suffered from 2 major flaws (and many minor ones).
The most basic was taking resources as fixed amounts and applying exponential consumption models. Resources are not fixed, they are price dependent, and consumption models are not exponential, they are “S” shaped with price. They also applied exponentials to other things, like population growth, that are also “S” shaped rather then exponential. Their model was broken, rather like Hansen’s model.
The other major flaw was not allowing for resource substitution. Just how many vacuum tubes would it take to run your iPod? Oh, guess we don’t need all that much glass, energy, and metal after all since we’ve moved on from vacuum tubes… I now use a plastic bucket in the yard. When I was a kid it was galvanized steel. etc.
Sometime in the future, and I don’t think it will be decades, people will simply laugh at this silliness.
Yup. It will be added to “Y2k” and the “Tech Bubble” in the modern equivalent of “Memoirs of Extraordinary Popular Delusions and the Madness of Crowds” (a Must Read, BTW…)
[Wow. Good to see someone who knows how resource dynamics wok and how the Club of Rome screwed up. ~ Evan]
Patrick H – D’ya suppose the ice will melt more or less rapidly as temperatures rise?
This recent report on Abrupt Climate change
http://downloads.climatescience.gov/sap/sap3-4/sap3-4-final-report-ch2.pdf
estimated that each 1C rise in temperature adds about 300 Gt per year of ice mass balance loss (but with error bars of 133 Gt). A quick back-of-the-envelope territory sum and
1 cubic kilometre ice = approx 0.92 Gt
1 cubic kilomtere = 0.239 cubic miles
So each additional 1C adds about another 78 cubic miles / year to the rate of melt. An increase of 4C over todays’s temperatures would give a SLR of 0.17 inches/year, a crudely averaged linear increase of 3C between now and 2100 would result in a SLR from meltwater alone of about 12 inches, but with an uncertainty of about +-5 inches.
But the majority of projected SLR (about 70-75% according to the IPCC WG1 Technical Summary) is actually due to thermal expansion rather than meltwater. So a 1 to 1.5m SLR by 2100 is surely at the top end of the range, requiring a worst case temperature rise but it is not totally implausible. If the ice sheet disintegration proves to be non-linear, as Hansen speculates, and some recent observations seem to indicate, then multi-metre rises are a distinct possibility.
While snow added 60 cubic kilometers (14 cubic miles) of ice mass to Greenland’s interior each year between 2003 and 2005, the low-lying coast areas of Greenland lost nearly three times as much ice – 172 cubic kilometers (41 cubic miles) – each year during the same period.
This is the signature you would expect from a warming climate. Increased ice in the interior due to increased precipitation. Decreased ice at the margins due to melt.
I can’t say how valid/accurate the gravimetric measurements are, but I am suspicious of satellite data that is truncated and doesn’t show up to the present. I checked the GRACE website and there hasn’t been any more data published I could see (much of its in German). So all we have is 3 years of data for the Greenland ice melting much faster than thought claim.
If this was the serious problem claimed you’d think publishing the data would be a priority. Unless of course the newer data doesn’t show rapid accelerating ice melt.
Here’s how they built them
http://www.lswilson.ca/dye2construct.htm
John Philip,
I’ve been watching global warming play out since about 1978, and have seen nothing dramatic happen. I don’t expect to see anything dramatic in the next 30 years. Looking at the history, we should expect another news cycle of global cooling hysteria within the next ten years.
“Only two things are infinite, the Universe and human stupidity – and I am not so sure about the former.”
Albert Einstein
philincalifornia (21:47:44)
Very reasonable questions, Phil, but you wouldn’t believe how hard to answer.
First, some geology/geodesy (I’ll keep it simple, if only so I can understand it!). Far from being a billiard ball, the earth is more like a blob of jelly. It’s (nearly) a sphere because that minimises the sum of the potential energies of all its particles. It’s a flattened sphere because it’s rotating. If you disturb the shape of the earth, e.g. by spinning it faster or piling up a mountain range, it will quite rapidly adjust to the new equilibrium shape.
Now think of the Earth’s surface as flat. Except that it isn’t! Mountains stick up, and ocean basins go deep. The fastest-responding element on the surface is water. Actually that responds rather too fast, as it sloshes about under the influence of lunar, solar and all the other gravitational effects. Still, we can damp that out to get a mean sea level. But, the mountains, etc. are still floating on the rock of the mantle. As tectonic plates move about they pile up into each other and pull apart leaving gaps. In San Francisco you’ll know all about that!
Now 18,000 years ago a goodly part of the Northern hemisphere was covered with a couple of miles of ice. With a density of about .8 tons per cubic metre it was about a third of the density of rock, so it was the equivalent of about 4,000 feet of mountain pressing down, and in 18,000 years it has all gone. So now the rock that was underneath the ice finds itself deeper than it should be and so is forced up by the pressure on the mantle driven by those bits that were not ice-covered but driven up by the weight of the neighboring ice sheets (think rubber sheet on water with weights put on it).
OK so far? That’s isostacy. But it’s not the only thing that’s going on in the Earth’s surface. As Tectonic plates collide some slide down under others, forcing them up above where they “should” be – like the Rockies, Andes and Himalayas. There are also uneven distributions of mass within the Earth which mean that the theoretical surface is not even a flattened sphere. The ocean surface roughly follows the gravitational surface, but currents also distort things.
At the end of all that, what is sea level?
Crudely, anything but level. The geodetic answer is rather more complicated, but at the end of it to claim that sea levels are rising world-wide is highly questionable. Yes, we can measure overall sea levels from satellites, but only for the last 30 years or so. All previous records depend on tide poles at ports, and these were put in with reference to stable land levelling benchmarks. Ultimately, the land levelling benchmarks were put in with reference to sea level derived from years of tidal observatiions. Anyone see the circularity here?
Given that land levels are anthing but stable (the Indonesian earthquake of 2001 saw land level sprang up 5 metres in one go), anyone who tells you that world sea lavels have risen or fallen by x cm in the last century or so is talking b*****ks. The land surface is going up and down like a w’s ds all over the world, so to say that we can measure the level world-wide (as opposed to locally) to that degree of precision is compleat nonsense.
John Philip
Patrick H – D’ya suppose the ice will melt more or less rapidly as temperatures rise?
John Philip – D’ya suppose the ice will melt more or less rapidly as temperatures fall?
Greenland appears to be floating upwards – its landmass is rising up to 4 centimetres each year, scientists reveal.
And the large country’s new-found buoyancy is a symptom of Greenland’s shrinking ice cap, they add.
“The Earth is elastic and if you put a load on top of it, then the surface will move down; if you remove the load, then the surface will start rising again,” explains Shfaqat Khan of the Danish National Space Center in Copenhagen.
In the case of Greenland, the “load” is its ice cap, he says.
Such uplift is not an unknown phenomenon. Relic “raised beaches” are relatively common in some areas, where the loss of ice after the last Ice Age caused the land to rise, leaving beaches often metres above the water.
Khan and his team detected the country’s uplift using measurements from GPS stations located on the bedrock, underneath the ice.
Khan and his colleagues have been monitoring data from these stations since 2001 and have found that the southeastern tip of the country is definitely rising upwards. They have also found that the rate of rise has dramatically accelerated in recent years
http://www.newscientist.com/article/dn12872
Jerry 🙂
Brilliant! Just wish my geology lecturers could have put it all in so simple terms I would have understood it much better!
I have a suspicion that we are in free-fall over climate. We observe a change in something, being simple bead wearing stick waving humans we have to attribute it to the gods being angry at us, so we have to appease them! Why can’t think about these changes & conclude that they are simply things we haven’t noticed before, not that we’ve caused them to happen. It was warmer that today in the Bronze age, ditto in the Roman age – they made wine in Yorkshire for instance, it was warmer again in the MWP when the Vikings settled on Greenland, it warmed & cooled at least 4 times during the past 140 years or so. All these periods correlate better than CO2 levels in the atmosphere with changes in the Sun’s output & Sunspot activity.
The problem is that the Tyndall Centre & the Hadley Centre were all set up to find evidence of Global Warming caused by mankind. After a few years one has to produce results as large budgets are involved, along with salaries, pensions, career advancement, status, etc. The whole thing becomes a whirling mass of self-supporting & justifying for existence rather than pure research & science.
BTW, it’s ruddy cold in the UK right now again, a thick carpet of frost everywhere in the west, thank goodness the wind hasn’t returned! More coal please!
George E.Smith.
A man who knows his stuff! and anyone, who doubts his knowledge has taken leave of his/her senses.
Patrick Henry,
Hansen is blowing hot air again. Ask him to put money down on his bs.
I personally sent another e-mail to WP Juliet Eilperin:
http://www.washingtonpost.com/wp-dyn/content/article/2008/12/24/AR2008122402174.html
Offering to bet $10,000.00 on a sea level rise of 30 mm over the next 5 years (0.6 meters by 2108). (I upped the ante thinking my first offer for $1K was maybe too measly for her).
Not a peep!
Carlo,
if they are so sure, they they’ll put their money where their big mouths are.
But observe how they bolt for the exits when we demand they back up their drivel. And observe how they bolt when Steve McIntyre demands they provide their raw data! They’re all a bunch of charlatans.
True land masses rise when ice loads are removed. Also true land masses rise when adjacent neighbouring land are pressed down by increasing ice loading. The pressed-down land areas simply displace the land areas that are less weighted down, and so upwards.
It could very well be that added ice weights in some areas of Greenland are simply pushing those areas that are not gaining weight upwards. This is the case with Scandanavia, which is still rising because of the removed huge ice mass from the previous Ice Age. Scandanavia’s rising is allowing the northern coastal parts of Germany to sink. This is actually being measured today – 10,000 years after the end of the last Ice Age.
To Carlo:
According to the above discussion, Greenland may have lost of order 1000 km3 of ice in the recent 10 years. Take for simplicity only 100000 km2 of southern Greenland and attribute all loss to that area. Makes it an average loss of 1 meter ice in that area. And this should lead to an annual raise of 4 cm per year or 40 cm in 10 years?
That really would be a special sort of jelly (following Jerry).
I know the total area of Greenland is 1.7 million km2 with about 3 million km3 of ice, equivalent to approx. 7 m sea level.
How odd that the fall out from 40s/50s open air nuclear tests in many places can no longer be found. Meaning, no topping up.
As for the principle of building sand or snow dunes, just put any obstructive buildup and it will, thus zero surprise those radar stations now lying deeper in.
Just so that we can be clear on this could you tell us what the signature would be for:
a) No warming or cooling.
b) Cooling.
Presumably these signatures would be completely different from a warming signature and so would be easily distinguishable.
P-38 was a fighter (i.e. pursuit plane). B-17 was a bomber.
The ice is “plastic” as evidenced by the flow of glaciers. Any heavy structure built on the ice will sink over time.
Bruce said,
(21:05:06) :
“I think the truth is they are still calibrating Grace.
http://www.sciencedaily.com/releases/2008/12/081215091013.htm
Some ice melts, the bedrock rises. More ice acculumlates, the bedrock sinks and they have to guess what it all means.”
The article you pointed to was about Antarctica. The article on Greenland I linked had a section about the changes in the earth’s crust. It said,
“To confirm just how much of the mass Grace detects in Greenland and Antarctica is due to snow and ice, scientists also have to determine the contributions from another source, Earth’s changing crust. “When Grace sees a change in polar gravity,” says Watkins, “part of it is today’s ice melt and part is what is called post-glacial rebound.”
“A long time ago during the last ice age, this region was pushed down by even more snow and ice, and now this mantle wants to come back, or rebound,” explains Erik Ivins, a JPL Earth scientist and Grace science team member.
One way to look at the problem, says Ivins, is to imagine a bathtub filling up with water from a faucet but losing water from holes in the bottom of the tub. At the same time, the bathtub may be changing shape.
Ivins and his colleagues are refining the computer models used to understand and predict post-glacial rebound. It turns out that beneath the ice sheet covering Greenland, the mantle isn’t changing the shape of the “bathtub” very fast. “This tells us that the large mass changes Grace detects in the southeastern region of Greenland aren’t due to post-glacial rebound,” says Ivins. ”
So the rebound could make us think that greenland was actually losing less ice than it is, if it were not taken into account.
You have to view it like a water bed. If somone lays beside you, you go up. If that same person gets up and leaves, the area of the departing person rises, and you sink.
Land rising in itself does not necessarilly mean that the ice it carries is diminishing. It could also mean that the nieghbouring land is just getting a heavier load (more snow). Kind of Like a teeter-totter.
266 spotless days in 2008 – 2nd most spotless year since 1900.
http://icecap.us/index.php
Jack Simmons (21:06:25)
“Sometime in the future, and I don’t think it will be decades, people will simply laugh at this silliness.”
But will we and our children be laughing at the taxes, both overt and hidden, and lost liberties which are constantly being eroded?
Once a cap ‘n trade is and the giant bureacracy required to run it (gov’t run of course) is in place, good luck removing it. It needs to be fought now.
Canadians sent a resounding “No” to carbon taxes, but now they are trying to negotiate a cap ‘n trade policy with the USA. A little summary of the expected regulatory environment from the National Post is here:
http://network.nationalpost.com/np/blogs/fpcomment/archive/2008/12/02/cap-and-burn-canada.aspx
I’ll go out on a limb and say:
2007/2008 are likely the most spotless consecutive 2 years in a couple of centuries.
And keep in my our modern observational technologies!
I don’t think the change in snow depths around the DYE stations mean much. I suspect that snow drifting is somewhat like sedimentary deposits in water.
My parents used to live on a tidal estuary in Florida. Think mud flats.
One year a small concrete post with a sign warning of a submarine cable crossing was emplaced in the middle of the estuary. The post was perhaps 8″ square. At low tide the base was in maybe two feet of water, and it protruded about 6′. At hightide the post protruded maybe 3′. The flow was perhaps 4 mph at peak.
Ten years later the post was towards one end of a mud island, perhaps 100′ x 20′ at high tide and 400′ x 40′ long at low tide. Perhaps 18″ of the post protruded from the soil. About 40′ from the post there was now a deep water channel 6′ or so deep at low tide whereas formerly one could only navigate in that area by canoe.
As far as I could tell the cause of the radical transformation of the topography was solely the result of the small perturbation in the current and the consequent “drfiting” of the sediment caused by putting that little post in.
Similarly in my back yard the planting of an apple tree, a meager sapling, caused a far larger drift of snow to occur stretching for many yards.
I have seen several foot deep snow drifts formed in a flat featureless plain by the minor wind perturbation of a ground level railroad track.
I would not attach much importance to the “burying” of features like the DYE stations in Greenland.
O/T Maybe a Q for Leif,
On Spaceweather.com, the holographic image of the Sun, which is normally four or five days later than the current image, shows a possible far-side sun-spot. Shouldn’t it be visible from Earth by now?
If anybody can contact Mr D’Aleo, please let him know his Icecap.us site is down.
philincalifornia
The link below leads to information on projected future sea level rises in San Francisco bay of 20-80 cm. This estimate goes directly back to what I said in an earlier post that govt agencies are being instructed to use IPCC projections whether or not they are rooted in reality –this estimate goes from the bottom to top end at from 8 inches per century-(reasonable) to getting on for three feet-(fantasy figures).
http://www.climatechange.ca.gov/events/2006_conference/presentations/2006-09-14/2006-09-14_KNOWLES.PDF
The next link gives information on the bay-you appear to have the longest tide gauge measurements in the western world. Over the last century the mean sea level rise has been eight inches. Intriguingly the first report above seems to have taken a projection that doesn’t match the actual figures-sea levels appear to have dropped over the last 2 years but the projection is taken from the high point.
http://oceanservice.noaa.gov/topics/navops/ports/san_francisco_tide_gauge.pdf
There is a famous sea level mark in Australia made about the same time as your tidal gauge was established, held up by the Australian authorities as ‘proof’ of considerable rise-nicely debunked by John Daly in this link
http://www.john-daly.com/ges/appendix.htm
This all demonstrates that sea levels go in cycles as does the climate-I would hazard a guess that the warm periods prior to 1850 would have had a higher mean sea level than when the tide gauge was established in the 1850’s and todays levels are merely approaching it again
This is my own graph of Hadley CET figures (I am British) which shows temperature spikes back to the 1660’s. If your part of the world resembles this dataset the thermal expansion mentioned below would only kick in during the warm years thereby raising sea levels.
http://cadenzapress.co.uk/download/menken_hobgoblin.jpg
San Francisco bay sea levels are complicated by regular cyclical thermal expansion (the PDO?) Building and seismic activity-it is difficult to believe your famous earthquakes haven’t had some effect on sea levels locally.
All things being equal however I would say nothing extraordinary is happening and there is no evidence whatsoever to support a 80cm rise and the next few years might see a continuation of the current apparent fall (eyeballed only)
TonyB
Carlo:
Using the current rate of isostatic readjustment to prove current changes of an icecap is nonsense and those “scientists” must know that. In northern Sweden the land is rising about 3 feet per century, in Stockholm about 1.5 feet per century. That is due to a melting ice-cap allright, but one that melted about 11,000 years ago. Rock does flow, but not fast. Also we don’t have a good understanding of the rheology of the Earth, so we can’t really estimate how fast isostatic readjustmen occurs.
By the way it is this uncertainty about isostasy that make the GRACE data extremely dubious. The results must be adjusted by ‘modelling’ the movement of the rock under the ice-cap. So to calculate the current change of the icecap thickness, you first have to know the current and past changes of the thickness and integrate their effect on isostasy.
By the way that New Scientist writer doesn’t seem to have the slightest idea of the magnitude of glacial isostasy. “Leaving beaches often metres above the water”, indeed. 285 metres in Central Sweden to be exact.
A little note on the difficulty of determining sea level. The sea level during the last interglacial is an AGW poster child. It is invariably stated to have been 4-8 meters higher than at present. Actually nobody knows how high it was since it is extremely difficult to find a place where the land hasn’t either sunk or risen during the last 100,000 years. The last interglacial coastline can now be found anywhere from +190 metres to -130 metres depending on where you look for it. This means that the land has risen from +2 to -1 millimeter per year over a 100,000 year period. Short term changes are of course much larger. Measuring sea-level changes of fractions of millimetres per year without a very good independent coordinate system (meaning GPS) is in my opinion impossible.
Isn’t Obama amazing?
He said that “this is when the oceans stopped rising” when he accepted the Democratic nomination and he was right!
Just looking at the provided image, the integration of the losses and gains points towards a net gain.
The losses are not all along the coast like you would expect, but are limited to certain areas. Perhaps 60% of the coastline has shown losses with the other 40% showing no change.
Jerry:
To add to your discussion about isostacy: remember that ocean plates also aren’t fixed and will sink under the weight of water due to ice melting.
Secondly, ice sheets also have gravitational effects, so during the last glacial maximum, the northern hemisphere ice sheets pulled more ocean water towards them due to gravitation.
Jerry, let me echo the thanks of people before me on your very educational response to my question.
I Googled around a bit for more local information. This is pretty interesting:
http://www.bcdc.ca.gov/planning/climate_change/SLR_strategy.pdf
These people, who appear to be looking at practical approaches to conservation of the Bay (as opposed to the carbon swearbox approach) quote a rise in the Bay water levels of 7 inches between 1900 and 2000. I assume that would’ve been measured using tide poles. There is no mention of local land elevation rises (or declinations) affecting this number (although this might not necessarily be the forum for getting into the specifics of that). Given the high seismic activity of the region and known changes in elevation (for example tide pools rising many inches following the 1989 Loma Prieta quake in 1989), one would have to believe that this would affect the numbers for the SF Bay to some extent.
A quote from the authors:
“1 It is particularly difficult to develop a thoughtful strategy for dealing with sea level rise in the Bay when the temperature increase scenarios used by the California Climate Change Center yield possible increases in water level in San Francisco Bay over the next 100 years that have a tenfold difference between the lowest and highest potential increases.”
Good luck with that guys.
It’s so much easier to just legislate against carbon dioxide, isn’t it ??
Alan The Brit — “The problem is that the Tyndall Centre & the Hadley Centre were all set up to find evidence of Global Warming caused by mankind. “
Sort of. Their models were designed from the start to look at the effect(s) of CO2. They put variables in, slosh it about, and not so surprisingly, the answer is that CO2 has something to do with it all. (Wow. Who knew?)
Models don’t discover correlations with solar output, geomagnetic flux, or cosmic rays. They can’t; they’re designed to model what happens when CO2 is increasing.
That models support the CO2 hypothesis is expected, yet the reporting on this seems to not quite grasp that these models are wholly unable to come to any other possible conclusion. I reckon it’s the reporters who don’t grasp it therefore are unable to frame things in context in their “reporting.” None of them seem to know the difference between technology and magic anyway, thus exposing themselves as the butt of Arthur C Clarke inspired after-dinner barbs. Unfortunately, most politicians have no idea who Clarke was, either.
Let me get this straight – The ice and snow melt – -the sea rises – but nothing gets flooded because the land rises along with the sea. Where’s the problem?
“Grace measurements have revealed that in just four years, from 2002 to 2006, Greenland lost between 150 and 250 cubic kilometers (36 to 60 cubic miles) of ice per year.”
It will be interesting to see what things have done since 2006. It would not surprise me to learn that those conditions have reversed since then.
As for sea level, I think we can state with fair certainty that the last interglacial saw higher sea levels even if we can not determine accurately exactly what they were. We would know this simply from seeing where the tree line was. I believe I read that the tree line was some 400 (either km or mi. I can’t remember the units used but I remember the number 400) North of where it is now in North America. If the tree line was 400 miles North of its present location and the continents haven’t shifted much from their present location in that period, we could reasonably assume that Southern Greenland, for example, would have been much warmer than it is now.
If retreating glaciers in Greenland were to expose any small ponds that would have existed during that period, pollen from sediment at the bottom of those ponds/lakes might give us some idea of the glaciation cycles of that area.
But overall, glacial periods are becoming longer. The “normal” state of the system is glaciation with “interglacial” warm periods a temporary state. I believe we would be best served to look at things in that light when making plans for such things as nuclear contamination storage. A good place might be, instead of a mountain in Nevada, a place blasted into bedrock in Northern Canada that will be under a mile of ice for 100,000 years starting at some point in the not too distant future.
And since the switch to glaciation appears to happen quite rapidly we need to have at least some idea of what we are going to do to help our citizens in Alaska and our neighbors in Canada when climate shifts suddenly and their land becomes uninhabitable. As we are entering a period of orbital shape that is increasingly favorable to glaciation, it might take only one deep solar minimum to trigger the switch. If the Little Ice Age were to repeat today, we might not come out of it. And if we do, and if it happens again 200 years from now, we would stand an even better chance of not coming out of it as the orbit will be even more favorable to glaciation than it is now.
The answer to some of the questions upthread with regard to the settling of the DYE-2 station can be found here [scroll down to the second to last graphic: “Table 1”].
Yeah, I’ve mentioned this here before (been a while). Good thing all that ice melted…
Y2K wasn’t a complete delusion, there was some risk. It was, however, blown WAY WAY WAY out of proportion.
Good thing temps aren’t really rising then, ain’t it.
The Ice in Greenland is Growing
It must be due to the increased concentration of atmospheric CO2. “Green” things thrive on CO2.
Ivins and his colleagues are refining the computer models used to understand and predict post-glacial rebound. It turns out that beneath the ice sheet covering Greenland, the mantle isn’t changing the shape of the “bathtub” very fast. “This tells us that the large mass changes Grace detects in the southeastern region of Greenland aren’t due to post-glacial rebound,” says Ivins.
Any bets on whether we will ever see published reports thoroughly explaining the alledged “refinements”.
Roger (10:43:27) :
Let me get this straight – The ice and snow melt – -the sea rises – but nothing gets flooded because the land rises along with the sea. Where’s the problem?
Unless you happen to live on certain south sea islands…some of which seem to be sinking…..in which case you go to the UN and demand: LOTS of money! or Lots of landfill……[sarc off] cdl
RE: Alan the Brit
“I have a suspicion that we are in free-fall over climate. We observe a change in something, being simple bead wearing stick waving humans we have to attribute it to the gods being angry at us, so we have to appease them! Why can’t think about these changes & conclude that they are simply things we haven’t noticed before, not that we’ve caused them to happen.”
and…”The whole thing becomes a whirling mass of self-supporting & justifying for existence rather than pure research & science.”
I am just a retired health/sports educator, but your statements have summed it all up very eloquently! It’s great to see the “true scientists” putting out organized challenges to this madness!
Jack Simmons (21:06:25) :
Sometime in the future, and I don’t think it will be decades, people will simply laugh at this silliness.
Or curse us for wasting valuable resources, depends how far the AGW scam and associated socio-political changes progress.
Alan the Brit (04:21:38) :
…
I have a suspicion that we are in free-fall over climate. We observe a change in something, being simple bead wearing stick waving humans we have to attribute it to the gods being angry at us, so we have to appease them! Why can’t think about these changes & conclude that they are simply things we haven’t noticed before, not that we’ve caused them to happen.
IMHO The underlying problem is “Fear of Powerlessness and Insignificance”.
Like this. “Change Occurs” -> “(Assume) We are the Agency Responsible” -> “Avoid experience of powerlessness and insignificance in the face of change”.
For any human being – the distinction between what is subject to control and what is not, is a key boundary and directly tied to the instinct for survival.
Because what is uncontrollable may kill you.
End IMHO
c) Gulf Stream acceleration.
d) Increased density of water due to oxygen isotope changes.
e) Wegener’s grave.
f) Boston Celtics wins.
g) Polar bear population increase.
Is the behaviour of Greenland glaciers understood well enough to trust an attribution of a change? There still seem to be many new things being discovered about glacier behaviour.
The presidents of the Maldives have been asking the UN for money due to global warming causing rising sea levels (the UNFCCC and Kyoto Protocol require rich countries to pay). But the sea level in the Maldives went down, not up. Such details are ignored.
Craig D. Lattig
“Unless you happen to live on certain south sea islands…some of which seem to be sinking…..in which case you go to the UN and demand: LOTS of money! or Lots of landfill……[sarc off] cdl”
Is Venice, Italy eligible?
TonyB, the Brit, thanks also for the excellent links, and with Alan the Brit, that makes three of us. Vineyards in Yorkshire Alan? Got a link? I visited an old Roman vineyard in Shropshire on one of my recent travels. I must put the Yorkshire site on my list.
With respect to the San Francisco Bay, the only major alarm would seem to be the ugliness associated with a potential moratorium on completing the new Bay Bridge segment, the California budget not being too healthy these days.
Fighting carbon dioxide’s an expensive proposition ya know.
If it is warming then why this?
http://www.piercecountyherald.com/articles/index.cfm?id=18723§ion=homepage
have a warm 1st
PhilinCalifornia,
I live in SF so had found this reference previously:
http://www.bcdc.ca.gov/pdf/planning/cc_slr_rpt_1988.pdf
It gives details on land subsidence and average sea level rise.
Here is a page where you can access tide gauge data:
http://tidesandcurrents.noaa.gov/station_retrieve.shtml?
type=Historic+Tide+Data
Here is SF’s oldest Gauge site:
http://oceanservice.noaa.gov/topics/navops/ports/supp_sanfran_tidegage.html
I live at the ocean end of GG Park, basically sea level. Can’t say that I’ve noticed a difference. If 100 years means .39 ft, I can’t get excited.
Of course, I recommend NILS-AXEL MÖRNER’s research for sea level. (Yahoo his name. You will find lots of interest)
Here are a couple selections:
http://www.21stcenturysciencetech.com/Articles%202007/MornerInterview.pdf
http://gsa.confex.com/gsa/inqu/finalprogram/abstract_54461.htm
Don’t forget, in tidal areas and tributaries that you can have sediment deposits actually RAISING the land. This may be happening in your area. They have to dredge the channels to keep them open for shipping here also.
http://www.spn.usace.army.mil/bmvc/student/dredging/what_is_it.html
aw crap… someone already mentioned Venice.
Venice, Verdi, drowning.
Hey kuhnkat,
Moshpit and I live in SOMA. We should get together for a beer sometime.
However, I leave for Brazil in a week, and Mosh is always on the road for work–maybe in February when I get back.
Increased melting at lower elevations and increased snow accumulation at higher levels is expected in the early stages of global warming. The IPCC and climate/glaciological scientists have know this for a long time with a litany of papers.
The most recent years have been exceptionally warm in the Arctic http://data.giss.nasa.gov/work/modelEt/time_series/work/tmp.4_observLOTI_12_1880_2010_1951_1980-0/map.gif with record melt (http://www.sciencedaily.com/releases/2007/09/070925160630.htm or EOS Sept 25, 2007 if you want the science paper). The study which triggered this thread is three years old and the data five years old.
David,
In 2007 the ice didn’t melt in the Arctic. It was blown out into the Atlantic where it met warm southern currents and melted. 2007 was an odd year due to an anomalous wind pattern. 2008 *should* have fared worse than 2007 if the melting was due to sea temperature or air temperature as we went in to 2008 with a record low amount of old ice. New ice melts faster because it has a higher salt content. 2008 finished with more ice than 2007. And 2009 will, I believe finish with more than 2008 did because we will go into the 2009 melt season with more old ice than we had in 2008.
The ice didn’t “melt” in 2007, it was blown out of the arctic by wind.
Take a look at the global sea ice anomaly chart on Cryosphere Today. 2008 has had more time with less anomaly than any year since 2003. Sea ice is recovering.
Jeff Alberts,
I have worked on computers since the base level mainframes in the Air Force in 1972. I assisted programmers who originated code similar to what raised issues for Y2K. Over the years I worked for Radiation Chemistry in Menlo Park and a couple of Financial Institutions along with a large Law Firm. In 1996 I went to work for Charles Schwab supporting programmers. I do not know what your background is, BUT, the financial field would have been an unmitigated disaster without the huge efforts we put in cleaning up volumes of legacy code. Virtually all of these companies used mainframes or Unix based systems that used that old legacy code.
Unlike Global Warming, Y2K was a somewhat well handled potential disaster. Global Warming has been a mismanaged MYTH!! Because so much work was put into PREVENTING the potential Y2K disaster does not in any way mean that it would not have been one if ignored.
selamat tahun baru 2009M
jeez,
my e-mail is with YAHOO. Just add my nickname.
David,
apparently you have missed the research that has found the “galloping glaciers” have all slowed from their galloping max, some back to “normal”. You have also missed the research that found little correlation with meltwater adding to the speed of glaciers or the study that decided the galloping glacier on the north eastern end of Greenland was probably caused by vulcanism. Check out the 1979 thru 2008 Cryosphere pictures of Greenland. It shows beautiful “wakes” where apparently warmer water is keeping the sea ice melted with a termination at the glacier area.
http://igloo.atmos.uiuc.edu/cgi-bin/test/print.sh?fm=07&fd=30&fy=1979&sm=07&sd=30&sy=2008
Maybe it is just warm water from regular currents, but, it sure looks to originate from the glacier area.
I just don’t understand warmers. Iceland is one of the most active areas in the world. A string of volcanoes which have erupted in the last thirty years were found under the arctic ocean. Greenland has other areas of volcanism besides under this particular glacier, yet, you think all melting is due to increased AIR and WATER temps based on GG feedbacks. What about all the carbon and other dark aerosols that increase melt on glaciers worldwide. Now THAT is anthropogenic ice melt.
For that matter, based on reports from NASA, most of the “melt” of the arctic ice happens by winds BLOWING the ice into currents that take it out of the arctic where it melts!!!! Doesn’t take elevated temps for that to happen and the decreased albedo can raise the temps.
NASA reported early this year that the wind patterns had changed back to premelt patterns. May be why all that new ise didn’t all “melt” this summer!!
It wasn’t blown where it could!!
Basically, theory is all fine and good until actual observations show that what you THOUGHT was happening ISN’T!!
Oh, by the way, you said:
“Increased melting at lower elevations and increased snow accumulation at higher levels is expected in the early stages of global warming.”
That is also normal weather variation!!!
Basically you can not point to ANYTHING that isn’t within normal weather variation, just like I can’t point to ANYTHING that isn’t “CONSISTENT” with the models!!!
HAHAHAHAHAHAHAHAHAHAHAHAHAHAHAHA
Crosspatch, maybe the Canadians and Alaskans need to emulate Russia:
http://www.worldnetdaily.com/news/article.asp?ARTICLE_ID=17518
those underground cities may not be JUST for nuclear war survivability. They are apparently still using and expanding them at enormous costs. Makes me wonder whether they are fully self supporting yet?!?!?!
kuhnkat (22:13:46) :
Add to your observation the 30 day animation from
http://arctic.atmos.uiuc.edu/cryosphere/ where the amoeba of ice recoils off Iceland at some point
and the anomaly plot loop from
(http://weather.unisys.com/archive/sst/)
http://weather.unisys.com/archive/sst/sst_anom_loop.gif
where one sees an isolated hot spot appearing between iceland and greenland and the volcanic activity view is on the table.
The only way I could mathematically see a hots pot developing between the islands from a storm front would be if a type of focusing around iceland were possible, lower temperatures coming from right and left and adding up in the middle.
“RAPID MELTING OF THE GREENLAND AND ANTARCTIC ICE SHEETS IS IMPOSSIBLE!”
I can across this article by Kurzmeldungen Klima.
http://hallolinden-db.de/baseportal?htx=/hallolinden-db.de/Klima/Klima&cmd=list&range=0,100&Datum==*&cmd=all&Id
I hope works
The link didn’t work.
Title THE GREENLAND-ANTARCTICA MELTING PROBLEM DOES NOT EXIST
date 01.11.07
click on link. go to page 901and scroll down to 01.11.07
New link
http//hallolinden-db.de/baseportal?htx=/hallolinden-db.de/Klima&cmd=list&range=900,100&Datum==*&cmd=
again, I hope it works
Graeme Rodaughan (15:29:02):
IMHO The underlying problem is “Fear of Powerlessness and Insignificance”.
I agree totally, and the fear is understandable. But it is the response of many current “Environmentalists” which is indeed pathological: to necessarily involve the rest of us in their grand neurotic schemes of personal salvation, also in spite of the deleterious side-effects of those schemes. Imo, from one point of view they seem to have externalized what would otherwise be only a personal obsessive-compulsive disorder based upon an otherwise understandable fear, such that everyone else simply must be incorporated into it, quasi-religiously – or else!
Thanks kuhnkat. Again, excellent reading. The table showing vertical land motion is striking, especially for Sausalito. Also, after reading the dredging link, and seeing how much sediment enters the Bay each year, it’s not difficult for me to believe that my eyeballing of the wading bird habitat is indeed correct. Either vertical uplift of the East Bay shoreline, or added sediment into the mudflats, coupled with low single digit inches in sea level rise over the past 20 years tells me my eyes and memory were not deceiving me.
This ecosystem could be the poster child for “act locally, think globally”, i.e. fix any natural climate change issue of the ecosysytem by fixing it, as opposed to participating in a bogus movement that will fail to legislate against some insignificant molecules floating around above it.
Old construction worker
Hopefully this link goes direct to the page. It is an interesting article and worth reading.
tonyb
http://hallolinden-db.de/baseportal?htx=/hallolinden-db.de/Klima/Klima&cmd=list&range=900,100&Datum==*&cmd=all&Id=1680
Philincalifornia
Consider going up the hill from where you are to the Lawrence Hall of Science, just above UC Berkeley. They have a computer console display of the sea level changes in the vicinity of San Francisco over the last 10,000 years. You’ll note that 10,000 years ago the shoreline was out where the Farralon Islands are today. There was no SF Bay. Since about then the sea level rose about 120 meters and stabilized about 7,000 years ago. 7,000 years ago marks the beginning of the urbanic civilizations we know of today. Before then the sea level rise was too great for coastal urban areas to develop. There hasn’t been much sea level variation since then even though we’ve had major periods of warmth as well as cold.
Hi. I am actually trying to reach the main blogger but I am not smart enough to figure out how. I would be grateful if you forwarded.
I am a skeptic with an open mind. I live in California. I would like to find out how to distinguish between alleged global warming, caused in part by human activities and the periodic La Nina, which much predates the industrial revolution and cars.
Thank you.
jdelacroixliberty@gmail.com
jacquesdelacroixliberty.wordpress.com
TonyB
Thanks for the help. The link only goes to the index page. You still need the scroll down to the title (THE GREENLAND-ANTARCTICA MELTING PROBLEM DOES NOT EXIST) and open article.
STEPHEN H. SCHNEIDER seems not to agree:
An interesting quote from Steven H. Schneider:
May I translate? Thank you:
“Lying is an appropriate tactic to further the AGW agenda.”
This article does not help the growing resistance against “the climate crises folk.” It is too easy to challenge. Please be careful what you write so as to not discredit the cause.
There’s an interesting pdf (the link is on the page) on Greenland’s history during the last interglacial (Eemian):
http://www.agu.org/pubs/sample_articles/cr/2001JB001731/index.html
Their studies suggest Greenland’s icecap was less than half the volume then as today.
Old construction worker
You are right-still it is a good article so I hope people will take the trouble to open the link
TonyB
WW II Aircraft lost on Greenland
The two most notable aircraft losses on Greenland back in the 1940’s were
1)the B-17/P-38 flight which crashed in 1942 in southeast Greenland 17 miles from the coast (google P-38 Glacier Girl) later found buried and recovered piece by piece from over 260 ft of ice and…
2) B-29 ‘Kee Bird’ that went down in 1947 in NW Greenland north of Thule. This aircraft was found in the 1990s and was still at the ‘surface’ with little snow around it. Darryl Geenamyer and a crew attempted to resore the B-29 on site and fly it out. When they were taxying the plane on the ice, after the restoration, while bumping over some snow drifts, a running APU (Auxilliary Power Unit) in the tail broke lose, caught fire and wound up destroying the plane on the ice 🙁
Question – with two separate events happening at around the same time (1940s) yet later found at around the same time (1990s) in very different circumstances (P-38 in deep ice, B-29 at surface)…why???
Reguards,
Jeff K
Carlo (03:58:21) :
Greenland appears to be floating upwards – its landmass is rising up to 4 centimetres each year, scientists reveal.
And the large country’s new-found buoyancy is a symptom of Greenland’s shrinking ice cap, they add.
How can they possibly know the cause? They have perfect knowledge of the plate tectonics under Greenland?
They have also found that the rate of rise has dramatically accelerated in recent years
Anyone who thinks they can determine a trend in a geologic time scale event from a few years data is is is … words escape me. Certainly not a very good mathematician and a worse geologist. I live in shaky California and things move a lot, then don’t, then sometimes a whole lot, then nothing. Yellowstone breaths in and out. The lake tilts, then doesn’t. And they think that they can attribute causality from a few years movement?
Smokey,
I came up with a different translation, to wit:
I am a lying scumbag, and I believe that every other “scientist” should lie through his/her teeth even if they have reasonable doubts.
Mike
philincalifornia (10:09:43) :
http://www.bcdc.ca.gov/planning/climate_change/SLR_strategy.pdf
These people, who appear to be looking at practical approaches to conservation of the Bay (as opposed to the carbon swearbox approach) quote a rise in the Bay water levels of 7 inches between 1900 and 2000.
Which really is meaningless. At the same time, the actual bay has shrunk due to dumping fill in some areas and natural deposition in others. Alviso was a seaport where ships were built for WWII. It is now substantially landlocked. The sports docks have turned from occupied (about 25 years ago when I was looking for a place to put my boat) to now being a reed filled marshy mud flat. Shortly it will be dry land. One can no longer launch a boat from the ramp due to the dirt & mud making it hard to row…
(Alviso is the very southern most tip of the S.F. bay)
Where did all that bay rise go? Swallowed by the earth rise I guess …
My boat was great for the bay. It was a 27′ motor sailer with about 27 inches of draft! Skidded sideways like crazy on a tack, but it was great fun to sale outside the channels around folks stuck in the mud with their fin keels. Much of SF and San Pablo (the north 1/2 of “SF bay”) bays are very shallow. Mostly under 10 feet, often under 3 feet. SF bay is really just a fat river with a very shallow flood plane on each side. The biggest risk to SF bay is not water rise, it’s the sedimentation turning it into a river…
crosspatch (11:42:38) :
[… whole bunch of stuff I agree with]
But overall, glacial periods are becoming longer. The “normal” state of the system is glaciation with “interglacial” warm periods a temporary state.
While that has been true for most of this ice epoch, there is an argument to be made that we are exiting the ice epoch and glaciation will start to reduce. Please see the page at: http://www.sciencebits.com/ice-ages
About 1/2 way down is a chart with our position relative to the spiral arms of the galaxy over time and ice epochs over time. All of our recent glaciations have been in the last (left most) ice epoch. Notice the tight correlation of epochs with arm transits? Milankovitch cycles determine the entrance and exit from glaciations inside an epoch, but the ice epochs are a larger cycle driven by arm transits. We are probably as bad as it gets for cold in this epoch (or close to it) in either the last or next glaciation.
The good news is that we’ve just exited a spiral arm and ought to be heading toward warmer times. The bad news is that ice epochs lag the arm transit and all this is measured in 100s of millions of years; so we could be ‘right on the top’ of the present ice epoch (more glaciations to come but milder) or could have a bit more increase in the strength of the next glaciation or two before we are on the downhill side. (What’s .1 or .2 million years on a 10 million per tick graph 😉 Basically, we need more understanding of this process and a finer grained chart to get some kind of clue what happens next (in a few hundred thousand years).
bedrock in Northern Canada that will be under a mile of ice for 100,000 years starting at some point in the not too distant future.
Interesting idea, but ‘not too distant’ could be 10,000 years. Waste is 1/2 decayed by then and 10 civilizations will have come and gone.
My favorite disposal idea is vitrified canisters deposited in a subduction zone. Comes back a long time later after a near mantel experience diluted with magma… Don’t know how hard it would be to drill a hole into 5 miles of ocean and seabed sediment to place the canisters, though 😉
But I’d really rather not treat fuel rods as ‘waste’. Most of the energy value is still in them. Send the used wash cloths and bunny suits, the coolant pumps and other low level wastes to storage, but turn those fuel rods into new fuel.
And since the switch to glaciation appears to happen quite rapidly we need to have at least some idea of what we are going to do to help our citizens in Alaska and our neighbors in Canada when climate shifts suddenly and their land becomes uninhabitable.
They can join us in Mexifornia and Texico … Seriously, I’d expect the southern US to become part of Mexico as everyone huddles up close and heads for warmth. If an ice age happens, the chaos will make our present idea of “countries” a quaint memory. Then again, in a hundred years we will all be speaking Spanglish anyway and having tacos with our tea & scones.
(My BF as a kid was a Mexican neighbor. I grew up eating tacos at his home and he drinks tea with his pinky out thanks to meals at my home. Yeah, I guess I started it all… ;-0 and we both speak both languages.)
The nice thing is that while the entry is somewhat abrupt, the slope is spread over a long time to the bottom, so we’ve got a few thousand years before it gets really really bad. See
http://en.wikipedia.org/wiki/File:Ice_Age_Temperature.png
Notice how the ice volume builds over about 100,000 years? It takes 1,000 years just to get started. Lets just say I’m not worried about an ice sheet in my or my grandkids lifetimes. Cold, yes, ice, no.
As we are entering a period of orbital shape that is increasingly favorable to glaciation, it might take only one deep solar minimum to trigger the switch.
It looks to me like a stochastic resonance problem. There is just a lot of slop in the exact entrances and exits. It’s not just a solar minimum, it’s also rock falls from space and volcanos and continental drift and ocean currents that could trigger an entrance.
We do know that we’re likely near the end of this interglacial. We just don’t know if the start of the next glaciation is 20,000 years in the future or if it already started 500 years ago and the present is a last gasp counter oscillation on the way down. It could also be that the GHG theory is ‘spot on’ and it is the only thing keeping the ice age away (in which case, please keep burning that coal !!!)
If the Little Ice Age were to repeat today, we might not come out of it. And if we do, and if it happens again 200 years from now, we would stand an even better chance of not coming out of it as the orbit will be even more favorable to glaciation than it is now.
Yup. Unfortunately, there is a great range of possible start dates.
http://en.wikipedia.org/wiki/Milankovitch_cycles
gives a decent treatment. Notice way down at the bottom they site two sources for ‘where we are now’. One saying cooling started 6k years ago, another saying we’ve got about 50,000 years of no worries.
So many words to say “we don’t know.” Sigh.
The good news is that it’s all in geologic time. The next glacial period could have begun in 1500 A.D. and we’ll find out for sure in about 3000 A.D. Yes, it’s that slow, and with 1500 year climate cycles built on top of it.
So I wouldn’t worry about it. Even if the next glaciation already started, it will take 10 lifetimes to become ‘an issue’. That is ‘quite rapidly’ in geologic time…
“” Jeff K (13:04:44) :
WW II Aircraft lost on Greenland
The two most notable aircraft losses on Greenland back in the 1940’s were
1)the B-17/P-38 flight which crashed in 1942 in southeast Greenland 17 miles from the coast (google P-38 Glacier Girl) later found buried and recovered piece by piece from over 260 ft of ice and… “”
Jeff; I had forgotten that illfated Darryl Greenameyer B-29 project. Airplane buffs (me included) were totally stunned by that very sad loss.
But your point ois very important.
A criticism often levelled at the “lost squadron” event was the suggestion that the planes simply sank into the ice. Remember the high school science experiment where a wire cuts its way through an ice cube as a result of the pressure under the wire raising the melting point. The ice melts under the wire, and the water flows around the wire and refreezes.
So they aregued that over sixty years the planes cut their way down.
Well Greenameyer;s B-29 nproves that the planes didn’t cut through the ice. The B-29, was actually on a forzen lake I believe to it wouldn’t have to cut very far to end up in the water.
In fact if the B-17s and P-38s had sunk into the ice, they very soon would have been buoyant, and the pressure wouldn’t be anywhere near high enough to cause melting. Also the ambient temperature was likely way to cold to permit melting at any achievable pressure.
So those planes were buried in snow, which slowly compacted. Now one atmospher pressure of water is 34 feet, so 262 feet would be 7.7 atmospheres if it was water; but ice is less dense so solid ice would be a bit mode than 8 atmospheres; but then again the average compaction of that much snow would tend to be lower density.
In any cae, 8 atmospheres of external pressure would not necessarily crush the planes too much. Some of them actually contained some ice inside through broken windows; but in any case the net pressure wouldn’t be high enough to cause melting of the ice; so they didn’t sink; they were buried; and with much more than 262 feet of total snow accumulation. It was 262 feet of compacted snow/ice.
Evidently the location of that squadron, was further south, where ther was plenty of precipitation, as compared to further north, where colder temperatures prevent high levels of precipitation.
The ice at the north pole simply isn’t very thick; remember a nucllear submarine surface through the ice at the north pole.
So Jeff, I think you just hit the Jackpot; it all makes sense to me.
Growing ice fields and glacier ice won’t be very fast in more northely drier atmospheres; so the 2 inches per year ice gain; is not inconsistent with 262 feet of precipitation in a more southerly location.