A Guest Post By Steve Goddard
In my most recent article in The Register, and also posted here on WUWT, I incorrectly speculated that NSIDC graphs appeared to show less growth in Arctic ice extent than had actually occurred. My calculations were based on counting ice pixels from Cryosphere Today maps. Since then, I have had further discussions with Dr. Walt Meier at NSIDC and William Chapman at Cryosphere Today, to try to understand the source of the problem. Dr. Meier has confirmed that counting pixels provides a “good rough estimate” and that NSIDC teaches pixel counting to CU students as a way to estimate ice extent. William Chapman has confirmed that the projection used in CT maps is very close to what it appears and to what I had assumed it to be. It is an astronaut’s view from about 5,000 miles above the north pole.
What I have learned
In 2008, CT and NSIDC maps show excellent agreement – as can be seen in this video which overlays an August 14 NSIDC map on top of the August 14 CT map. The borders of ice extent are nearly identical in the two maps. (The videos show overlays of the two maps.)
The discrepancy occurred in August, 2007, when agreement between NSIDC and CT was not so good. The equivalent video from August 15, 2007 shows that the CT map was missing a significant amount of low concentration ice on the Canada/Alaska side. I have since confirmed from AMSR maps and NASA satellite photos that the NSIDC map is probably more accurate than the CT map.
The reason that CT provides their side-by-side image viewer is apparently to encourage visitors to make a visual comparison of two dates, which is exactly what myself and others here did when we observed the discrepancy vs. NSIDC graphs. The human brain is quite good at making estimates of relative areas from images, and pixel counting is nothing more than a way to quantify what has already been observed. Since writing The Register piece I have made adjustments to the CT pixel counts for map distortion, and as I expected that makes the discrepancy slightly larger.
Because CT maps showed less ice in 2007, the increase in 2008 ice extent appears to be much greater. There is little doubt now that the NSIDC reported ice growth is absolutely correct. But wasn’t the ice supposed to shrink this year due to an excess of “thin first-year ice?” In May, NSIDC’s mean forecast (based on previous year’s melt) was that Arctic ice extent would be 13% lower than last year. (NSIDC has more recently posted on their web site some reasons why they believe the May estimates didn’t work out.)

Click for a larger image

Click for a larger image
Secondly, while Arctic ice is well below the 30 year mean, it is above expectations and nowhere near gone. NSIDC graphs show Arctic ice extent at greater than 70% of normal – hardly a six sigma event. As of August 1, NSIDC was even considering a possible return to normal extent this summer. If not for a few weeks of stormy Siberian weather, the map (and story) would be quite different today.


Click for a larger image
Is it possible that the 30 year satellite record coincidentally represents only one leg of a waveform? Greenland temperature records would hint at that. If you examine only one leg of a waveform, you will absolutely come to the wrong conclusion about the long term behaviour – just as some did during the 1970s ice age panic.

Click for a larger image – original source image from NASA GISS
Is there cause for concern? Perhaps. But unfortunately much of the press coverage has been little more than science fiction so far. How do we separate the science from the fiction? Dr. Meier has graciously agreed to answer that question (and others) in my next article.
One thing we can state with a degree of certainty, is that there likely will be more multi-year ice in 2009 than there was in 2008. This is because the 2008 melt season is ending with more ice area than 2007. Barring asteroid impact, after the winter freeze there will be (by definition) more multi-year ice than what we started with this year. Any ice which survives the summer will be classified as multi-year ice in 2009. If next year is cool like this year, is it unreasonable to hypothesise that ice extent will again increase? Or are we on a non-linear trend which will lead to ice-free summers and a collapsing Greenland ice sheet? Hopefully Dr. Meier can help sort this out for us.
I may have missed it in the previous thread but did we ever get an explanation as to why the earlier CT images were dramatically different to the NSIDC images but the later ones match fairly well
For the first time in human history, the North Pole can be circumnavigated.
http://www.independent.co.uk/environment/climate-change/for-the-first-time-in-human-history-the-north-pole-can-be-circumnavigated-913924.html
True or not?
REPLY: You might want to qualify that, human history goes back hundreds to thousands B.C. And I don’t think such navigation attempts were made or recorded then.
Anthony – while you are reporting a growth of Arctic ice in 2008, other sources continue a ceaseless drone of doom. Note the article here: http://blog.wired.com/wiredscience/2008/08/arctic-ice-on-t.html. Could someone qualified to rebut this well offer one? For my part I notice a strong dependency on “models” for the scare material provided here as opposed to more thorough discussion of empirical data, and a sleight-of-hand in changing the subject to methane.
REPLY: I suppose we are the “glass half full” optimists here.
Steve, checking the historical records of the NSIDC is difficult because in January and May 2007, they restated all the historical data (which included revising the Maps on CT). No explanation of the changes was ever provided.
This Before and After animation of Northern Hemisphere Sea Ice Anomaly from CT captured through the Wayback Machine illustrates the point very clearly (shocking that is.)
http://img401.imageshack.us/img401/2918/anomalykm3.gif
Couple of points.
I don’t understand the End of Summer minimum ice extent graph as the bar chart doesn’t seem to relate to either of the axis nor the predicyion.
Second – is the fact that the latest NIDC graph http://nsidc.org/data/seaice_index/images/daily_images/N_timeseries.png seems to show a flattening of the melt rate of any significance
Jimmy here is a sampling of a few of the most recent studies and posts that should easily refute such stories. – Anthony
1) July 25, 2008 – M.I.T. Scientists: Warming Will Actually Reduce Number of Hurricanes
American Meteorological Society report contradicts claim tropical activity increases due to climate change. http://www.businessandmedia.org/articles/2008/20080725183719.aspx
2) Recent U.S. Senate report featured latest science on Hurricane and climate link. See full report here:
http://epw.senate.gov/public/index.cfm?FuseAction=Minority.Blogs&ContentRecord_id=37AE6E96-802A-23AD-4C8A-EDF6D8150789
3) Prominent hurricane expert Kerry Emanuel reconsiders global warming’s impact http://www.chron.com/disp/story.mpl/tech/news/5693436.html
Scientist refutes his own theory, finds warming does not increase hurricanes – Excerpt: Emanuel was not disappointed that the research seemed to undercut his old results. “One gets used to being mistaken, and we follow the evidence and sometimes the evidence is contradictory and then we have to sort it out.”
http://www.canada.com/montrealgazette/news/story.html?id=909e4b84-eb40-4088-950e-e7ed8200e880
4) ) Another hurricane expert reconsiders view: Study says global warming not worsening hurricanes Meteorologist Tom Knutson: http://wattsupwiththat.wordpress.com/2008/05/19/hurricanes-to-global-warming-link-blown-away
Excerpt: What makes this study different is Knutson, a meteorologist with the National Oceanic and Atmospheric Administration’s fluid dynamics lab in Princeton, N.J. He has warned about the harmful effects of climate change and has even complained in the past about being censored by the Bush administration on past studies on the dangers of global warming. He said his new study, based on a computer model, argues “against the notion that we’ve already seen a really dramatic increase in Atlantic hurricane activity resulting from greenhouse warming.”
5) Other scientists like Hurricane expert Dr. Bill Gray and Dr. Chris Landsea have steadfastly refuted the alleged warming hurricane link. See:
http://www.bestandworst.com/v/112507.htm
and also
http://www.chron.com/disp/story.mpl/metropolitan/5789245.html
Excerpt: By suggesting a marked decrease in activity, the new work bolsters the views of Chris Landsea, science and operations officer at the National Hurricane Center, who has argued that the apparent recent increase in Atlantic storm counts is due solely to better observational tools — satellites and the like — which blanket coverage of the Atlantic hurricane basin. “After taking into account the changes in monitoring, the number of storms we’re seeing now is on par with previous busy periods in the Atlantic,” Landsea said.
6) A recent issue of Journal of Climate showing there is little or no evidence of an increase in hurricane numbers or intensity. Paper Excerpt: Little evidence was found that mean individual storm intensity has changed through time, but it is noted that the variability of intensity has certainly increased. Any increase in cumulative yearly storm intensity and potential destructiveness is therefore due to the increasing number of storms and not due to any increase in the intensity of individual storms.
Full study here:
http://ams.allenpress.com/perlserv/?request=get-abstract&doi=10.1175%2F2007JCLI1871.1
The paper was authored by Climate statistician Dr. William M. Briggs, who specializes in the statistics of forecast evaluation, serves on the American Meteorological Society’s Probability and Statistics Committee and is an Associate Editor of Monthly Weather Review.
In addition, extreme weather and global warming have been refuted as well.
1) Climatologist dismisses extreme weather predictions due to man-made warming as ‘complete nonsense’ – By Hydro-climatologist Stewart Franks, an Associate Professor of Environmental Engineering at the University of Newcastle in Australia.
http://www.theaustralian.news.com.au/story/0,25197,23979327-5017586,00.html
2) Another scientist dismisses fearmongers: Midwest Floods and ‘Completely Unjustified’ Climate Change Fear Mongering – June 22, 2008 – By Mike Smith is a certified consulting meteorologist and a Fellow of the American Meteorological Society He is CEO of WeatherData Services, Inc., based in Wichita.)
http://wattsupwiththat.wordpress.com/2008/06/22/midwest-floods-and-unjustified-climate-change-fears )
3) U.S. Climate Change Science Program (CCSP) report shows Hurricanes declining, NO increases in drought, tornados, thunderstorms, heat-waves – June 20, 2008 –
http://canadafreepress.com/index.php/article/3588
4) Going Down: Death Rates Due to Extreme Weather Events
http://wattsupwiththat.wordpress.com/2008/07/05/going-down-death-rates-due-to-extreme-weather-events
http://edition.cnn.com/video/#/video/tech/2008/08/29/smith.arctic.kayaking.itn
Jimmy,
I don’t think there is any question that Arctic ice has increased vs. last year. All the data sources agree.
http://www.ijis.iarc.uaf.edu/seaice/extent/AMSRE_Sea_Ice_Extent.png
NSIDC is actually showing a flat extend trend, as of a few days ago. We could potentially be seeing 15-25% growth (relative to last year) by mid-September.
http://nsidc.org/data/seaice_index/images/daily_images/N_timeseries.png
The UK Independent is the same paper which speculated earlier this summer on an ice free North Pole “for the first time in human history.” They seem to like that term.
Today’s NSIDC map shows no route across either the Northwest or Northeast Passage.
http://nsidc.org/data/seaice_index/images/daily_images/N_daily_extent_hires.png
Not sure how one would circumnavigate the Arctic, when both sides are frozen up.
Anthony,
Just a thought, but have you considering making some sort of “AGW FAQ” with sections like the comment you posted here? Sometimes it’s hard to find the original sources after awhile or while you’re in a discussion with someone that’s never looked at the “other side” of the AGW story. There are a wide variety of claims about the effects of “man-made climate change” and it can be difficult to keep up with the “flavor of the day” and all the relevant material.
REPLY: Sure I’ll add it to my already bone-crushing workload 😉
Pierre Gosselin (10:23:59) :
http://edition.cnn.com/video/#/video/tech/2008/08/29/smith.arctic.kayaking.itn
Observe you can see land in the background. That means it was recorded at Svalbard (78N)
“But it is the simultaneous opening – for the first time in at least 125,000 years – of the North-west passage around Canada and the North-east passage around Russia that promises to deliver much the greatest shock. Until recently both had been blocked by ice since the beginning of the last Ice Age.”
How can The Independent make such a statement? How do they know that those passages were not open during the MWP and the Holocene Optimum?
Easy. They just “pucker their lips and blow”.
Just a thought, but have you considering making some sort of “AGW FAQ” with sections like the comment you posted here?
There is a RESOURCES section that has a lot of sources on a variety of climate topics. Look at the very top of the page.
[…] is a graph of all time arctic temperatures taken from Watts Up With that HERE. It shows the entire HISTORY of arctic ice measurement. So the longest in HISTORY isn’t too […]
Here are a few sat pictures of Svalbard and Spitsbergen Island from today.
Mr. Pugh will not get very far before running into the pack ice. The pack ice is right up against Spitsbergen on the northeast side of the island and only 50 miles away on the northwest side.
(Is he going to sleep in the kayak? Probably just another propand-photo-op.)
http://rapidfire.sci.gsfc.nasa.gov/realtime/single.php?2008244/crefl1_367.A2008244144501-2008244145001.4km.jpg
The 250M resolution visible sat picture, however, shows the ice is pretty broken up and one could just keep going in a kayak.
http://rapidfire.sci.gsfc.nasa.gov/realtime/single.php?2008244/crefl1_143.A2008244144501-2008244145001.250m.jpg
Steven Goddard writes: – Not sure how one would circumnavigate the Arctic, when both sides are frozen up
Well…
http://www.iup.physik.uni-bremen.de:8084/amsr/NorthWestPassage_visual.png
http://www.iup.physik.uni-bremen.de:8084/amsr/NorthWestPassage_visual.png
http://www.iup.physik.uni-bremen.de:8084/amsr/NorthWestPassage_visual.png
Do you call that frozen up?
The map at NSIDC(and you should know this) shows anything with more than 15% ice as white. Slush will appear as white there, but you wouldn’t have any problem navigating through it…
MV Polarstern has just gone through NW passage. You can read report here:
http://www.awi.de/en/infrastructure/ships/polarstern/weekly_reports/all_expeditions/ark_xxiii/ark_xxiii3/24_august_2008/
And they’re headed for the NE passage later
And these are the guys that so cheerfully was cited with this: “…this year, there was an exceptional amount of ice -”…remember?
Anthony, thanks for shedding light over this discrepancy of iceextend.
If im not wrong, the MAIN course of this confusion is that Cryosphere maps actually showed too little ice extend? This must have been quite a discrepancy last year?
So last year when we had the big attention to the low arctic ice extend, all pictures on Cryosphere for 2007 showed much too little ice extend?
So last year everybody looked at misleading pictures?
And now this year when its not in favour with low extend 2007, we correct it?
But still Anthony, if you say everything is at it should be, you are properly right. It just not the first time a data set seems to over estimate the effect of global warming, as you may agree.
K.R. Frank Lansner
It appears that the sea ice will finish with a greater extent than last year. Also the multi-year ice will be greater. I don’t think I am the first one to point this out but it appears that the trend is up.
Mike Bryant
Let me get this clear: Greater extent in 2008 than in 2007 which was a record low means “trend is up” according to you?
Have you watched this?:
http://arctic.atmos.uiuc.edu/cryosphere/IMAGES/sea.ice.anomaly.timeseries.jpg
Is that an up-trend?
Or this?:
http://nsidc.org/data/seaice_index/n_plot.html
Is thar an up-trend as well?
Didjeridust ,
Many adventurers have successfully navigated through the Northwest Passage ice over the last 105 years. The crew of the Australian yacht Berrimilla described their harrowing trip through a couple of weeks ago, occasionally getting stuck in ice. It has long been possible to get through or under the ice if one has the ability and inclination to do so. Submarines have been circumnavigating the Arctic for decades.
“Mark Serreze of the National Snow and Ice Data Center in Boulder, Colorado told SPIEGEL ONLINE. “The route that Roald Amundsen navigated in 1903 has been open for the last few days.” ”
http://www.spiegel.de/international/world/0,1518,574815,00.html
“The Northeast Passage (indicated in green on the map), now called the Northern Sea Route, winds from Murmansk on the Kola Peninsula in the west past Petropavlovsk in Kamchatka, Magadan, Vanino, and Nakhodka to Vladivostok on Russia’s Pacific seaboard. Following either of the routes would necessitate navigating through the Arctic Ocean for much of their lengths, dodging icebergs and sea ice floes that threatened to sink or stop a ship dead in its path.”
http://www.wunderground.com/climate/NorthernPassages.asp
Didjeridust,
Do you believe that trends never reverse?
Do you believe that the sea ice will disappear?
Do you believe that sea levels are rising?
Do you believe that there will be eco-refugees all over the world?
Do you believe that Nations will be under water?
Do you believe the UN?
There is more multi-year ice this year than last. I believe it.
The crazy reporting of this non-story made my head want to explode. How can we have crossed the tipping point if there is more ice?
I let the pressure out here-
http://noconsensus.wordpress.com/2008/08/31/arctic-ice-grew-in-2008-agw-what-they-dont-want-you-to-know/
[snip], but the claim that there has been an “increase” is utterly absurd.
we experienced a dramatic loss of ice last year. the second lowest extent on record is NOT a sign of an “increase”.
both passages open. why don t you simply tell us the last year, when this was the case?
Sod
You must understand: More this year than last year is an increase!
Period!
Simple as that!
It’s optimism for … anyone’s sake…
Just see what Watts wrote in a comment further up in this debate:
– “I suppose we are the “glass half full” optimists here.”
Think that says it all…
sod,
If last year was lowest and this year is second lowest, then of course there has been an increase from last year. That is basic primary school mathematics.
The 30 year trend is clearly downward.
Opinions differ as to whether Arctic ice will ever recover from its dramatic shrinkage. Christian Haas is inclined to moderation. “There is still obviously a chance for recovery,” he said, pointing out that last winter was colder than usual. A part of the young ice which froze last winter was even able to survive the summer melting season. But the ice will certainly not soon recover to its 30-year average. “There is too much heat in the water and the atmosphere for that,” he said.
Mark Serreze is still more pessimistic. “An Arctic Ocean that is ice-free in summer is inevitable,” he said. Any recovery made by the ice sheet, he said, wouldn’t last “more than a couple of years in the best case scenario.” By the summer of 2030, he says, the Arctic will be completely ice free for a few weeks at a time.
http://www.spiegel.de/international/world/0,1518,574815,00.html
As a understand AGW models, the first domino stone to fall is the ice cover of the polar sea. The albedo reduction will cause warming in the neighboring continents and cause the permafrost areas to shrink.
Now we have almost ten years of data showing much less ice cover, and consequently, significant albedo reduction should have occured already. Or was that reduction offset by cloud coverage over the open areas. more evaporation, more clouds? Are there indications of a warming trend in Sibiria, northern Canada and Alaska different from the global trend of the last ten years? Do the permafrost areas shrink, and at what speed?
When we have come close to a tipping point, we should see precursor effects.
On 25 Aug the NSIDC graph showed a major downturn in the amount of ice, suggestive that the melt might catch up with last year’s melt in approx 10 days. Since then the rate has moderated so much so that on 30 Aug there was a major upturn shown, suggestive that melt has virtually ceased. A couple more weeks of melt probably remains before we’ll know for sure the verdict on this year’s melt. Then it’s on to the new winter season where we can compare the new refreeze to the last refreeze. The real driver in all this is the amount of warm water entering the Arctic from the Atlantic. Fluctuations in this value have more influence on sea ice melt/refreeze than air temps.
Werner,
As I understand it you are correct. But the IPCC is very politically motivated, supporting scientists who consent above others. It seems possible to me that the ice would be an easy one to hype when things melt during what may still be a normal warming process, this would generate more money.
Certainly the argument about albedo makes sense but so does AGW. It is possible after all. I might suggest that the very high heat content of the water would result in a very small reaction to the albedo and have a minimal impact on ice cover unless it went on for many years. I think that is reasonable also.
We really don’t know these answers so claiming a tipping point has been reached seems irresponsible to me.
sod,
If last year was lowest and this year is second lowest, then of course there has been an increase from last year. That is basic primary school mathematics.
The 30 year trend is clearly downward.
your article and especially your headline give a completely different impression.
will we read another article about this year perhaps being the greatest LOSS of sea ice? (i just eyeballed your graph..)
shouldn t your article have mentioned the la nina event this year?
Taking the last, first:
Leon: You do your own argument a disservice when you overstate your case – there was not a ‘major upturn’; there was a notable reduction in melting, but there is no way you can call it “up”. On top of that, if you’ve been following the charting closely, you’ll notice that oftentimes the day following has a ‘correction’ for the previous day; since this has happened to both increases and decreases, I suspect it’s some kind of smoothing function. Take a chill pill! (hey, maybe it will help reduce melting even more ! 😉
Jeff: Who has suggested we have crossed the ‘tipping point’? And besides, there is still enough variability in weather both above and below the climate trendline, for temporary reversals to occur, even after the tipping point is reached. (In any event, I don’t think we have physically reached it yet)
Mike Bryant: echoing didjeridust, I guess, how can you say with a straight face that 1 year makes a ‘trend’?
Bill Illis: Pugh has a support ship he will sleep on every night… this may be more of a stunt than a ‘significant event’, but he’s not an idiot. And, he’s not actually expecting to get to the North Pole, this year. I suspect he’ll may pulling this off every year until he does, it appears mostly to be more for generating publicity. A good question though would be that, if he does make it into and through fairly significant pack ice, what of the support ship?
Steven Goddard: you say “NSIDC is actually showing a flat extend trend, as of a few days ago”… Really? What graph are you looking at? I see one day of ‘flattening’, yesterday… that is it. You’ve made several more mistakes: 1) One day does not make a ‘trend’; 2) see what tomorrow brings, the next day often ‘corrects’ the previous (probably a smoothing function); 3) ‘Potentially’ ANYTHING could happen… Yes, ‘potentially’ the melt could suddenly stop… ‘potentially’ the world could end (CERN ssc)… ‘potentially’, a new minimum record could be set… but none of those are likely. What is most likely would be a slowly reducing melting trend until sometime between Sep 10 and Sep 30, with a minimum extent of around 5% to 15% above the record last year (approx 30% below the average), so it will still be about 20-25% below the average…
@Jimmy (& Anthony who replied with good ammo for the Wired piece)
I just spent a few minutes looking through the comments to the Wired article in Jimmy’s link. Author Loretta is under quite a barrage of skeptical comments about it already, and people are cheerfully tossing in links to charts and graphs and skeptic blog pieces.
Lately whenever I’ve come across an AGW article in some major-media newspaper or magazine site, the comments sections almost always contain many more skeptical comments than supportive ones.
Formerly just “Dan”, but I got tired of being cowardly. 😉
REPLY: Dan Lee, welcome to the light. – Anthony
Will it refreeze earlier than last year and regrow to the same extent? I believe it will. That means that the overall extent at maximum would be on the upswing again. It’s just a hunch mind you.
As an anecdote that may turn out to be a trend, many counties in Oregon are once again under a weather watch for unseasonably cooler temperatures with frost and freezing possible. All of the old time loggers in the area predict a heavy frost in the valley in just a couple of weeks.
Just watched the ITV news in Uk, our intrepid adventurer Pugh, is shown paddling some “50 miles” on his way to the Pole, but as the camera pans around, he appears to be just a few hundred metres from the shore of Spitzbergen. The reporter points out “he still has some distance to go!” This is the drivel served up to us here in England. How do they get away with it?
JP Rourke,
You win… it’s not a trend. Well, maybe a very, very short trend…
Jeff Rourke,
I measure and track CT concentration maps every day, and read the NCEP predictions every day.
There was a large area of low concentration ice near Wrangell island which dissipated earlier in the month, causing a steep drop in extent. Over the last four days, there has been almost no change in extent, and some new ice seems to be starting to form in the Canadian Archipelago. Temperatures are below 0C in most of the the Arctic Basin. The flat bottom to the graph is real, and it is quite likely that extent will be 15+% above last year by mid-September. One thing I have learned from this exercise is that in 2008, the detailed CT maps and the NSIDC graphs track together in lock step.
One thing people seem to have forgotten is that there was some very warm weather at the pole in September, 2007 which caused extent to continue to drop several weeks longer than normal. This will likely have a big impact on the September extent plots.
Dinjeridust:”Greater extent in 2008 than in 2007 which was a record low ”
Record low for the years 1979 to 2007. Roger Maris had the home run record longer than that!
I wonder what satelite photos of the Artic would look like from 1930 – 1940.
Does a wetter Arctic (less ice, more open water) mean more snow for the NH in the subsequent winter?
I wish i could see the satellite photo for May 18, 1987, when the three US subs surfaced in a watery North Pole. For some reason, Cryosphere Today doesn’t have it. Check the “compare two dates”, maybe you can find it.
[…] Arctic Ice Growth, 2008 – How Much? A Guest Post By Steve Goddard In my most recent article in The Register, and also posted here on WUWT, I incorrectly […] […]
Carlo, welcome to the world of clutching at straws. The fact is, there is more ice this year than last year.
Pierre, I bet we never hear the follow up to that piece o’ ‘ganda.
I have, as wallpaper and screen-savers, a collection of pictures of nuclear submarines at the North pole. Heh, I just like those dive machines in Canadian waters 😛 Here is my favourite:
http://www.john-daly.com/polar/arctic.htm
Page down and there it is.
BTW I think the familly of John Daley should be applauded and celebrated for keeping his site going. It costs money; they do it in honour of him.
The other thing about floating sea ice is that sometimes when it is gone, it did not melt, it just got blown somewhere else. Floating ice has a tendency to stack up at a barrier of some kind when blown consistently in one direction. I’ve noticed that as the melt season progressed, the extent of thick ice grew, indicating that ice was being blown together towards and piling up against Greenland. A measure of the extent of thick ice from year to year may also provide information about how ice extent grows and recedes. Yes? It is possible that seasonal ice was blown into and stacked up with perennial ice, which means that it now becomes perennial ice as well. I wonder how thick the thick ice was last year, and the extent of it, compared to this year, at minimum.
Mike Bryant (16:13:20) :
I wish i could see the satellite photo for May 18, 1987, when the three US subs surfaced in a watery North Pole. For some reason, Cryosphere Today doesn’t have it. Check the “compare two dates”, maybe you can find it.
Really, take a look at the CT daily photos, you’ll see a small black disk, this represents region around the pole which the satellite can’t see because of its orbit! So you’re not going to see your subs, even if that weren’t so you’d still be out of luck because the imager used then used 25km sq pixels.
So, JP Rourke:
Pugh has a support ship he will sleep on every night… this may be more of a stunt than a ’significant event’, but he’s not an idiot
So, you are saying the man is a fraud.. I agree.
Rain… in Louisianna! OMG!!!
A voice on the radio declares: “obviously, this is a very fluid situation”.
Honest. You can’t make this up!
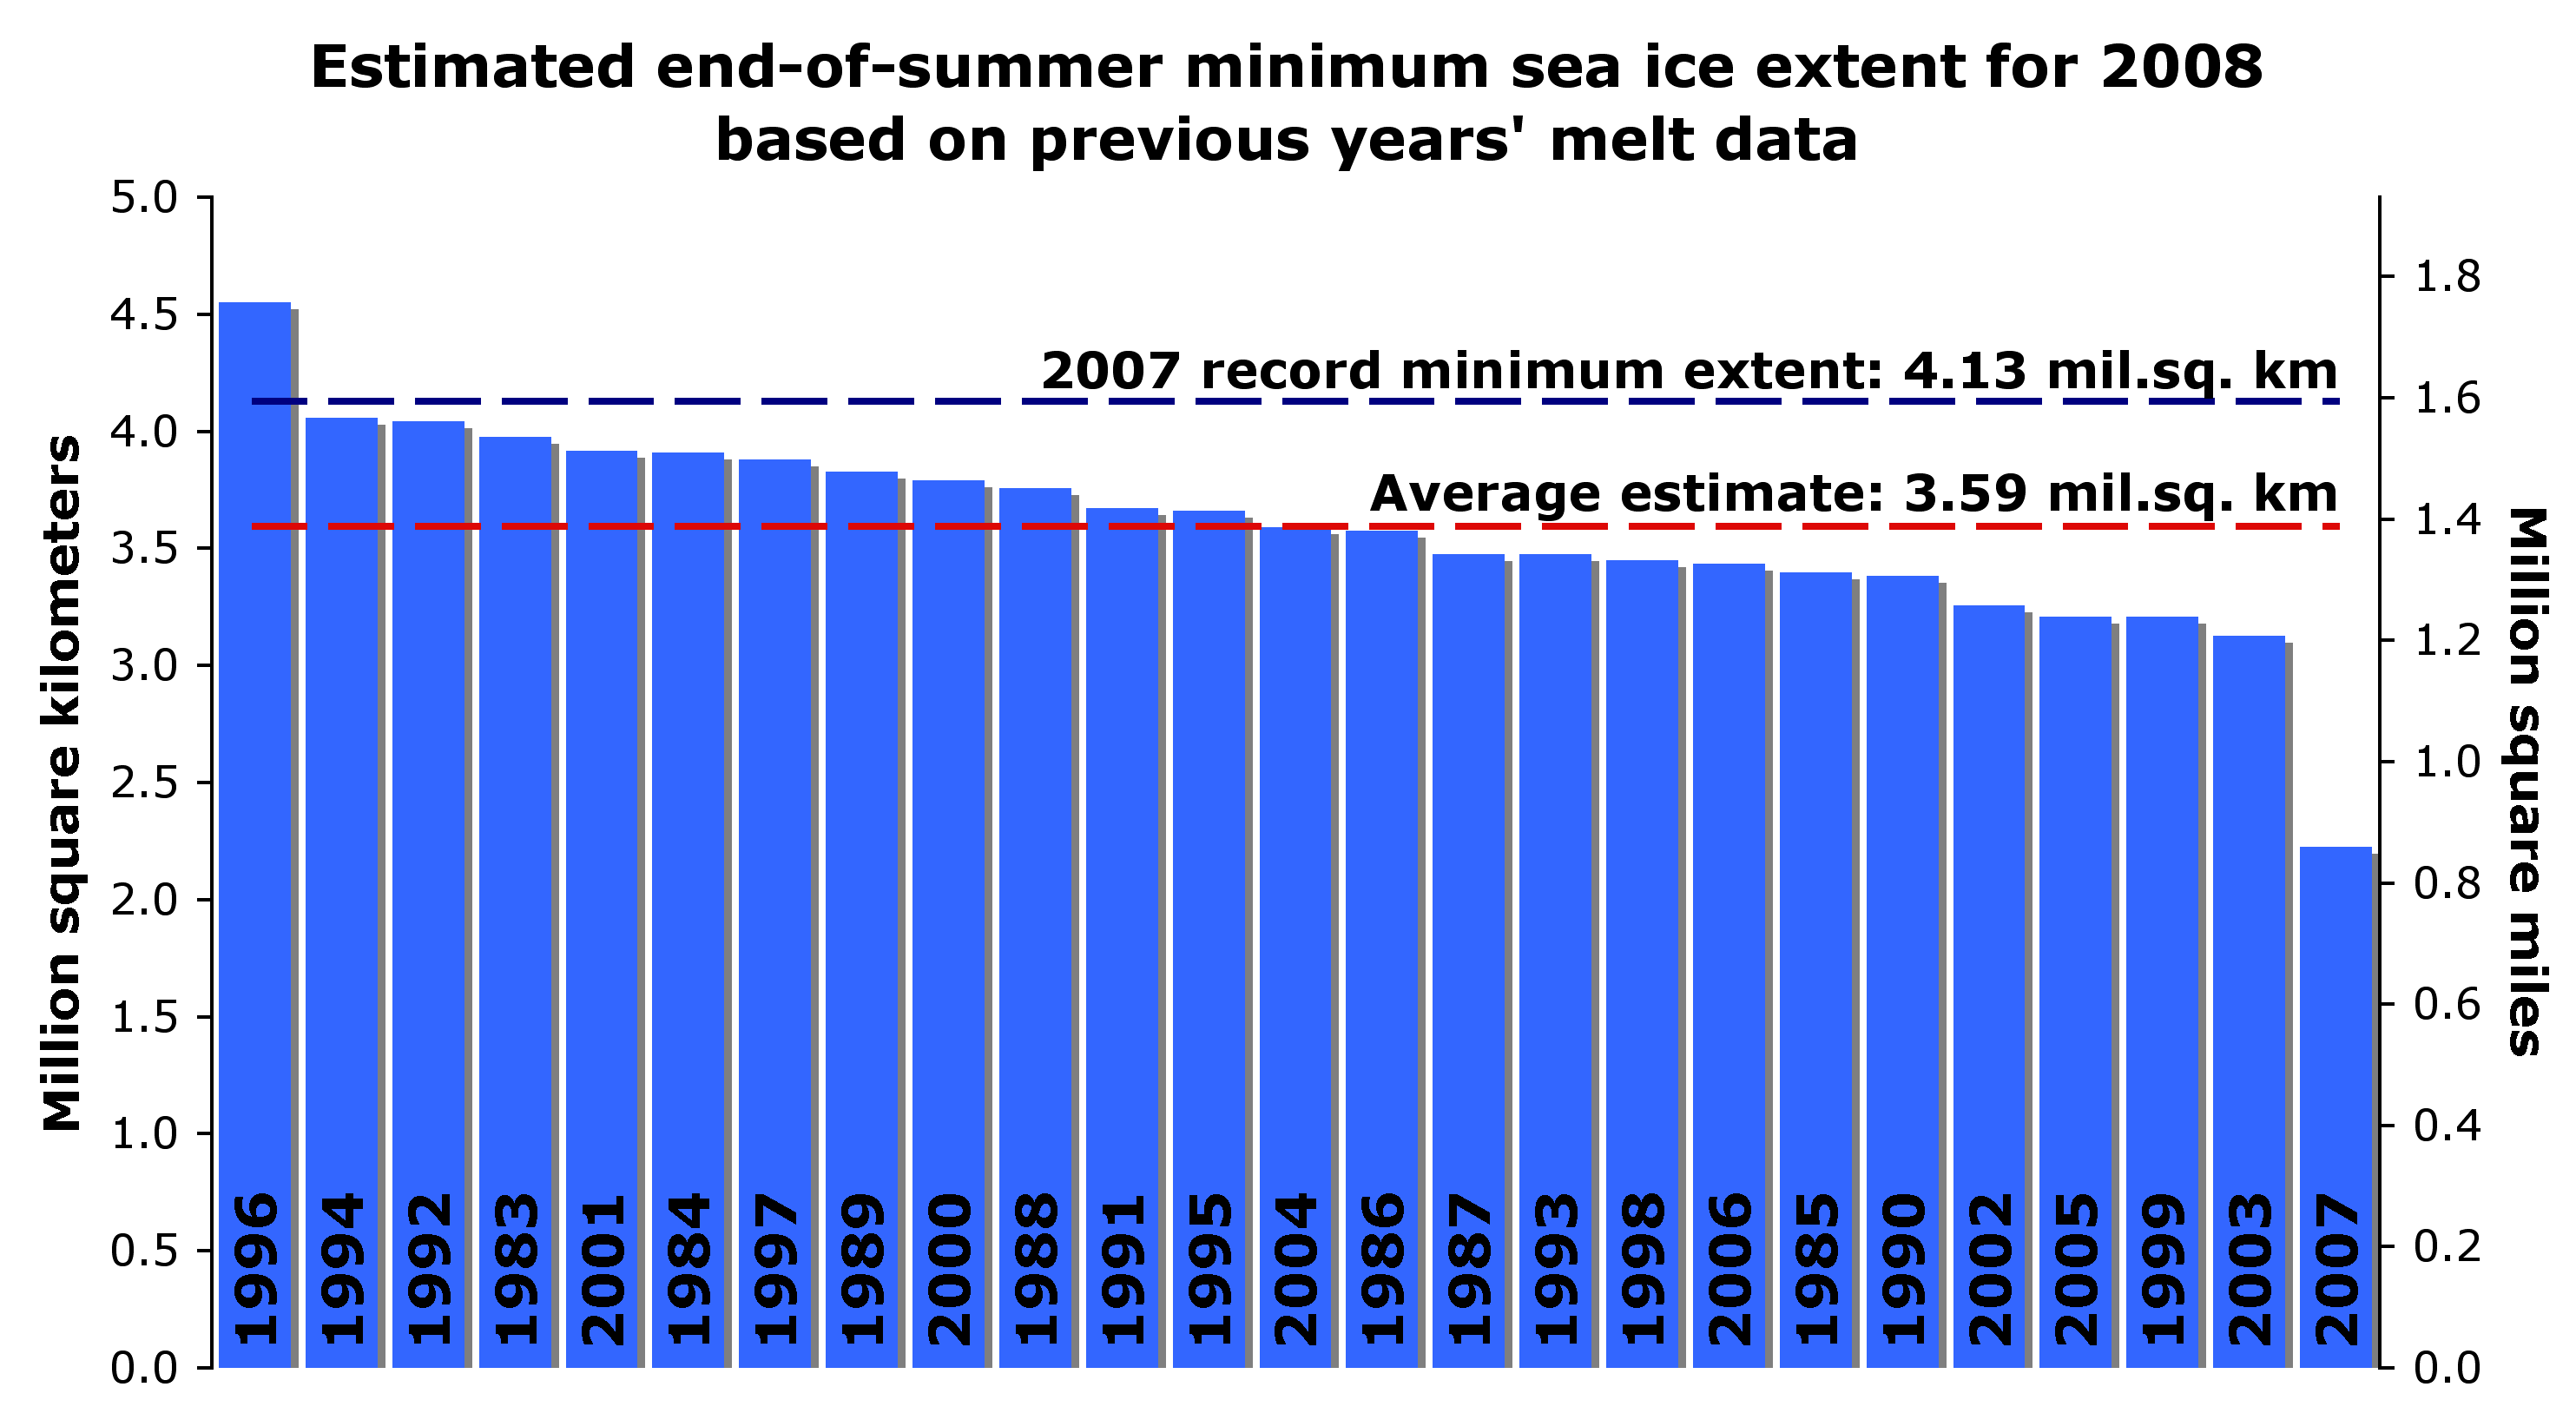
Can someone please explain the blue bar graph? I can’t make sense of it.
This one:
http://wattsupwiththat.files.wordpress.com/2008/08/ddw82wws_12fcrjggfn_b.jpg
I can understand the dashed blue line & the dashed red line, these are the 2007 minimum extent and the average of some estimates for the 2008 minimum extent. The blue bars are clearly ordered by height and labeled with the year, the height being something related to ice extent . Since 2007 is the record low and 2007 shows the smallest bar this makes sense.
What does the hight of the blue bar mean? Does it have a physical meaning? For instance, what does ~2.3 million square kilometers have to do with 2007? It is not the ice extent minimum since this would make 2007 have the same height as the dashed blue line. It cannot be difference from the average because the 2007 bar would be the largest.
How do the heights of the dashed lines relate to the height of the blue bars? Aren’t they graphed together for comparison?
Thanks,
Lyman Horne
Phil I don’t want to see the subs or the North Pole. I only want to see the picture.
Jumping the gun again Steve!
We know from official US Weather Bureau records that it was possible to sail as far as 81N latitude in ice-free water, during a similar warm period in 1922.
This was a ‘similar warm period’, then explain why that summer a us/canadian expedition to Wrangel Island in the Chukchi Sea could not be resupplied because it was inaccessible by sea due to pack ice (only one, an inuit woman survived rescued in Aug 1923), no trouble this year! A couple of years later a soviet expedition was similarly cut-off for three years until finally rescued with great difficulty by a soviet ice-breaker on Aug 28th after battling through dense ice at a rate of a few hundred metres/day!
So while ice had receded at one end of the Arctic it had done the opposite at the other end!
One thing we can state with a degree of certainty, is that there likely will be more multi-year ice in 2009 than there was in 2008.
With a very low degree of probability actually, the current ice area (3.239) is almost back to last year’s value. (Had you actually shown today’s sea ice plot that would have been more apparent). Extent may or not surpass last year’s value all that will mean is that a very similar area of ice will be spread out differently this year, all it would take to give a low value would be to blow the emerging multiyear ice back into the central Arctic.
By the way overwriting your caption over the JAXA graph without clearly indicating that you did it, and describing it as 2008 Forecast Minimum’, something NSIDC never called it, is sharp practice. (the only reference to a forecast on the site you took fig 4 from gives a 59% chance of exceeding 2007). Have you contacted JAXA/EORC for permission to use their graph as agreed to by you when you used their site?
http://www.ijis.iarc.uaf.edu/en/sitepolicy.htm
Can someone please explain the blue bar graph? I can’t make sense of it.
Thanks,
Lyman Horne
Try accessing the NSIDC site where Steve G took it from (without a link) here:
http://nsidc.org/arcticseaicenews/2008/050508.html
Why all the focus on the arctic? If it is global warming shouldn’t both poles be affected? I note the sea ice graph above showed only the north while the south was available on the same page but was not quite as convenient. Until and unless the southern hemisphere starts acting like the northern hemisphere, I’m gonna chalk up any short term (in the climate sense of short) trends in sea ice to ocean currents and other factors (pollution reduced albedo, volcanic activity) rather than GLOBAL warming. Here’s Antarctica:
http://nsidc.org/data/seaice_index/s_plot.html
Mike: Good to see we can both have a sense of humor!
Steven: I only have monitored NSIDC, and today’s chart (8/30 data) was the only one that was ‘flat’ (yesterday’s chart, 8/29 was still ‘melting’)… if you’ve got another, I’d like the reference. (and it’s actually ‘John’)
Robert: I wouldn’t call Pugh a fraud. If you read the article, he states pretty clearly he doesn’t expect to make it to the Pole *this* year, but wants to see how far he can get. I suspect he’ll keep trying and comparing (that may be in the article also, I forget). He also states pretty clearly that whether or not he makes it to the pole, he is doing this to raise awareness of the issue – so in essence, he’s saying it’s mostly for the p.r. If he was a fraud, he wouldn’t be admitting all that.
I just don’t think his story is all that significant (for that matter, if he really wanted to reach the Pole, it looks like he’d have much better luck from the Alaska side, probably have it a bit warmer and with the wind perhaps).
Lyman:
The height of the blue bar is where we will end up this year as a minimum ice extent, *IF* this year’s melt progresses like each of the last 25 years, but starting with this year’s ice extent (I think this is from April or May).
IOW, starting with this year’s ice extent, if the melt season goes as slowly as it did in 1996, you’ll get about 4.5 million at the end of the season; but if the melting goes as fast as it did in 2007, you’ll get the blue bar on the far right.
Keep in mind that this graph says absolutely *nothing* about the expectation of current weather (will it be more like 1996 or 2007, and why?), or what anomalous things could occur that have not before, or have not in those combinations… ALL that this graph does is identify a historical range (over the last 25 years) of what could happen, based on *one* parameter (rate of melting). It is a range of estimates, it is not in any sense of the word a ‘prediction’.
Basically, it’s just data.
Where is the source for this quote:
It wasn’t linked. That’s bad form.
CaM- ” Until and unless the southern hemisphere starts acting like the northern hemisphere”
That may not be too far off, the warmer deep currents are melting the underwater ice, reducing salinity and, paradoxically, increasing surface area of ice. This summer may be interesting, no? The reduction in ice depth (not visible from surface observation) is the reason for the disintegration of ice shelf this winter!
Watching the news on RAI 2 (Italian State TV) this morning, I saw that the world is about to end, ice bears ( 6,000 confirmed dead ) the North Pole is an Island, grass is growing in Alaska were last year there was 2 meters of ice, that an ozone hole the size of Europe has opened above the North Pole etc, etc, changing to Berlusconi’s Italia 1 the story was no better, It appears that Mr. Gore has started to spend his $300,000,000.
Do you have any refernce for this claim? I would be very interested in it.
The NSIDC bar graph is from their May 5th press release, which is linked to in this story. It predicts minmum sea ice extent based on survivability of first-year ice in previous years.
The problem with the graph and underlying analysis is that it didn’t take into consideration either the latitude or the actual measured thickness of the first year ice. The June 3 and July 17 NSIDC press releases discuss these problems and why the ice is melting slower than they expected.
http://nsidc.org/arcticseaicenews/2008/060308.html
http://nsidc.org/arcticseaicenews/2008/071708.html
JP,
I daily measure relative sea ice extent from Cryosphere Today maps – as discussed prominently in this article and the previous one (linked to in this article.) There has been very little change over the last four days, and based on the current ice distribution and temperature plots of the Arctic it seems unlikely to reduce much further.
It would be much appreciated if some people would read the article a little more carefully before commenting. You might also note that (as mentioned above) Dr. Meier at NSIDC has graciously agreed to answer my Arctic questions in an upcoming Q&A piece.
As far as my discussion of the earlier Arctic warm period goes, this is based on GISS temperature records and the US Weather Bureau article – again as discussed in this article.
Most of the long-term GISS station records above 60N which extend from at least 1920-2008, show temperatures as being at least as warm or warmer 70 years ago. This pattern is seen between (at least) 115W and 122E longitude, which comprises 2/3 of the Arctic. Stations around the Bering Strait show a different pattern, apparently controlled by the PDO.
Thank you for the link, the second article does mention the changes from last year but still maintains the highly alarmist tone.
I wanted the information to provide refutation to an article on Universe today:
http://www.universetoday.com/2008/08/29/satellite-images-show-arctic-ice-at-another-low/
It is just sloppy writing since the story does not back up the headline. The story speaks of forecast, the headline of current fact.
Steven:
Yes, I read your article and understood you were counting pixels from the CT maps, but I didn’t realize that was the resulting ‘chart’ from which you determined that the melting has stopped and is unlikely to melt much further, leading to your prediction that this season’s minimum ice extent will be at least 4.749+ million sq km.
However, I was under the impression that the NSIDC chart measures extent, while the CT maps shows area and concentration; much has been made of how these do not always track each other in concert.
I applaud your initiative to actually count the pixels yourself and make your own charts but, based on the NSIDC charts (the one showing the data from which the official minimum ice extent is taken each year), it still appears to me that we can expect to see less than 4.7 million sq km by the date of the minimum, which I expect is still at least 2 weeks away.
You know, it’s really quite amusing that each of us wants to say this or that about what *will* happen, when waiting just two or three more weeks will tell us what clearly *has* happened!
There is a wealth of data to indicate the North had low levels of ice in the pre AGW 1930’s and early 40’s. Science just chooses to ignore this.
Henry Larsen easily sailed the St. Roch from Halifax to Vancouver in 86 days in 1944. Through the Northern route of the Northwest Passage that is blocked this year. In 1947 the St. Roch and a large American ice breaker attempted to go through the same passage, the St. Roch from the West and the ice breaker from the east. Neither could make it.
In 1937 the Nascopie and the Aklavik combined to cross the northern route of the NW Passage.
“In 1937 the ship sailed from the East to Prince Regent Inlet and into the Bellot Strait to allow the Hudson’s Bay Company to establish Fort Ross. There she was met by the schooner Aklavik which had sailed into Bellot Strait from the West. With the historic meeting of the two at Fort Ross, the North West Passage became a reality.”
http://www.hbc.com/hbcheritage/history/transportation/nascopie/
JP,
Looking at the NSIDC graphs, it appears that melt normally bottoms the first week in September (this week.) Given that the edge is closer to the pole than normal this year, it would not be at all surprising if we see little little or no further reduction in ice extent. Perhaps even an early increase in extent because temperatures at the edge are already below freezing.
Today’s graph is again flat.
http://nsidc.org/data/seaice_index/images/daily_images/N_timeseries.png
Gaudenz:-
The link you requested, this gives a good overview of the subject
http://www.jsg.utexas.edu/walse/statement.html
i am pretty puzzled by all these references to early EXPEDITIONS into arctic waters.
that ship x (often well prepared) could to trip y (often multi years!) in year Z does NOT support your claims, that the situation was similar.
if you have real evidence that this was the case, then please bring it on!
and please try to stic to scientific papers. no chinese maps please!
There’s an article about the Arctic ice in today’s Daily Telegraph:
http://www.telegraph.co.uk/earth/main.jhtml?xml=/earth/2008/08/31/eaarctic131.xml
It claims that the North Pole has become an island that can be circumnavigated. But the map appears to be wrong. At the top, and just to the right, there is an ice-free gap on the Siberian coast. But the latest NSIDC image clearly shows solid ice in that area. Does anyone know where this image came from?
If the NSIDC image is correct then the image used in the Telegraph article is either from a different date, or does not use NSIDC data – or it has been doctored. Does anyone have any thoughts?
Chris
I’m with sod, if you don’t have satellite images to support claims of low ice in the past, it never happened.
Chris Wright – “…the latest NSIDC image clearly shows solid ice in that area…”
It is worth to note that the maps om NSIDC will show anything above 15% concentration of sea ice as white. So much of it might actually be slush. Better use the maps on Cryosphere Today
http://arctic.atmos.uiuc.edu/cryosphere/NEWIMAGES/arctic.seaice.some.000.png
or from University of Bremen:
http://www.iup.physik.uni-bremen.de:8084/amsr/arctic_AMSRE_visual.png
Temperatures around the pole have dropped to -5.5C
http://www.arctic.noaa.gov/latest/noaa1.jpg
http://psc.apl.washington.edu/northpole/30065_atmos_recent.html
I wonder how that is affecting Lewis Pugh’s kayaking?
Uk ITV News at Ten state arctic has less ice in Sept 2008 than it has had in the whole of human existence, wow.
Sod
The St. Roch with it’s little 300 HP motor and top speed of 6 miles per hour went from Halifax to Vancouver in 86 days in 1944 through the NW Passage. That is a fact. I gave an example of other boats navigating the passage in 1937 in a single year. Also a fact.
Obviously the ice was at a low level similar to today.(pre SUV)
http://www.ucalgary.ca/arcticexpedition/larsenexpeditions
Looking like the quick meltback came to a abrupt or almost abrupt halt. SO2 experiment from Kasatochi might be working. A lot of that SO2 should be converted to aerosol now. I had commented not long after that eruption about a possible early minimum on the extent because of it. Lets see what this week brings.
sod (10:04:42) asks:
if you have real evidence that this was the case, then please bring it on! and please try to stic to scientific papers. no chinese maps please!
There is the Divine Dick paper (No kidding, Mr/Ms Moderator!)
http://www.agu.org/pubs/crossref/2006/2004JC002851.shtml
“a similar shrinkage of ice cover was observed in the 1920s–1930s, during the previous warm phase of the low-frequency oscillation, when any anthropogenic influence is believed to have still been negligible”
Reply: Between that citation above and the discussion of poor Catania’s pores in the other thread, I am bemused today. ~ charles the moderator.
The St. Roch with it’s little 300 HP motor and top speed of 6 miles per hour went from Halifax to Vancouver in 86 days in 1944 through the NW Passage. That is a fact. I gave an example of other boats navigating the passage in 1937 in a single year. Also a fact.
Obviously the ice was at a low level similar to today.(pre SUV)
the St. Roche was a special arctic vessel. why are all these remarks trying to downplay this?
the conclusion that one vessel slipping through proves that the ice situation is similar to this summer, is simply false.
“a similar shrinkage of ice cover was observed in the 1920s–1930s, during the previous warm phase of the low-frequency oscillation, when any anthropogenic influence is believed to have still been negligible”
yes, and the article is comparing ice up till 2002.
http://arctic.atmos.uiuc.edu/cryosphere/IMAGES/current.anom.jpg
again, the claim that “similar situation to 2002” allows the conclusion that it was similar to today, is simply false.
i am still looking forward to real evidence for your claims!
Didjeridust,
thanks for the links. In fact the image used by the Telegraph was from the second link (University of Bremen).
Chris
Sod,/ Mike Bryant
[Snip – be nice] … as a naval design engineer any vessel (including figments of your imagination ) with a 300 hp engine would need an additional 1,000 hp plus to keep moving in slush ice, but as you rightly pointed out you require satellite photos to believe, but in 1937, 1944, the photos were under the control of Buck Rodgers and are not yet off the secrets list.
“One thing we can state with a degree of certainty, is that there likely will be more multi-year ice in 2009 than there was in 2008. This is because the 2008 melt season is ending with more ice area than 2007. ” – Steve Goddard in the main article.
1) The season hasn’t ended yet.
2) More, but only by about 0.1million kmsq or so.
3) Since 2002 every year has shown a drop in perennial extent on the preceding year, yet both overall ice area and extent do not show that behaviour. i.e. while some years had more ice than others every year had a reduction in perennial ice area as measured by Quikscat.
See Nghiem 2007 “Rapid reduction of Arctic perennial sea ice.”
1.68Mb pdf, here. Check out figure 3, March 2008 down another 1 million sqkm from March 2007.
By the way Steve Goddard also says:
“Dr. Meier has confirmed that counting pixels provides a “good rough estimate” and that NSIDC teaches pixel counting to CU students as a way to estimate ice extent. ”
From Walt Meier at RealClimate:
http://www.realclimate.org/index.php/archives/2008/08/north-pole-notes-continued/#comment-96329
Sod,/ Mike Bryant
[Snip – be nice] … as a naval design engineer any vessel (including figments of your imagination ) with a 300 hp engine would need an additional 1,000 hp plus to keep moving in slush ice, but as you rightly pointed out you require satellite photos to believe, but in 1937, 1944, the photos were under the control of Buck Rodgers and are not yet off the secrets list.
there is evidence, that is NOT satellite data. Hadley for example provides data back to 1870.
http://hadobs.metoffice.com/hadisst/data/download.html
but it doesn t show anything that is similar to what we see today.
again: that a single ship can slip through, does NOT prove, that we have similar open water to 2007. you need to provide a lot more information, to show that.
Sod,
The voyage of the St. Roch is well documented. Read the “Big Ship”‘ by Henry Larsen. Of course that would require some effort on your part.
Shawn Whelan (15:40:22) :
Sod
The St. Roch with it’s little 300 HP motor and top speed of 6 miles per hour went from Halifax to Vancouver in 86 days in 1944 through the NW Passage. That is a fact. I gave an example of other boats navigating the passage in 1937 in a single year. Also a fact.
Regrettably not, what you gave an example of was an icebreaker forcing its way through to meet another ship part way through which had come from the other side, not quite the same thing!
Compare that with the Polarstern’s transit a week or so ago:
“Contrary to Roald Amundsen, who was the first to sail the sea way, we needed only 4 days instead of 3 years.”
“Only few small ice fields forced the ship to reduce its speed.”
“Fortunately, the sea ice has retreated far to the north along our track, and only small ice fields in the Canada Basin force the ship to slow down.”
http://www.awi.de/en/infrastructure/ships/polarstern/weekly_reports/all_expeditions/ark_xxiii/ark_xxiii3/24_august_2008/
Obviously the ice was at a low level similar to today.(pre SUV)
Obviously not since Larsen reported having ‘to battle against the ice along the Alaskan coast’ whereas now unreinforced yachts are sailing through there.
http://www.tyhina.com/Images/Progress-Map.gif
Here’s a photo from another yacht on the same route, note the ice!
http://baloumgwen.canalblog.com/albums/resolute_tuktoyaktuk/photos/29568516-tuktoyaktuk.html
Here’s a photo of three of the yachts in transit earlier this year in Gjoa Havn (where Amundsen spent the summer marooned in ice).
http://www.tyhina.com/Images/2008/1-8boatsGjoa.jpg
When Larsen made his transits it was an extremely dangerous and difficult journey in conditions much different than today’s. By suggesting that the conditions were such that the journey could have been made by an unreinforced fiberglass yacht as can be done today I think you’re demeaning the memory of some very brave men. Which is not to say that it’s not a dangerous adventure now but the two aren’t in the same league.
If every bit of sea ice melted in the Arctic, there is not one shred of evidence that it would be catastrophic for life on this planet.
Ok here is some really wild speculation. It seems to me that the warming of the last century has, if anything, moderated earth’s climate. Looking through some old books on google books, “warm arctic” search term, it seems that the arctic has had moderate temperatures as recently as 3,000 years ago. The fossils and remains in the region testify to this. Also, it seems that there have been no continental high temperature records set in many years. I think that it is likely that runaway global warming, would in fact be a global tempering, so that the temperatures would be more even worldwide. Imagine Hawaii all over the earth. This seems as likely to me as any catastrophic outcome.
http://www.ecoenquirer.com/Frosty-Cove-Alaska.htm
Northwest Passage August 15, 2008
The Amodino is stuck in the ice. They are much larger and can hopefully push their way around. Good luck to them. The Berri is too small and under powered to help, if there was a prayer to get close enough to help. I saw a small oil tanker with a bent propeller and shaft from the ice. The shaft was designed for the arctic and was several feet (1Meter) diameter. This is scary stuff.
http://awberrimilla.blogspot.com/2008/08/almost-out.html
Did Amundsen have GPS, satellite, phone and Internet to plot out his route real-time?
I have also written code to do a pixel count on Cryosphere Today image. It uses the ice density scale that appears in the top left corner of the side-by-side images.
It applies a mask to all land areas, so snow on land is not considered. I calibrated for the projection by identifying the latitudes of about a dozen points on the image and their corresponding radial distance from the North Pole on the image. These latitudes vs. radial distances were then fit to a function, so the latitude of each colored pixel and its cosine projection could be calculated.
The most difficult problem has been matching the color scale to the actual pixel colors. There is not a one to one correspondence between the color pixels in the image and the pixels in the color scale (which is at the upper left corner of the image). Consequently, some color interpolation must be done.
I have run my code for every day in 2007 and 2008 so far.
What I have achieved so far is a “compressed” version of Cryosphere Today’s “Current Northern Hemisphere Sea Ice Area” graph. By compressed I mean that if I normalize my data to give the same result at the winter maximum, then the summer minimum I derive is greater than Cryosphere Today’s. (Or alternatively, if I normalize my data to give the same result at the summer minimum, then the winter maximum is lower than Cryosphere Today’s.) That is, the yearly change comes out several percent less than Cryosphere Today’s yearly change. I am still working on this issue.
My code is written in LabView (v7.1) using the IMAQ image handling and analysis package. Please contact me if you are interested in more details of the code or have some suggestions concerning algorithms.
Best Regards
Tom Moriarty
ClimateSanity
“Did Amundsen have GPS, satellite, phone and Internet to plot out his route real-time?”
No, but since he couldn’t get out of Gjoa Havn it doesn’t make much difference! Amodino and Berrimilla were trying to get through as soon as possible, a week later the passage was ice free.
Ice chart when A & B went through:
http://ice-glaces.ec.gc.ca/prods/WIS38CT/20080815180000_WIS38CT_0003916928.gif
Today:
http://ice-glaces.ec.gc.ca/prods/WIS38CT/20080901180000_WIS38CT_0003947216.gif
Phil
The Polar Stern is an powerful icebreaker with 20,000hp. About 20,000 more HP than the St. Roch. The St. Roch went through uncharted waters never before travelled in 1944. And they encountered little ice. It was late September when the St. Roch went past Barrow. Might be the same come the end of September this year.
http://ice-glaces.ec.gc.ca/prods/WIS40CT/20080901180000_WIS40CT_0003947354.gif
This boat went through and back again in 1937.
“After the stop at Gjoa Haven, the Akluvik headed up along Boothia Peninsula. Once it reached Bellot Strait, Gall remembers that “the ice was piled up on the reefs and along the shore, and the current was running pretty fast.” At that point he saw an opening and “went for it!” The easterly run through the strait was successful, and the night was spent on the northeast end of the strait, at a location then known as Kennedy Harbour. They returned west through the Bellot Strait the following day, 2 September. Gall admits a certain amount of luck was involved, because their success depended largely on the nature of the ice and the accuracy of their dead reckoning. Nevertheless, the trip remains quite a tribute to their daring.
The Akluvik was 60 feet (20 metres) in length and drew 6 feet (2 metres) of water. It was powered by a 35 hp Fairbanks-Morse engine.”
http://iain-cameron.blogspot.com/2007/07/test.html
Small boats travelled every year to Gjoa Haven in the 30’s.
http://www.kitikmeotheritage.ca/Angulalk/hudsons/hudsons.htm
The Polarstern is a 20,000hp icebreaker. About 20,000 more hp than the St. Roch. The St. Roch easily navigated the northern route of the NW Passage in 1944 and encountered little ice in the passage. It was late September when they went past barrow. Could Barrow be blocked again this year? Looks likely.
http://ice-glaces.ec.gc.ca/prods/WIS40CT/20080901180000_WIS40CT_0003947354.gif
Here is Gjoa Haven in 1930. Look similar? Lots of pictures from the earlier part of the century showing no ice similar to today.
This boat went through from Cambridge Bay past Gjoa Haven then through the Bellot Strait and back.
“The Akluvik was 60 feet (20 metres) in length and drew 6 feet (2 metres) of water. It was powered by a 35 hp Fairbanks-Morse engine. ”
http://iain-cameron.blogspot.com/2007/07/test.html
The Polarstern is a 20,000hp icebreaker. About 20,000 more hp than the St. Roch. The St. Roch easily navigated the northern route of the NW Passage in 1944 and encountered little ice in the passage. It was late September when they went past barrow. Could Barrow be blocked again this year? Looks likely.
http://ice-glaces.ec.gc.ca/prods/WIS40CT/20080901180000_WIS40CT_0003947354.gif
Here is Gjoa Haven in 1930. Look similar? Lots of pictures from the earlier part of the century showing ice conditions similar to today.
This boat went through from Cambridge Bay past Gjoa Haven then through the Bellot Strait and back.
“The trip of the Akluvik required a great deal of preparation at its home port of Cambridge Bay. The crew had to be prepared, for example, to spend the winter away from home if caught in the ice. The big drop of trading goods on this trip in late 1937 was to be at Gjoa Haven on King William Island, and then the target was to transit the Northwest Passage – Bellot Strait, on this occasion – by 1 September, before freeze-up.
After the stop at Gjoa Haven, the Akluvik headed up along Boothia Peninsula. Once it reached Bellot Strait, Gall remembers that “the ice was piled up on the reefs and along the shore, and the current was running pretty fast.” At that point he saw an opening and “went for it!” The easterly run through the strait was successful, and the night was spent on the northeast end of the strait, at a location then known as Kennedy Harbour. They returned west through the Bellot Strait the following day, 2 September. Gall admits a certain amount of luck was involved, because their success depended largely on the nature of the ice and the accuracy of their dead reckoning. Nevertheless, the trip remains quite a tribute to their daring.
The Akluvik was 60 feet (20 metres) in length and drew 6 feet (2 metres) of water. It was powered by a 35 hp Fairbanks-Morse engine. ”
http://iain-cameron.blogspot.com/2007/07/test.html
Phil,
So what you are saying is that after 105 years of catastrophic global warming, with the help of satellites, GPS and modern communications, a carefully timed trip through the Northwest passage can be easier – if you get luckier than this oil tanker did two weeks ago?
I saw a small oil tanker with a bent propeller and shaft from the ice. The shaft was designed for the arctic and was several feet (1Meter) diameter. This is scary stuff.
I’m guessing that slush won’t bend a 3 foot thick rotor.
I’m sure that was a pretty awesome run, in the Akluvik, but was that really a *transit* of the Northwest Passage?
For one thing, Cambridge Bay is in the southern route, not the Parry Channel which is what they have been talking about last year and this year, the only commercially-significant NWP.
For another, it’s in the middle of the southern route – if that’s their starting and ending point, at best they transited about half of the southern route.
As for Barrow, of course it could be blocked again this year – isn’t it blocked every year? The point is, is the entire NWP (Parry Channel) navigable for commercial shipping, long enough and clear enough for a transit without an icebreaker escort? AFAIK that is generally what is referred to as an ‘open Northwest Passage’.
Last year it was ‘open’, although the Northeast Passage was blocked. This year, both the Northwest Passage (Parry Channel) and Northeast Passage (aka Northern Sea Route) are ‘open’. Can you say that for 1930, or 1937, or 1944 or any of those other years?
Patrick Henry:
Yes, that is definitely amazing – but it’s even worse than you thought – he didn’t say a 3ft diameter rotor, he said it was a 3ft diameter *shaft*!!
And that’s a pretty big tanker, I would think, do they normally run in the southern channel?
Which tanker was that anyway?
I saw the Queen Mary once, it had an even larger prop shaft (but not
Patrick Henry (14:36:48) :
Phil,
So what you are saying is that after 105 years of catastrophic global warming, with the help of satellites, GPS and modern communications, a carefully timed trip through the Northwest passage can be easier – if you get luckier than this oil tanker did two weeks ago?
What makes you think that tanker bent its shaft two weeks ago?
I saw a small oil tanker with a bent propeller and shaft from the ice. The shaft was designed for the arctic and was several feet (1Meter) diameter. This is scary stuff.
“I’m guessing that slush won’t bend a 3 foot thick rotor.”
I’m guessing it won’t either, of course that oil tanker wasn’t anywhere near the NW Passage either, somewhere in Alaska perhaps Nome and who knows when?
This boat went through from Cambridge Bay past Gjoa Haven then through the Bellot Strait and back.
“The trip of the Akluvik required a great deal of preparation at its home port of Cambridge Bay. The crew had to be prepared, for example, to spend the winter away from home if caught in the ice. The big drop of trading goods on this trip in late 1937 was to be at Gjoa Haven on King William Island, and then the target was to transit the Northwest Passage – Bellot Strait, on this occasion – by 1 September, before freeze-up.
That isn’t a transit of the NW Passage, check it out on Tyhina’s chart, they sailed that part of the Passage in late Aug this year in a few days.
http://www.tyhina.com/Images/Progress-Map.gif
In a trip of just that length in 1937 at this time of year they ran the risk of being frozen in for the winter that tells you the difference between then and now, this year no ice!
Gary Ramos sailed Arctic Wanderer single-handed through Bellot Strait about a week ago (from CB) and is now heading for Greenland.
After the stop at Gjoa Haven, the Akluvik headed up along Boothia Peninsula. Once it reached Bellot Strait, Gall remembers that “the ice was piled up on the reefs and along the shore, and the current was running pretty fast.” At that point he saw an opening and “went for it!” The easterly run through the strait was successful, and the night was spent on the northeast end of the strait, at a location then known as Kennedy Harbour. They returned west through the Bellot Strait the following day, 2 September. Gall admits a certain amount of luck was involved, because their success depended largely on the nature of the ice and the accuracy of their dead reckoning. Nevertheless, the trip remains quite a tribute to their daring.
It does indeed.
Phil,
Look at the picture of Gjoa Haven from 1930 on this link. There was many of these boats motoring around.
http://www.kitikmeotheritage.ca/Angulalk/hudsons/hudsons.htm
Through the Bellot Strait is the route Larsen took on his West to East passage of the NW Passage. Do you know where the Bellot Strait is? The Tyhina did not invent the NW Passage in 2008.
Then they merrily motored back to Cambridge Bay. Also in photos on the link with no ice. There was many boats like this motoring around the NW Passage in the Thirties. Obviously the ice was at a low level at the times of these voyages. Similar to this year. Then in the late 40’s and 50’s several of the Hudson Bay stations were abandoned due to to much ice.
JP Rourke
The Parry Channell route is not open to non icebreaker boats. The route of the St. Roch in 1944 is blocked this year. It was less ice in 1944? Appears so.
The Parry Channell route is not open to non icebreaker boats. The route of the St. Roch in 1944 is blocked this year. It was less ice in 1944? Appears so.
floating sea ice is blown around by the wind.
that one small sub-route is blocked this year, does NOT prove, that there was less ice in 1944.
that one ship came through, does not prove that the passage was open.
i don t think that this is very difficult to understand. when you want evidence, that compares to what we see today, you need much much more!
Shawn:
Yes, Larsen did take the Bellot Strait (which separates Somerset Island from the mainland) on the east->west route – but that’s not the commercially significant route, it doesn’t have the deep water of the Parry Channel route… see:
http://www.athropolis.com/map9.htm
The yellow route is Larsen’s 1944 trip, from west to east, but he did not take the Bellot Strait – instead he took the Parry Channel, which is the first known transit of the deep-water route that could become commercially significant – that is the route that first opened up to non-icebreaker ships on Aug 21, 2007, and was reported to be open on Aug 27th of this year. (The St. Roch, while not exactly an icebreaker ship we think of today, was ‘ice-fortified’, modified, and fitted with a steel icebreaking ‘shoe’ over the bow of the ship)
Note: I’ve only seen one mention from NSIDC, on Aug 25th, that the Parry Channel was ‘nearly open’ for non-icebreakers and would be within a few days; a sketchy article in Scientific American confirmed this on the 27th. The maps seem to agree also (http://www.iup.uni-bremen.de:8084/amsr/arctic_AMSRE_visual.png) but since I haven’t read it anywhere else, and since the AMSRE map seems to show the ice gone one day and a few spots back the next, back and forth over the last two weeks, it’s probably not 100% open – yet.
I have no way of knowing if there is more or less ice than in 1944; however, given that they took 86 days even in an ice-fortified ship, I expect they encountered considerable ice at various points. Do you have information that they did not?
Lewis Pugh is starting to face reality. Water temperatures dropped 4C overnight Monday and he is suffering. No mention of his location of course, which is probably at least 500 miles from the pole.
http://polardefenseproject.org/blog/?p=144
The story is full of irrational and contradictory statements, but what is new about that?
Military buoys are showing air temperatures in almost the entire Arctic Basin well below the freezing point of seawater. Look for widespread ice to start forming soon. The area around Hans Island has frozen over very quickly during the last 5 days.
Military buoys are showing air temperatures in almost the entire Arctic Basin well below the freezing point of seawater. Look for widespread ice to start forming soon. The area around Hans Island has frozen over very quickly during the last 5 days.
[snip] sea ice area is LOW. extremely LOW, actually.
http://arctic.atmos.uiuc.edu/cryosphere/IMAGES/current.365.jpg
why is there not a single word about this in your posts?
Argh*.
I wrote it backwards… Larsen’s 1940-42 trip was WEST to EAST, and 1944 was EAST to WEST… I thought I had it the wrong way, so I corrected it… but I was right the first time! (I shouldn’t be posting at 4 a.m.)
*TLAPD (‘Talk Like a Pirate Day’ is coming up soon… Sep 19th!)
JP Rourke
This is a better map of Larsen’s route. Larsen spent twenty years running the St. Roch around the Arctic. And there were probably a hundred other boats motoring around the Arctic. This evidence is for some reason totally ignored by the scientific community.
http://www.ucalgary.ca/arcticexpedition/larsenexpeditions
Larsen intended to take the Northern route through the NW Passage on the East West journey and headed that way. He was called back on business and then had to take the southern route. Without the late start likely he would have made it right through in 1941. (at least on the southern route since the Nascopie travelled the Eastern part of the passage ahead of Larsen.)
The voyage is well recorded in Larsen’s autobiography, “The Big Ship”. They ran into little ice on the East to West trip in the non-icebreaker St. Roch. Obviously, 2007 wasn’t the first time the passage was open to
non-icebreakers.
The St. Roch took 86 days to go from Halifax to Vancouver(7,295 miles), not 86 days to traverse the Passage. And through uncharted waters where they would sound the bottom with a lead weight and string 24 hours a day.
I have seen nothing to indicate the Perry Channel route opened to non-ice breakers in 2008 and now it is starting to freeze.
Good luck to that kayaker.
Temps in Alert are well below freezing and have been consistently colder than 2007. He will be kayaking on hard water.
http://www.climate.weatheroffice.ec.gc.ca/climateData/hourlydata_e.html?timeframe=1&Prov=CA&StationID=42463&Year=2008&Month=9&Day=1
Shawn:
Thanks for the link. I haven’t read any books about Larsen, but I will – hopefully the stories aren’t as dire as the Shackleton story, for instance!
Although I still question whether the east-to-west route, using the Prince of Wales Strait instead of the McClure Strait can be considered a commercially navigable route (can today’s supertankers or, at least, bulk carriers make it through the Prince of William Strait?), I think it’s close enough that I’ll agree that 2007 is probably *not* the first time the NWP has been ‘open’.
Without reading the book I obviously can’t say I know any better than you about the ‘ice quality’ in the 1944 transit, but from the quote in the article you cited:
“In September the ship was nearly destroyed by hurricane force winds while at Tuktoyaktuk, yet the ice had been lighter than the previous summer. As a result, Larsen decided to try to complete the passage without having to winter in the Arctic. Traveling west along the coast of Alaska, the St. Roch found itself in a battle against the ice as it tried to reach Bering Strait before it was locked in for the winter. By September 27th however, the St. Roch had reached the strait and passed into the Pacific.”
It doesn’t sound like it was ice-free, or that they really had an easy time against the ice… so no, it does not sound like they had less ice in 1944 than last year, or this year. In fact, I strongly suspect that an equivalent ship would have it much easier last year or this year, WRT ice, than in 1944.
However, it is pretty clear that the transit of the NWP itself was much less than 86 days… in fact it has to be less than 45 days, from the Aug 12th resupply date at Pond Inlet to the Bering Strait on September 27th. I’m sure that was an amazing feat, probably as much so as Amundsen’s original transit through the southern route, for the conditions back then.
By Sept 27, 2008 it is likely that the route could be frozen over.
How can AGW explain the present low level of Arctic ice when it is only a return to the conditions of the 30’s?
Latest from the Canadian Ice Service showing the Parry Channel route still blocked.
http://ice-glaces.ec.gc.ca/prods/WIS56CT/20080901180000_WIS56CT_0003950692.gif
JP Rourke asked.
Jeff: Who has suggested we have crossed the ‘tipping point’? And besides, there is still enough variability in weather both above and below the climate trendline, for temporary reversals to occur, even after the tipping point is reached. (In any event, I don’t think we have physically reached it yet)
I agree completely, there is certainly enough variation to mask a tipping point. I was just pointing out these widely printed news articles based on an interview with Mark Serreze. You are not the only one to ask who says we have already tipped. I wrote this on my blog
http://noconsensus.wordpress.com/2008/09/03/who-says-weve-already-passed-a-tipping-point/
Jeff, thanks for the reply.
I do recognize that Mr. Serreze walks very close to the line; and it’s easy to see how his words can be interpreted to mean exactly what you said.
However, whatever sensationalized words he might use, it always puzzles me why it would be the skeptics that extend it even further – so that “death spiral” becomes “death”, and “is tipping” becomes “passed the tipping point”.
I am not splitting hairs here… yes, he is ‘raising an alarm’; he no doubt feels that it is his responsibility to do so… but there’s already too many alarmists and ‘infotainment’ media exaggerating what he’s said in the past (“ice-free North Pole” becomes “ice-free Arctic”, for instance), why add to it?
If somebody says “OMG we’re past the tipping point, all is lost!” then I will certainly join you in calling it B.S… but when someone is trying to show why we should be ‘alarmed’ without saying “we’re doomed”, why do you say they’re telling us “we’re doomed”?
http://www.dailytech.com/Arctic+Sees+Massive+Gain+in+Ice+Coverage/article12851.htm
The kayakers give up.
Who was the brains of this bunch?
http://polardefenseproject.org/blog/
In my understanding, this year something strange is happening with SSMI (NSIDC and Cryosphere Today) sea ice data.
Why the difference between NSIDC (SSMI) and IARC/JAXA (AMSR- E) data is bigger this year? In previous years, they were in good agreement (negligible difference) but in the minima of 2008, the AMSR-E sensor sees 230.000 sq. km. more than NSIDC does.
nsidc amsr difference
2002 5,59 5,65 0,06
2003 5,94 6,04 0,1
2004 5,72 5,78 0,06
2005 5,40 5,31 -0,09
2006 5,80 5,84 0,04
2007 4,15 4,25 0,1
2008 4,52 4,75 0,23
http://www.ijis.iarc.uaf.edu/en/home/seaice_extent.htm
ftp://sidads.colorado.edu/pub/DATASETS/seaice/polar-stereo/nasateam/final-gsfc/
PS: I downloaded the NSIDC´s SSMi data in 2006.
2007 and 2008 are completed with the data offered at their “news and analysis” site.